|
This past week's indicators were soft. But the big question is the Fed's policy meeting this week. The Fed wants higher inflation but based on the PPI, import prices, and the dollar there will be debate within the Fed on whether to delay guidance and actual rate increases. But labor market data are improving on average. There will be lots of debate at this week's FOMC meeting.
 Equities finished the week notably down. But the week got off to a moderately good start as Apple unveiled its much-anticipated Apple Watch device as well as a new, thinner MacBook notebook computer. Also, the European Central Bank started its €60 billion per month bond buying program. Tuesday, stocks were sharply lower as fears of possible interest rate increases by the Federal Reserve sent financial markets lower worldwide. A stronger dollar had a notable role in the dip in U.S. equities. Equities finished the week notably down. But the week got off to a moderately good start as Apple unveiled its much-anticipated Apple Watch device as well as a new, thinner MacBook notebook computer. Also, the European Central Bank started its €60 billion per month bond buying program. Tuesday, stocks were sharply lower as fears of possible interest rate increases by the Federal Reserve sent financial markets lower worldwide. A stronger dollar had a notable role in the dip in U.S. equities.
 Stocks were mostly down at mid-week. Traders seemed reluctant to get back into the markets ahead of the Federal Reserve's monetary policy meeting. There was considerable uncertainty about Fed changes in guidance and when "liftoff" occurs. But for the day, traders believed the Fed is going to start tightening in guidance and hint at rate hikes. Stocks were mostly down at mid-week. Traders seemed reluctant to get back into the markets ahead of the Federal Reserve's monetary policy meeting. There was considerable uncertainty about Fed changes in guidance and when "liftoff" occurs. But for the day, traders believed the Fed is going to start tightening in guidance and hint at rate hikes.
Stocks jumped Thursday despite a dip in retail sales. Initial jobless claims were down sharply. Also, the dollar slipped and there was a rally in bank stocks. The dip in the dollar nudged down worries about the Fed boosting policy rates. Non-petroleum import priced declined notably.
While producer price inflation was nonexistent with a Friday release for February, the dollar was back up and stocks dropped, causing worries about corporate earnings. The consumer is benefiting from a stronger dollar but corporations are not on average. Corporations with high overseas exposure are being hit the hardest as a stronger dollar hurts repatriated profits.
Equities were mostly down this past week. The Dow was down 0.6 percent; the S&P 500, down 0.9 percent; the Nasdaq, down 1.1 percent; the Russell 2000, up 1.2 percent; and the Wilshire 5000, down 0.6 percent.
For the year-to-date, major indexes are mixed as follows: the Dow, down 0.4 percent; the S&P 500, down 0.3 percent; the Nasdaq, up 2.9 percent; the Russell 2000, up 2.3 percent; and the Wilshire 5000, up 0.4 percent.
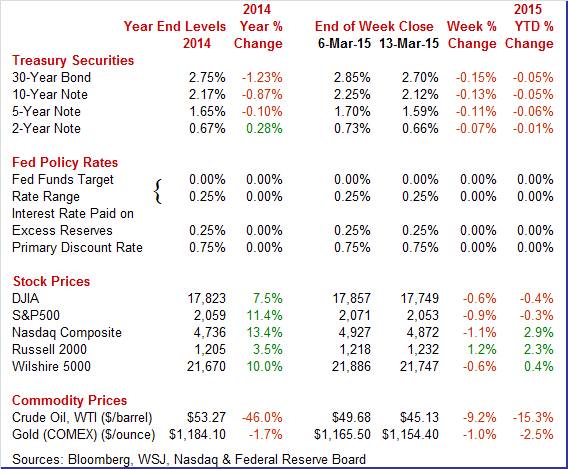
Weekly percent change column reflects percent changes for all components except interest rates. Interest rate changes are reflected in simple differences.
 Treasury yields fell this past week. Most of the daily movement was on Monday and Tuesday. Treasury yields fell this past week. Most of the daily movement was on Monday and Tuesday.
Rates dipped Monday as the European Central Bank cranked up is quantitative easing program. The ECB confirmed Monday that purchases had begun, with national central banks buying up their own governments' debt. Central banks bought debt including German, French, Italian, and Belgian bonds, according to traders.
ECB quantitative easing continued to weigh on yields Tuesday. Yields in many Eurozone countries fell to record lows with impact spreading elsewhere, including the U.S. Rates were little changed in the U.S. the rest of the week.
For this past week Treasury rates were down as follows: the 2-year note, down 7 basis points; the 5-year note, down 11 basis points; the 7-year note, down 13 basis points; the 10-year note, down 13 basis points; and the 30-year bond, down 15 basis points. The month T-bill nudged up 1 basis point.
 Oil prices continued to decline this past week. The notable daily swings were on Tuesday, Thursday, and Friday. Oil prices continued to decline this past week. The notable daily swings were on Tuesday, Thursday, and Friday.
Spot West Texas Intermediate declined somewhat over a dollar a barrel Tuesday on expectations of a rise in production of oil supplies in the U.S., largely from fracturing shale. On Thursday, WTI fell about $1-1/2 dollars per barrel to a six-week low due to a rise in the dollar and on Wednesday news of stronger-than-expected inventory build. At week's end, crude decreased just under $2 per barrel after the release of a report from the International Energy Agency that a glut of crude supplies may cause prices to dip further.
Net for the week, the spot price for West Texas Intermediate dropped $4.55 per barrel to settle at $45.13.
The latest economic news this past week was largely soft—notably with weakness in retail sales, producer prices, and import prices. Also, a higher dollar is adding to low inflation pressures.
 Retail sales dropped in February but gasoline prices are not to blame—rather auto sales. Also, adverse weather likely played a role in cutting core sales. Retail sales dropped in February but gasoline prices are not to blame—rather auto sales. Also, adverse weather likely played a role in cutting core sales.
Retail sales in February declined 0.6 percent after decreasing 0.8 percent in January. The market consensus for February was for 0.3 percent gain. As expected from unit new auto sales data, auto sales dropped 2.5 percent, following a 0.5 percent rise in January.
 Excluding autos, sales decreased 0.1 percent, following a 1.1 percent drop in January. Gasoline sales actually partially rebounded 1.5 percent in February after dropping 9.8 percent the month before. Excluding both autos and gasoline sales fell 0.2 percent after slipping 0.1 percent in January. Excluding autos, sales decreased 0.1 percent, following a 1.1 percent drop in January. Gasoline sales actually partially rebounded 1.5 percent in February after dropping 9.8 percent the month before. Excluding both autos and gasoline sales fell 0.2 percent after slipping 0.1 percent in January.
Some components may have been weak due to winter weather and a stay at home attitude. Severe weather on the east coast made it difficult for shoppers to travel. Declines were seen in furniture & home furnishings, electronics, building materials & garden equipment, health & personal care, general merchandise, miscellaneous, and food services & drinking places.
Gains were seen in food & beverage, sporting goods & etc. and nonstore retailers (largely Internet sales).
The latest consumer sector numbers are curious. Confidence is still moderately high, discretionary income is moderately high, but spending is sluggish. The latest numbers will nudge down estimates for first quarter GDP growth.
 Despite slippage in sentiment, the consumer remains notably optimistic. Despite slippage in sentiment, the consumer remains notably optimistic.
There appears to have been a bubble in consumer spirits late into last year and early into this one—that is a brief surge that came and went and never materialized into a rise for consumer spending. The first read on consumer sentiment this month fell very sharply to 91.2, down 4.2 points from the final reading for February for the lowest reading since November. Sentiment peaked at 98.2 in mid-month January which was the highest reading in 8 years.
 The two components of the headline index both show weakness, at 103.0 for a 3.9 point decline for current conditions and at 83.7 for a 4.3 point decline for expectations. The decline in current conditions points to weakness for consumer spending this month relative to February while the decline in expectations points to a falling off in confidence for the jobs outlook. The two components of the headline index both show weakness, at 103.0 for a 3.9 point decline for current conditions and at 83.7 for a 4.3 point decline for expectations. The decline in current conditions points to weakness for consumer spending this month relative to February while the decline in expectations points to a falling off in confidence for the jobs outlook.
Gasoline prices, though low, have been edging up in recent weeks and are now lifting inflation expectations which are up 2 tenths for the 1-year outlook to 3.0 percent and up 1 tenth for the 5-year outlook to 2.8 percent.
Strength in the jobs market remains an extremely key, but still isolated, positive for the economy, strength that has yet to trigger significant consumer strength.
 There were 4.998 million job openings on the last business day of January, little changed from 4.877 million in December, the U.S. Bureau of Labor Statistics reported on March 10. Hires decreased to 4.996 million in January from 5.239 million the prior month. There were 4.998 million job openings on the last business day of January, little changed from 4.877 million in December, the U.S. Bureau of Labor Statistics reported on March 10. Hires decreased to 4.996 million in January from 5.239 million the prior month.
Separations were little changed at 4.821 million versus 4.901 million in December. Within separations, the quits rate was little changed at 2.0 percent and the layoffs and discharges rate was unchanged at 1.2 percent.
 The number of job openings was the highest level since January 2001. The job openings rate for January was 3.4 percent. The number of job openings was the highest level since January 2001. The job openings rate for January was 3.4 percent.
Effective with this release, revisions to data from January 2010 forward incorporate annual updates to the Current Employment Statistics employment estimates and the Job Openings and Labor Turnover Survey seasonal adjustment factors.
There were 2.799 million quits in January, little changed from December's 2.715 million. The quits rate in January was 2.0 percent. The number of quits was little changed for total private and unchanged for government over the month. Quits increased in January in professional and business services and in health care and social assistance.
 The Fed may not be as excited about the latest payroll jobs number after taking into account some 20 total labor market indicators. The Fed may not be as excited about the latest payroll jobs number after taking into account some 20 total labor market indicators.
The Fed's Labor Market Conditions Index remained positive in February but decelerated to 4 in February from 4.8 in January. This was despite stronger-than expected payroll gains this past Friday. One area of weakness likely was soft wage growth. The Fed's Research Department does not give details on this unofficial report. While the employment situation's payroll numbers have some analysts suggesting a June rate hike by the Fed, the latest LMCI indicates that there may be considerable debate within the Fed on "liftoff" timing-especially since inflation is very sluggish.
 The latest inflation report ahead of the Fed's March FOMC meeting points to inflation far below the Fed's inflation goal. The latest inflation report ahead of the Fed's March FOMC meeting points to inflation far below the Fed's inflation goal.
The PPI for total final demand fell 0.5 percent in February after decreasing 0.8 percent in January. Expectations were for a 0.3 percent rebound. Energy was flat, following a 10.3 percent drop while foods decreased 1.6 percent, following a 1.1 percent dip in January. Excluding food and energy, producer price inflation posted a minus monthly 0.5 percent after slipping 0.1 percent the month before. Total excluding food, energy and trade services were unchanged after dipping 0.3 percent in January.
 The index for final demand goods decreased 0.4 percent after falling 2.1 percent in January. Leading the decrease, margins for final demand trade services dropped 1.5 percent. (Trade indexes measure changes in margins received by wholesalers and retailers.) The index for final demand goods decreased 0.4 percent after falling 2.1 percent in January. Leading the decrease, margins for final demand trade services dropped 1.5 percent. (Trade indexes measure changes in margins received by wholesalers and retailers.)
The index for final demand services fell 0.5 percent after easing 0.2 percent the month before.
On a seasonally adjusted year-ago basis, PPI final demand was down 0.7 percent, compared to down 0.1 percent in January. Excluding food & energy, the PPI final demand was up 1.0 percent versus 1.7 percent the month before. Excluding food, energy, and trade services PPI inflation slowed to 0.7 percent on a year-ago basis, compared to 0.9 percent in January.
Inflation at the producer level remains essentially nonexistent. So far inflation numbers for February (including import prices) let the Fed stay loose on monetary policy.
 A stronger dollar and soft growth abroad are keeping import price inflation weak. A stronger dollar and soft growth abroad are keeping import price inflation weak.
First it was oil prices and now it's the strong dollar that is holding down import prices. Import prices did rise 0.4 percent in February but excluding petroleum imports, prices of which rebounded a sharp 8.1 percent, import prices fell a steep 0.4 percent following a 0.6 percent decline in January. Year-on-year, import prices excluding petroleum are in the negative column at minus 1.8 percent as are total prices which are down a very steep and very deflationary minus 9.4 percent.
 Export prices are also down, at minus 0.1 percent for a year-on-year decline of minus 5.9 percent. Agricultural prices are the major component on the export side, down 2.0 percent and excluding which prices edged 0.2 percent higher. Year-on-year, non-agricultural export prices are at minus 5.5 percent. Export prices are also down, at minus 0.1 percent for a year-on-year decline of minus 5.9 percent. Agricultural prices are the major component on the export side, down 2.0 percent and excluding which prices edged 0.2 percent higher. Year-on-year, non-agricultural export prices are at minus 5.5 percent.
A look at finished goods shows a sweep on minus signs on both the import and export sides including a minus 1.0 percent reading for year-on-year imported capital goods and a minus 1.4 percent year-on-year reading for exported consumer goods.
The outlook for import prices, despite what may be stability in oil prices, is not favorable given the enormous ongoing strength in the dollar, strength mainly related to the divergence between European monetary policy, which is increasingly expansionary, and the outlook for U.S. policy which is expected to be increasingly less expansionary.
There is softening in the economy—notably in the consumer sector and on the inflation front. The Fed at this week's policy meeting likely will be debating the tradeoffs between retail sales, producer prices, import prices, the dollar and improved labor market numbers for payrolls, unemployment, and jobless claims.
This week focuses on the Fed's FOMC meeting, manufacturing, and housing. Regarding the Fed, will "patient" be removed from guidance and will there be any hints on when the first rate hike occurs—June, July, September or later. Manufacturing and housing have been oscillating in recent months with barely positive average numbers. The key reports are industrial production and housing starts. Quadruple witching takes place Friday but market moves are likely to start Thursday in preparation.
The Empire State manufacturing index reported moderate though slowing growth for February though details show a tangible falloff in confidence for the outlook. February's general conditions index came in at 7.78, only slightly lower than January's 9.95 and right in line with the average over the last 5 months of 7.08. Shipments were at a solid 14.12, up from January's 9.59 and the strongest reading since September. But growth in new orders was nearly dead flat, down almost 5 points to 1.22 for the second lowest reading of the last 10 months. And confidence has suddenly slipped with the outlook down more than 20 points to 25.58 for the lowest level in two years.
Empire State Manufacturing Survey Consensus Forecast for March 15: 7.00
Range: 0.00 to 10.00
Industrial production turned modestly positive in January—including for the manufacturing component. But downward revisions stood out. Industrial production for January rebounded 0.2 percent after a December decrease of 0.3 percent. But January data fell below expectations were for a 0.4 percent boost. Manufacturing rose 0.2 percent in January after no change the month before. But the negative is that December manufacturing was revised down from a 0.3 percent gain. The manufacturing increase fell short of the 0.4 percent market forecast. Mining dropped 1.0 percent in January after a 2.1 percent jump the prior month. Utilities made a partial rebound of 2.3 percent after plunging 6.9 percent in December. Overall capacity utilization was unchanged at 79.4 percent and is not putting upward pressure on prices—a plus for continued loose Fed policy.
Industrial production Consensus Forecast for February 15: +0.3 percent
Range: -0.1 to +0.5 percent
Manufacturing production component Consensus Forecast for February 15: +0.1 percent
Range: -0.3 to +0.4 percent
Capacity utilization Consensus Forecast for February 15: 79.5 percent
Range: 79.1 to 79.7 percent
The NAHB housing market index posted in February at an index level of 55 versus 57 in January. The index has averaged 56 since first turning into the plus column in July last year. But a negative in the report was a further drop in the buyer traffic component, down 5 points to 39 for the lowest reading since July. Low traffic reflects lack of first-time buyers in the market, specifically young households. The expectations component, which tracks future sales, was unchanged at 60 with present sales down only 1 point to 61, both strong readings.
NAHB housing market index Consensus Forecast for March 15: 56
Range: 50 to 57
Housing starts slipped in January on weakness in single-family starts. Housing starts declined 2.0 percent in January after a 7.1 percent jump the month before. The 1.065 million unit pace was up 18.7 percent on a year-ago basis. Single-family starts dropped 6.7 percent after a 7.9 percent boost in December. Multifamily starts gained 7.5 percent, following a 5.6 percent rise in December. Again, permits suggest that housing activity is muted. Housing permits dipped 0.7 percent, following no change in December. The 1.053 million unit pace was up 8.1 percent on a year-ago basis.
Housing starts Consensus Forecast for February 15: 1.048 million-unit rate
Range: 0.987 million to 1.070 million-unit rate
Housing permits Consensus Forecast for February 15: 1.058 million-unit rate
Range: 0.995 million to 1.152 million-unit rate
FOMC meeting begins
The FOMC announcement at 2:00 p.m. ET for the March 17-18 FOMC policy meeting is expected to leave policy rate unchanged. Also, the Fed will release its quarterly forecasts at the same time as the statement. The key issues are whether "patient" is removed from guidance and whether there are hints at when the Fed starts to raise rates.
FOMC Consensus Forecast for 3/18/15 policy vote on fed funds target range: unchanged at a range of zero to 0.25 percent
Chair press conference after the FOMC meeting statement is scheduled for 2:30 p.m. ET. Fed Chair Janet Yellen conducts a press conference after FOMC meetings in which participants present their quarterly economic forecasts. Yellen is expected to comment on the forecast and take Q&A.
Initial jobless claims fell a very steep 36,000 in the March 7 week to 289,000, driving down the 4-week average by 3,750 to a 302,250 level that, however, is more than 10,000 above the month-ago comparison. The month-on-month comparison does not point to improvement for the March employment report. Continuing claims, which are reported with a 1-week lag, are mixed, down 5,000 in data for the February 28 week to 2.418 million but with the 4-week average up 13,000 to 2.417 million. The month-on-month comparison for the average is up 20,000, again not pointing to improvement for the labor market. The unemployment rate for insured workers is unchanged at a recovery low of 1.8 percent.
Jobless Claims Consensus Forecast for 3/14/14: 293,000
Range: 275,000 to 305,000
The U.S. current account deficit widened by $1.9 billion to $100.3 billion in the third quarter from a slightly revised $98.4 billion in the second quarter. As a percentage of GDP, the gap held unchanged at 2.3 percent. The gap on goods widened $7.2 billion to $182.1 billion while the surplus on services narrowed $0.3 billion to $57.7 billion. The surplus on primary income widened $4.2 billion to $59.0 billion which was more than offset by a $12.9 billion widening in the gap on secondary income to $34.9 billion, a widening that reflects fewer US government fines.
Current account Consensus Forecast for Q4 14: -$105.0 billion
Range: -$112.5 billion to -$100.0 billion
The Conference Board's index of leading indicators in January slowed to a not-so-strong plus 0.2 percent versus a slightly downward revised plus 0.4 percent in December. Once again the yield spread was the biggest positive for the index reflecting the Fed's near zero rate policy. But outside rate policy, gains were less than spectacular led by credit indications and also consumer expectations which however may be slipping this month based on the twice-monthly consumer sentiment report.
Leading indicators Consensus Forecast for February 15: +0.3 percent
Range: +0.1 to +0.5 percent
The general business conditions index of the Philadelphia Fed's Business Outlook Survey softened modestly in February to 5.2 versus January's 6.3. But optimism, like the Empire State report, is cooling with the Philly Fed's 6-month outlook falling to 29.7 vs December's 50.9. The new orders index was a positive, still on the plus side at 5.4 vs January's 8.5. And unfilled orders are a special positive, rising to 7.3 from January's contraction of minus 8.6.
Philadelphia Fed survey Consensus Forecast for March 15: 7.0
Range: 2.0 to 12.0
Quadruple Witching
R. Mark Rogers can be found on a weekly broadcast talking about the U.S. economy, the easiest way to find him is by going to iTunes and searching for "Simply Economics."
Econoday Senior Writer Mark Pender contributed to this article.
|
