|
There are signs that housing is marginally improving but manufacturing appears to be soft.
 Equities dropped sharply this past week. After little change Monday, stocks dipped Tuesday on another gain in the dollar, resurrecting worries about lower repatriated profits from U.S. multinational corporations. A stronger dollar cuts into the value of overseas funds brought back into the U.S. balance sheets. Equities dropped sharply this past week. After little change Monday, stocks dipped Tuesday on another gain in the dollar, resurrecting worries about lower repatriated profits from U.S. multinational corporations. A stronger dollar cuts into the value of overseas funds brought back into the U.S. balance sheets.
Equities fell sharply Wednesday as durables orders deeply disappointed, falling instead rising as expected and declining for the third time in four months. Thursday was little changed but down only marginally despite the plane crash in Europe and Saudi Arabia launching strikes on key military installations in Yemen.
The last day of trading posted modest gains on average on comments from Fed chair Janet Yellen that were taken as dovish.
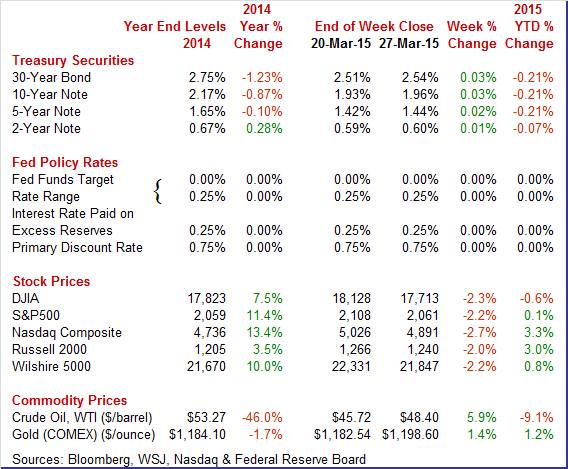
 Equities were down this past week. The Dow was down 2.3 percent; the S&P 500, down 2.2 percent; the Nasdaq, down 2.7 percent; the Russell 2000, down 2.0 percent; and the Wilshire 5000, down 2.2 percent. Equities were down this past week. The Dow was down 2.3 percent; the S&P 500, down 2.2 percent; the Nasdaq, down 2.7 percent; the Russell 2000, down 2.0 percent; and the Wilshire 5000, down 2.2 percent.
For the year-to-date, major indexes are mostly up as follows but with the Dow being an exception: the Dow, down 0.6 percent; the S&P 500, up 0.1 percent; the Nasdaq, up 3.3 percent; the Russell 2000, up 3.0 percent; and the Wilshire 5000, up 0.8 percent.
Weekly percent change column reflects percent changes for all components except interest rates. Interest rate changes are reflected in simple differences.
 Treasury yields rose modestly this past week. Treasury yields rose modestly this past week.
After little change Monday, rates eased slightly on Tuesday on a stronger dollar and slight flight to safety as funds marginally moved from equities to bonds. Yields rose moderately Wednesday despite a weak durables orders report. The five-year auction saw weak demand.
Rates gained moderately Thursday on worries about the Fed nudging up policy rates later this year and next. Yields increased more on the long end. The week ended with rates slipping after GDP growth for the fourth quarter coming in lower than expected.
For this past week Treasury rates were up as follows: 3-month T-bill, up 3 basis points; the 2-year note, up1 basis point; the 5-year note, up 2 basis points; the 7-year note, up 3 basis points; the 10-year note, up 3 basis points; and the 30-year bond, up 3 basis points.
Overall, bond traders are paying more attention to the Fed likely raising policy rates later this year—although at a very gradual pace.
 The spot price of West Texas Intermediate had some moderately notable daily swings this past week ending net up moderately. The spot price of West Texas Intermediate had some moderately notable daily swings this past week ending net up moderately.
Most daily swings were up with Friday being the exception. WTI rose Monday on a dip in the dollar. After a very marginal rise Tuesday, crude gained somewhat under $2 per barrel Wednesday again on a weaker dollar.
WTI rallied on Thursday as Saudi Arabian and allied airstrikes in Yemen continued to boost concerns over crude supplies in the Middle East.
Spot WTI declined $2 per barrel Friday on easing of tensions in the Middle East—including the view that the U.S. may positively conclude nuclear talks with Iran.
Net for the week, the spot price for West Texas Intermediate rose $2.68 per barrel to settle at $48.40.
Economic growth currently is softer but the Fed is expecting improvement in the second half of the year.
 The latest GDP report was slightly better than viewed by markets. The number was marginally below forecasts but the component mix improved. The latest GDP report was slightly better than viewed by markets. The number was marginally below forecasts but the component mix improved.
Fourth quarter GDP growth was unrevised overall. The economy grew 2.2 percent in the fourth quarter compared to the second estimate of 2.2 percent and the advance estimate of 2.6 percent. Expectations were for 2.4 percent
Final sales of domestic product were nudged up to 2.3 percent from the second estimate of 2.1 percent. Final sales to domestic purchasers were revised up to 3.3 percent from 3.2 percent.
The inventory contribution to growth was revised down from plus 0.12 percentage points to minus 0.10 percentage points. On the plus side, the biggest change was a less negative for net exports.
On the price front, the chain-weighted price index was unrevised at 0.1 percent annualized. Analysts projected 0.1 percent. The core chain index, excluding food and energy, was unrevised from the second estimate of 0.7 percent.
Overall, the GDP revision was marginally more favorable with final sales being nudged up. Growth, however, is still soft.
 With the housing and manufacturing sectors suspect, the economy is depending on the consumer sector. Fortunately, the latest data on the consumer mood are positive. With the housing and manufacturing sectors suspect, the economy is depending on the consumer sector. Fortunately, the latest data on the consumer mood are positive.
Consumer sentiment has been very bumpy so far this year, up sharply in January then back down in February and into the first half of March but now rebounding back up in late March. The final consumer sentiment index ends March at 93.0, up 1.8 points from mid-month March of 91.2 and implying a late March trend of roughly the 95 area. This is a very solid area and next only to January's 8-year-high of 98.1.
The index has two components, both showing gains in the last two weeks of the month. The current conditions component rose to a final 105.0 from the mid-month's 103.0 to imply a 107 area for the last two weeks. This compares with February's 106.0 to indicate the possibility of accelerating consumer activity. Strength here also underscores the current health of the jobs market.
 The expectations component also rose, up 1.6 points from mid-month to 85.3 which, for the last two weeks, implies the 87 area which compares steadily with 88.0 for final February. Expectations hinge on the outlook for jobs. The expectations component also rose, up 1.6 points from mid-month to 85.3 which, for the last two weeks, implies the 87 area which compares steadily with 88.0 for final February. Expectations hinge on the outlook for jobs.
For inflation expectations, the price of gas plays a key role and pump prices, though low, have been going up. One-year expectations are at 3.0 percent vs 3.0 percent at mid-month and 2.8 percent in February. Five-year expectations are at 2.8 percent vs the same reading at mid-month and up 1 tenth from February's 2.7 percent.
Readings on consumer spirits may now be bouncing back but it is important to remember that the spike higher early in the year never materialized into accelerated consumer spending but moderate continued spending.
 Existing home sales bounced 1.2 percent higher in February to a 4.88 million annual pace which is above January's 4.82 million but still isn't that strong. The year, in fact, opens with the two weakest months for existing home sales since April last year. The year-on-year rate, however, is showing strength, at plus 4.7 percent in February for the strongest reading since October 2013. Existing home sales bounced 1.2 percent higher in February to a 4.88 million annual pace which is above January's 4.82 million but still isn't that strong. The year, in fact, opens with the two weakest months for existing home sales since April last year. The year-on-year rate, however, is showing strength, at plus 4.7 percent in February for the strongest reading since October 2013.
The data are split between single-family homes and condos with the single-family component in front which is encouraging, up 1.4 percent to a 4.10 million pace and a year-on-year gain of 5.9 percent. The condo component was unchanged in February at 0.540 million for a year-on-year minus 3.6 percent.
The South is by far the largest region for total sales and rose 1.9 percent in February for a year-on-year plus 6.0 percent. The West and Midwest are the next largest regions with the Midwest unchanged in the month and up 4.9 percent year-on-year with the West up 1.9 percent in February for a year-on-year gain of 2.8 percent. February sales fell 6.5 percent in the Northeast, which lags in the distance in size. The year-on-year rate for the Northeast is plus 3.6 percent.
Supply is still limiting sales. Existing homes on the market are still on the scarce side, at 4.6 months of supply and unchanged from January. A year ago, the rate was 4.9 months. Prices firmed in the latest report, up 2.5 percent to a median $202,600 and a respectable 7.5 percent ahead of a year ago. Note, however, that price data in this report are subject to volatility. Still the year-on-year reading is the best since February last year.
The housing market is soft though there are some signs of life in this report including the month's gain for single-family sales.
 In a positive jolt out of the housing sector, new home sales picked up sharply in February to a 539,000 annual rate. Adding to the good news was a big upward revision to January, to 500,000 from 481,000. These are the first two 500,000 readings going all the way back to April and May of 2008. In a positive jolt out of the housing sector, new home sales picked up sharply in February to a 539,000 annual rate. Adding to the good news was a big upward revision to January, to 500,000 from 481,000. These are the first two 500,000 readings going all the way back to April and May of 2008.
The gain drew down what was already thin supply on the market, to 4.7 months at the current sales rate versus 5.1 and 5.3 months in the prior two reports. The current reading is the lowest since June 2013 and will undoubtedly encourage builders to expand construction. The lack of supply, however, did not lift prices where the median fell a sharp 4.8 percent in the month to $275,500. Sellers, in fact, seem to be giving price concessions with the year-on-year price up only 2.6 percent.
Looking at sales by region shows a big surge in the Northeast where, however, sales levels compared to other regions are very low. Sales in the Midwest, which is also a small region for new home sales, fell sharply in the month as they did in the West, a large region for sales that represents 23 percent of all sales. Sales, however, were very strong in the South, a region that makes up a whopping 59 percent of all sales and where sales are back to where they were in February 2008.
Due to seasonal adjustments, the winter months are always bumpy for housing data. But the latest report stands in contrast to what has been a dreary run of weak data out of the housing sector. And it does point to momentum going into the critical spring selling season. The Dow moved off opening lows following the report.
 House prices continued to rise in January but at a slower pace. FHFA house prices advanced 0.3 percent, following a gain of 0.7 percent in December. The year-ago rate came in at 5.1 percent, compared to 5.4 percent in December. House prices continued to rise in January but at a slower pace. FHFA house prices advanced 0.3 percent, following a gain of 0.7 percent in December. The year-ago rate came in at 5.1 percent, compared to 5.4 percent in December.
Regionally, six Census regions reported gains in January while three declined.
Home prices continue to be the positive facet of the housing sector. Adverse weather may be the reason for softening in price growth.
A strong dollar and sluggish growth overseas may be impacting U.S. manufacturing.
 The manufacturing sector continues to look weak. Durables orders fell 1.4 percent in February after rebounding 2.0 percent the month before. Market expectations were for a 0.7 percent gain. Excluding transportation, the core declined 0.4 percent, following a 0.7 percent drop in January. Analysts projected a 0.3 percent gain in February. The manufacturing sector continues to look weak. Durables orders fell 1.4 percent in February after rebounding 2.0 percent the month before. Market expectations were for a 0.7 percent gain. Excluding transportation, the core declined 0.4 percent, following a 0.7 percent drop in January. Analysts projected a 0.3 percent gain in February.
Transportation dropped 3.5 percent, following a monthly rebound of 8.8 percent the prior month.
Motor vehicles slipped 0.5 percent, nondefense aircraft decreased 8.9 percent, and defense aircraft fell 33.1percent.
Outside of the core, orders were mixed. Industries that advanced were primary metals and electrical equipment. Declines were seen in fabricated metals, machinery, computers & electronics, and "other."
Nondefense capital goods orders excluding aircraft were down 1.3 percent, following a 0.9 percent dip in January. Shipments of this series were flat in February after rising 1.0 percent the month before.
The latest orders numbers point to continuing weakness in the manufacturing sector and may soften Fed hawk rhetoric-especially taking into account the latest sluggish March manufacturing surveys.
According to Markit's survey manufacturing may improve in March—but there are issues with the data.
The manufacturing sector has gotten off to slow start this year but may have picked up slightly in March, based at least on the PMI flash which is at 55.3, a 5-month high and vs 55.1 in final February and 54.3 in mid-month February. New orders are also at a 5-month high as rising domestic sales offset declining export sales and weak sales out of the oil sector. Output is at a 6-month high and employment at a 4-month high. Input costs are down for a 3rd straight month and output prices are rising at their slowest pace in 3-1/2 years.
The decline in export sales is of special note in this report which cites concerns among respondents that the dollar's strength against the euro is hurting demand. Last week's FOMC statement pointed to weak exports as a major factor holding down growth. This report in general has been running noticeably hotter than hard data from the government which have been no better than flat, if that, and which would correspond to a roughly 50 level for the PMI.
The manufacturing sector may be sputtering but not the service sector, based on Markit's flash PMI which is up strongly for a second straight month, to a 6-month high of 58.6 in final March versus 57.1 in final February (57.0 February flash). The final reading for January was 54.2.
Respondents are citing improvement in economic conditions, strengthening consumer confidence, and new product launches as pluses. New orders are at a 6-month high and backlogs are at a 5-month high. Employment is also up.
A negative however, and one seen in other data, was a downgrade in expectations. Those seeing a rise in business over the next 12 months were the fewest since June 2012.
 CPI inflation rose for the month of February but the trend remains low. CPI inflation rose for the month of February but the trend remains low.
A comeback in energy put CPI inflation back into positive territory. Overall consumer price inflation rebounded 0.2 percent in February after falling a sharp 0.7 percent the month before. The February figure matched expectations. This was the first rise in the CPI since October. Energy gained 1.0 percent after plunging 9.7 percent in January. Gasoline prices rebounded 2.4 percent in February after plummeting 18.7 percent in January, Gasoline increased for the first time since June 2014. Food rose 0.2 percent after no change in in January.
 Excluding food and energy, consumer price inflation came in at 0.2 percent for both February and January. Analysts forecast a 0.1 percent gain. Excluding food and energy, consumer price inflation came in at 0.2 percent for both February and January. Analysts forecast a 0.1 percent gain.
On a seasonally adjusted basis, the headline CPI was down 0.1 percent in February on a year-ago basis compared to down 0.2 percent in January. Excluding food and energy, the year-ago rate was 1.7 percent versus 1.6 percent in January. In addition to shelter, the indexes for used cars and trucks, apparel, new vehicles, tobacco, and airline fares were among those that increased. The medical care index was unchanged, while the personal care index declined.
Overall, CPI inflation marginally firmed with energy starting to move out of what the Fed calls transition. Still, inflation is very low and points to no change in Fed policy in April.
Both manufacturing and housing remain sluggish despite some recently positive numbers. The consumer sector remains the support for the recovery. And inflation is below Fed target. The Fed likely is in no rush to accelerate policy rates but may very slowly nudge rates up as soon as June but also possibly later—keeping in mind "data dependency."
This week, it's about the consumer. The highlight is Friday's employment report for March. Payroll gains have been respectable but will the trend continue' However, wage growth has been soft—a Fed concern. Motor vehicle sales for March post and there could be a weather related rebound. At the start of the week, the personal income report for February is released. Weather likely is still a factor on spending. The market focus may be on PCE inflation due to Fed thinking on getting to goal inflation of 2 percent year-ago.
Personal income in January, personal income was moderately healthy as was spending after price effects are discounted. Personal income posted a gain of 0.3 percent matching the rate in December. The wages & salaries component jumped 0.6 percent, following a rise of 0.1 percent the prior month. However, wages & salaries likely were boosted by increases in minimum wages in some states—an infrequent phenomenon.
Personal spending decreased 0.2 percent, following a decline of 0.3 percent in December. Durables slipped 0.1 percent, following a 1.4 percent drop in December-due to sluggish auto sales. Nondurables plunged 2.2 percent in January after decreasing 1.4 percent the month before---with lower gasoline prices pulling this component down.
Prices at the headline level fell again, down 0.5 percent in January after a 0.2 percent dip the month before. The core PCE price index firmed to up 0.1 percent from flat in December. On a year-ago basis, headline inflation eased to 0.2 percent from 0.8 percent in December. The year-ago core rate was steady at 1.3 percent.
Personal income Consensus Forecast for February 15: +0.3 percent
Range: +0.2 to +0.4 percent
Personal consumption expenditures Consensus Forecast for February 15: +0.2 percent
Range: -0.3 to +0.6 percent
PCE price index Consensus Forecast for February 15: +0.2 percent
Range: +0.2 to +0.3 percent
Core PCE price index Consensus Forecast for February 15: +0.1 percent
Range: +0.1 to +0.2 percent
The pending home sales index rose 1.7 percent in January to 104.2, pointing to moderate strength ahead for final sales of existing homes. The regional breakdown showed gains in the two most closely watched regions, the South at 3.2 percent and the West at 2.2 percent. The Northeast was little changed at plus 0.1 percent while the Midwest fell slightly, down 0.7 percent.
Pending home sales Consensus Forecast for February 15: +0.3 percent
Range: -4.5 to +2.0 percent
The Dallas Fed general business activity index in its Texas manufacturing survey posted a second month of no growth in February. The production index, a key measure of state manufacturing conditions, remained near zero (0.7) and indicated output was essentially unchanged from January levels.
Other measures of current manufacturing activity reflected contraction in February. The new orders index pushed further into negative territory, coming in at minus 12.2, its lowest reading since June 2009. The shipments index fell to minus 3.3, also reaching a low not seen since 2009. The capacity utilization index turned negative as well, dropping from 5.1 to minus 4.9.
Perceptions of broader business conditions remained rather pessimistic this month. The general business activity index moved further negative to minus 11.2, posting its lowest reading in nearly two years. The company outlook index remained slightly negative and edged down from -3.8 to -4.4.
Dallas Fed general business activity index Consensus Forecast for March 15: -9.0
Range: -12.0 to -8.0
The S&P/Case-Shiller 20-city home price index (SA) in December showed a sharp month-on-month gain of 0.9 percent. This was the strongest monthly gain since March last year. Year-on-year growth, which had been slowing from the low double digits this time last year, is now leveling, at plus 4.5 percent vs November's 4.3 percent which is the first gain for this reading since way back in November 2013.
The S&P/Case-Shiller 20-city HPI (SA, m/m) Consensus Forecast for January 15: +0.7 percent
Range: +0.5 to +1.1 percent
The S&P/Case-Shiller 20-city HPI (NSA, m/m) Consensus Forecast for January 15: +0.1 percent
Range: 0.0 to +0.4 percent
The S&P/Case-Shiller 20-city HPI (NSA, y/y) Consensus Forecast for January 15: +4.6 percent
Range: +4.2 to +5.0 percent
The Chicago PMI for February plunged 13.6 points to a sub-50 level of 45.8, the lowest level since July 2009. The report attributes the plunge to bad weather and effects tied to the West Coast port slowdown. New orders, production and employment all posted double-digit declines. Supplier deliveries slowed which is often a sign of economic strength but in this case reflects delays tied, again, to the weather and port slowdown. This report, which covers both the manufacturing and non-manufacturing sectors, is often very volatile due to small sample size and the latest results, which again were contractionary, don't match up with other anecdotal indications for February that on net are pointing to moderate growth for the month.
Chicago PMI Consensus Forecast for March 15: 50.2
Range: 49.5 to 53.5
The Conference Board's consumer confidence index fell 7.4 points in February to 96.4 from a revised 103.8 in January which was a 7-1/2 year high. The dip was centered in the expectations component which fell a very steep 9.8 points to 87.2. The second main component, present situation, also dipped but less severely, down 2.7 points to 110.2.
Consumer confidence Consensus Forecast for March 15: 95.5
Range: 93.0 to 98.2
Sales of total light motor vehicles proved soft in February, down 2.6 percent to a 16.2 million annual rate. This was the lowest rate since April 2015 with a pace of 16.0 million units. Weakness in February was centered in North American made vehicles which fell 3.1 percent to a 13.1 million rate, also the lowest since April. Foreign made vehicles nudged down 0.2 percent to 3.1 million.
Motor vehicle domestic sales Consensus Forecast for March 15: 13.5 million-unit rate
Range: 13.2 to 13.7 million-unit rate
Motor vehicle total sales Consensus Forecast for March 15: 16.8 million-unit rate
Range: 16.3 to 17.1 million-unit rate
ADP private payroll employment in February rose 212,000. This compares with the BLS number for private payrolls with a gain of 288,000.
ADP private payrolls Consensus Forecast for March 15: 230,000
Range: 212,000 to 259,000
The Markit PMI manufacturing flash index may have picked up slightly in March, based at least on the PMI flash which is at 55.3, a 5-month high and versus 55.1 in final February and 54.3 in mid-month February. New orders were also at a 5-month high as rising domestic sales offset declining export sales and weak sales out of the oil sector.
Markit PMI manufacturing index (final) Consensus Forecast for March 15: 55.3
Range: 54.1 to 55.6
The composite index from the ISM manufacturing survey in February slowed, slipping 6 tenths to 52.9. This was the slowest rate of growth since January last year when the polar vortex was putting a freeze on activity. New orders slowed 4 tenths to 52.5 which is the slowest rate of growth since May 2013 while production slowed 2.8 points to 53.7 which is the slowest rate of growth since February last year.
ISM manufacturing composite index Consensus Forecast for March 15: 52.5
Range: 50.9 to 54.1
Construction spending declined 1.1 percent in January after gaining 0.8 percent the month before. January's decrease was led by public outlays which dropped 2.6 percent after rebounding with a 1.7 percent jump in December. Private nonresidential construction spending declined 1.6 percent in January, following a 0.1 percent rise in December. Private residential spending rose 0.6 percent after increasing 0.7 percent in December. On a year-ago basis, total outlays were up 1.8 percent in January compared to 2.2 percent in December.
Construction spending Consensus Forecast for February 15: +0.2 percent
Range: -0.8 to +1.0 percent
The U.S. international trade gap for January narrowed on lower oil prices. In January, the U.S. trade gap shrank to $41.8 billion from a revised $45.6 billion in December. Exports fell 2.9 percent after slipping 0.9 percent the month before. Imports dropped 3.9 percent, following a rebound of 1.8 percent in December. The narrowing in the overall gap was led by the petroleum gap which came in at $10.7 billion from $14.6 billion in December. The goods excluding petroleum gap narrowed slightly to $53.6 billion from $54.0 billion in December. The services surplus improved to $19.9 billion in January from $19.4 billion the previous month.
International trade balance Consensus Forecast for February 15: -$41.5 billion
Range: -$46.0 billion to -$39.5 billion
Initial jobless claims fell sharply in the March 21 week but the latest report isn't likely to raise expectations for the March employment report. Initial claims fell 9,000 in the week to 282,000, in turn driving down the 4-week average by a sizable 7,750 to a 297,000 level that, however, is still slightly higher than the month-ago comparison. Note that the sampling for the monthly March employment report was done in the prior week, the March 14 week, and sample-week to sample-week readings in that report between March and February were not favorable.
Jobless Claims Consensus Forecast for 3/28/14: 285,000
Range: 275,000 to 295,000
Factory orders fell for a 6th straight month in January. The decline was centered in non-durables which, in price effects tied to energy, fell 3.1 percent in the month, offsetting an unrevised 2.8 percent gain for durables (initial durables data released last week). The rise in durables reflected a swing higher in the always volatile transportation component which, reflecting a big gain for commercial aircraft, jumped 9.7 percent.
Factory orders Consensus Forecast for February 15: 0.0 percent
Range: -1.3 to +1.0 percent
Good Friday. Markets Closed. Banks Open.
Nonfarm payroll employment increased 295,000 in February after healthy gains of 239,000 in January and 329,000 in December. The unemployment rate dipped to 5.5 percent from 5.7 percent in January. The labor force participation rate edged down marginally to 62.8 percent from 62.9 percent in December. The "U-6" underemployment rate was unchanged at 11.3 percent. Turning back to the establishment survey, private payrolls increased 288,000 in February after a 237,000 gain the month before. The median forecast was for 225,000. Average hourly earnings rose 0.1 percent, compared to 0.5 percent in January. Expectations were for a 0.2 percent gain. The average workweek held steady at 34.6 hours, equaling expectations.
Nonfarm payrolls Consensus Forecast for March 15: 247,000
Range: 200,000 to 271,000
Private payrolls Consensus Forecast for March 15: 240,000
Range: 207,000 to 260,000
Unemployment rate Consensus Forecast for March 15: 5.5 percent
Range: 5.4 to 5.6 percent
Average workweek Consensus Forecast for March 15: 34.6 hours
Range: 34.6 to 34.6 hours
Average hourly earnings Consensus Forecast for March 15: +0.2 percent
Range: +0.2 to +0.3 percent
R. Mark Rogers can be found on a weekly broadcast talking about the U.S. economy, the easiest way to find him is by going to iTunes and searching for "Simply Economics."
Econoday Senior Writer Mark Pender contributed to this article.
|
