|
The economy currently is soft based on the latest employment report, manufacturing surveys, and construction data.
 In an abbreviated trading week, equities ended up for most indexes. The biggest daily swing was up on Monday based on dovish comments from China's central-bank chief as well as a continued flurry of merger announcements. Equities dipped Tuesday on profit taking the last day of the quarter. Stocks were little changed Wednesday and Thursday ahead of the Good Friday closing of markets. In an abbreviated trading week, equities ended up for most indexes. The biggest daily swing was up on Monday based on dovish comments from China's central-bank chief as well as a continued flurry of merger announcements. Equities dipped Tuesday on profit taking the last day of the quarter. Stocks were little changed Wednesday and Thursday ahead of the Good Friday closing of markets.
 Equities were mostly up this past week. The Dow was up 0.3 percent; the S&P 500, up 0.3 percent; the Nasdaq, down 0.1 percent; the Russell 2000, up 1.2 percent; and the Wilshire 5000, up 0.5 percent. Equities were mostly up this past week. The Dow was up 0.3 percent; the S&P 500, up 0.3 percent; the Nasdaq, down 0.1 percent; the Russell 2000, up 1.2 percent; and the Wilshire 5000, up 0.5 percent.
For the year-to-date, major indexes are mostly up as follows: the Dow, down 0.3 percent; the S&P 500, up 0.4 percent; the Nasdaq, up 3.2 percent; the Russell 2000, up 4.2 percent; and the Wilshire 5000, up 1.3 percent.
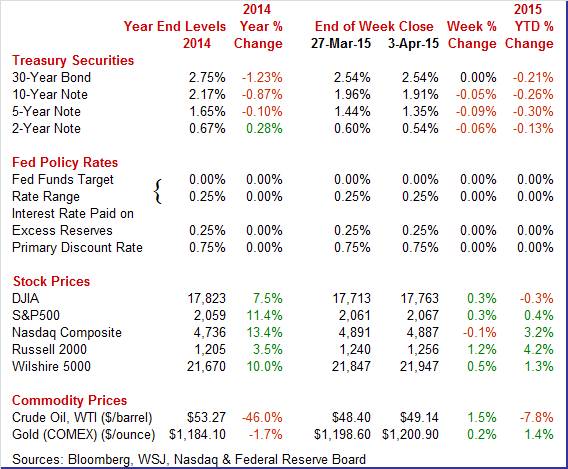
Weekly percent change column reflects percent changes for all components except interest rates. Interest rate changes are reflected in simple differences.
 Treasury yields ended the week down moderately. Rates eased Monday on news that the People's Bank of China may be easing monetary policy. Rates nudged down Tuesday with traders closing books for the quarter. Treasury yields ended the week down moderately. Rates eased Monday on news that the People's Bank of China may be easing monetary policy. Rates nudged down Tuesday with traders closing books for the quarter.
The biggest daily downswing was Wednesday on weak economic data—notably ISM manufacturing, ADP employment, and construction outlays. Rates firmed Thursday on a healthy jobless claims report.
For this past week Treasury rates were down as follows: 3-month T-bill, down 2 basis points; the 2-year note, down 6 basis points; the 5-year note, down 9 basis points; the 7-year note, down 7 basis points; and the 10-year note, down 5 basis points. The 30-year bond was unchanged.
 The spot price for West Texas Intermediate was little changed for the week. The only notable daily swing was Wednesday with a rise of about $1-3/4 per barrel on expectations of reduced supplies. The spot price for West Texas Intermediate was little changed for the week. The only notable daily swing was Wednesday with a rise of about $1-3/4 per barrel on expectations of reduced supplies.
Net for the week, the spot price for West Texas Intermediate edged up 74 cents per barrel to settle at $49.14.
The latest week's data show the economy slowing. The Fed doves will be pointing this out.
While the Fed is hoping for stronger economic growth in the second half, it currently is headed in the opposite direction.
 The labor market has softened in several aspects. Payroll jobs increased a mere 126,000 in March after increases of 264,000 in February and 201,000 in January. January and February were revised down a net 69,000. Market expectations for March were for a 247,000 increase. The labor market has softened in several aspects. Payroll jobs increased a mere 126,000 in March after increases of 264,000 in February and 201,000 in January. January and February were revised down a net 69,000. Market expectations for March were for a 247,000 increase.
The unemployment rate held steady at 5.5 percent and matched expectations. The labor force participation rate edged down marginally to 62.7 percent from 62.8 percent in February.
Turning back to the establishment survey, private payrolls increased 129,000 in March after a 264,000 boost the month before. Analysts forecast 240,000. In March, employment continued to trend up in professional and business services, health care, and retail trade, while employment in mining declined.
 Employment in other major industries, including construction, manufacturing, wholesale trade, transportation and warehousing, information, financial activities, and government, showed little change over the month. Employment in other major industries, including construction, manufacturing, wholesale trade, transportation and warehousing, information, financial activities, and government, showed little change over the month.
Average hourly earnings rose 0.3 percent, topping expectations for 0.2 percent. The average workweek slipped to 34.5 hours versus 34.6 in February and coming in below forecasts for 34.6 hours
The latest employment report clearly is soft and will add to arguments by Fed doves to delay rate hikes.
 The consumer sector still is the most positive sector in the economy. Income is up and spending is up even with weak gasoline prices. The consumer sector still is the most positive sector in the economy. Income is up and spending is up even with weak gasoline prices.
In February, personal income growth remained healthy but spending and inflation were soft. Personal income advanced 0.4 percent after posting an equal gain of 0.4 percent in January. February topped expectations for a 0.3 percent gain. The wages & salaries component increased 0.3 percent, but followed a robust 0.6 percent the prior month.
Personal spending made a partial rebound of 0.1 percent after declining 0.2 percent in January. Analysts forecast a 0.2 percent rise. Durables fell 1.0 percent, following a 0.4 percent rise in January. Nondurables made a 0.4 percent comeback after plunging 2.5 percent in January. Services advanced 0.2 percent after a 0.4 percent boost in January.
 Prices at the headline level rebounded a moderate 0.2 percent, following three declines including 0.4 percent for January. Market expectations were for 0.2 percent. The core PCE price index rose 0.1 percent, matching the pace in January and expectations. Prices at the headline level rebounded a moderate 0.2 percent, following three declines including 0.4 percent for January. Market expectations were for 0.2 percent. The core PCE price index rose 0.1 percent, matching the pace in January and expectations.
Income growth was moderately strong in February. But spending has been softening in recent months due to adverse weather and lower energy prices. But the consumer sector has fuel for spending. Inflation continues to be low and well below the Fed's target of 2 percent year-ago inflation, meaning the Fed likely will stick with no rate hike before mid-year.
 Another sign of a healthy consumer sector was a rebound in motor vehicle sales. Another sign of a healthy consumer sector was a rebound in motor vehicle sales.
After 3 months of declines, vehicle sales popped up strongly in March, up 6.2 percent to an annual rate of 17.2 million units. This is the strongest rate since November and points to a badly needed gain for the motor vehicle component of the monthly retail sales report which has declined in 2 of the last 3 reports and was down very sharply in February. The gain is evenly distributed between North American-made vehicles and foreign-made vehicles and between cars and light trucks. Today's data are the first hard sales data for the month of March and suggest that consumers, enjoying a strong jobs market, may finally be spending more.
 Although the economy is slowing, the consumer is feeling better about where the economy is headed. Although the economy is slowing, the consumer is feeling better about where the economy is headed.
Consumer jumped to 101.3 in March from an upwardly revised 98.8 in February. March's reading is close to January's 7-1/2 year high of 103.8.
March's gain is centered entirely in the expectations component which is up 6.0 points to 96.0. This is the best reading for this component since February 2011 and reflects expected gains in income and the jobs market.
A negative, however, is the present situation component which fell 3.0 points to 109.1. Weakness here reflects a slight rise in the jobs-hard-to-get reading, which is a marginally negative indication for Friday's March employment report, and also a rise in those describing current business conditions as bad. Still, those describing conditions as bad, at 19.4 percent, are well outnumbered by those describing conditions as good, at 26.7 percent.
Though the drop in the present situation component does point to weakness in consumer activity relative to February, readings in this report are mostly favorable, and decidedly favorable. The strength of the jobs market has yet to trigger a surge in consumer spending but it is giving a definitive boost to consumer spirits.
 Weak exports are pulling down ISM's manufacturing sample whose index fell 1.4 points to 51.5. This is below what was a soft consensus forecast of 52.5 and is the lowest reading since May 2013. Weak exports are pulling down ISM's manufacturing sample whose index fell 1.4 points to 51.5. This is below what was a soft consensus forecast of 52.5 and is the lowest reading since May 2013.
New orders fell 7 tenths to 51.8 for its lowest reading since April 2013. New export orders are in contraction for a 3rd straight month, down 1.0 point to 47.5 for their lowest reading since November 2012.
Turning to the latest Markit survey, rising production and rising orders gave a lift to Markit's manufacturing PMI, to a 5-month high of 55.7 for final March vs 55.3 at mid-month and 55.1 in final February. The strength in production, underpinned by a rise in backlog orders, is giving a lift to employment. On the negative side are export orders underscoring the FOMC's concerns over weak foreign demand and the negative effects of the strong dollar. Inflation readings are very low, at a nearly 6-year low for inputs and a 10-month low for finished goods.
The latest trade data offer big question marks. Lower oil prices are likely lowering consumer and business costs but declines in other imports may suggest concern about domestic demand.
 The U.S. trade balance for February sharply narrowed on lower oil prices but also elsewhere. Businesses may be seeing softer demand and/or a stronger dollar is cutting into import prices. The U.S. trade balance for February sharply narrowed on lower oil prices but also elsewhere. Businesses may be seeing softer demand and/or a stronger dollar is cutting into import prices.
In February, the U.S. trade gap shrank to $35.4 billion from a revised $42.7 billion in January. Market expectations were for the deficit to come in at $41.5 billion. Exports fell 1.6 percent after decreasing 3.0 percent the month before. Imports dropped 4.4 percent, following a decrease of 3.6 percent in January.
 The narrowing in the overall gap was led by the goods excluding petroleum balance which posted at minus $46.0 billion versus minus $50.8 billion in January. The petroleum balance narrowed to minus $8.1 billion from minus $10.7 billion. The services surplus edged down to $19.7 billion from $19.9 billion. The narrowing in the overall gap was led by the goods excluding petroleum balance which posted at minus $46.0 billion versus minus $50.8 billion in January. The petroleum balance narrowed to minus $8.1 billion from minus $10.7 billion. The services surplus edged down to $19.7 billion from $19.9 billion.
The February trade deficit number likely will lead to upward revisions to first quarter GDP estimates. However, the import weakness raises questions about business views of consumer demand in coming months.
 Housing "may" be picking up—according to pending home sales. Housing "may" be picking up—according to pending home sales.
Pending home sales picked up steam in February, up a much stronger-than-expected 3.1 percent on top of a 1.2 percent revised gain in January. This is the first back-to-back gain since April and May last year. Today's report is a second shot in the arm for the ever-lagging housing sector, following last week's big surge in new homes sales.
By region, the Midwest shows a strong February gain for pending sales as does the West, a region where sales of existing homes have been flat. The South, by far the largest housing region, and the Northeast, by far the smallest, show small monthly declines.
Year-on-year, pending home sales, which are defined as contract signings for existing homes, are up a robust-looking 12.0 percent which is a 6th straight increase. But this is misleading as many deals fall through. Final sales of existing homes, in data posted last week, are up only 4.7 percent year-on-year.
An important positive in today's report is an uptick, the first since November 2014, in first-time buyers, to 29 percent from 28 percent. Lack of first-time buyers, specifically young households preferring to rent, has been hurting the housing market.
 While home sales have been sluggish, low inventories have been boosting prices. While home sales have been sluggish, low inventories have been boosting prices.
Home prices are firming as the Case-Shiller composite-20 index rose 0.9 percent in January following a 0.9 percent gain in December and a 0.8 percent rise in November. This is the strongest streak for this report since late 2013. Year-on-year, however, prices are still on the soft side, up only 4.6 in January and only fractionally higher than the prior two months.
All regions show gains in January led once again by cities on the West Coast but also including strong gains in Chicago, Boston, Minneapolis, and Charlotte. Year-on-year, price strength is led by Denver at plus 8.4 percent followed by Miami at 8.3 percent and Dallas at 8.0 percent. At the bottom are Cleveland and Washington DC though both are still in the plus column, at a year-on-year 1.5 and 1.3 percent respectively.
Home prices are getting a boost from low inventory of available homes on the market and are a plus for homeowner confidence and consumer spending. Though seasonal adjustments play an outsized role in winter housing data, this report nevertheless extends a sudden run of favorable readings out of the housing sector which appears to be gaining momentum going into the spring selling season.
 The construction sector currently is unexpectedly soft. The construction sector currently is unexpectedly soft.
Construction spending unexpectedly dipped 0.1 percent in February after falling 1.7 percent in January. Market expectations were for a 0.2 percent increase.
February's decrease was led by public outlays which dropped 0.8 percent. Private nonresidential construction spending rebounded 0.5 percent. Private residential spending slipped 0.2 percent.
On a year-ago basis, total outlays were up 2.1 percent in February compared to 1.4 percent in January.
Adverse weather may be still affecting construction data. There is a chance of a normal weather rebound with warmer spring weather. But until later numbers come in, GDP growth estimates are likely being bumped down. Still, rebound data could send estimates up.
The consumer sector still leads the economy. However, the latest employment report casts doubt on that.
After last week's disappointing employment report, second tier labor market data come into play. The Fed's labor market conditions index has been soft and likely will be on Monday. But bad news could be good news for equities. Job openings in the JOLTS report have been growing but modestly. The outcome of this report will be followed by the Fed.
The Markit PMI services index picked up noticeably in February, to a 4-month high of 57.1 vs 54.2 in January. The final reading for February is little changed from the flash estimate of 57.0. Both new business and output are at 4-month highs, reflecting what the report says are stronger customer demand and improving economic conditions.
Markit PMI services index (flash) Consensus Forecast for March 15: 58.4
Range: 57.5 to 58.6
The composite index from the ISM non-manufacturing survey for February was up 2 tenths to 56.9. Employment was a stand-out positive, jumping nearly 5 points to a 4-month high of 56.4. Not so strong were new orders where growth is down nearly 3 points to 56.7 for the lowest reading since March last year. Nevertheless, this is still a very healthy and sustainable rate of growth.
ISM non-manufacturing composite index Consensus Forecast for March 15: 56.7
Range: 46.5 to 58.5
The Fed's Labor Market Condition Index is released at 10:00 ET or somewhat thereafter. This index is not from an official release but from an internal report by the Federal Reserve Board of Governors' Research Department. It is tracked by many within the Fed.
The Fed's Labor Market Conditions Index remained positive in February but decelerated to 4 in February from 4.8 in January. This was despite stronger-than expected payroll gains this past Friday. One area of weakness likely was soft wage growth. The Fed's Research Department does not give details on this unofficial report. While the employment situation's payroll numbers have some analysts suggesting a June rate hike by the Fed, today's LMCI indicates that there may be considerable debate within the Fed on "liftoff" timing-especially since inflation is very sluggish.
No consensus numbers are available for this month's report
The Labor Department's Job Openings and Labor Turnover Survey showed that there were 4.998 million job openings on the last business day of January, little changed from 4.877 million in December, the U.S. Bureau of Labor Statistics reported today. Hires decreased to 4.996 million in January from 5.239 million the prior month. Separations were little changed at 4.821 million versus 4.901 million in December. Within separations, the quits rate was little changed at 2.0 percent and the layoffs and discharges rate was unchanged at 1.2 percent.
No consensus numbers are available for this month's report
Consumer credit outstanding rose $11.6 billion in January vs an upwardly revised gain of $17.9 billion in December. Consumers did go to their credit cards in December, when the revolving credit component rose $6.2 billion, but not in January as the component fell $1.1 billion. As always, the data were boosted by the non-revolving component which rose $12.7 billion reflecting strength in auto financing and the government's acquisition of student loans. Today's jobs report underscores the strength of the consumer who, boosted also by low gas prices, has less and less reason to turn to credit card debt to fund purchases.
Consumer credit Consensus Forecast for February 15: +$14.0 billion
Range: +$5.5 billion to +$16.0 billion
The Minutes of the March 17-18 FOMC meeting are scheduled for release at 2:00 p.m. ET.
Trader focus likely will be on labor market conditions and any hint to timing of rate increases.
Initial jobless claims fell very sharply in the March 28 week, down 20,000 to 268,000. Next to 267,000 in the January 24 week this year, this is the lowest reading since all the way back in April 2000. The big drop pulls the 4-week average down an unusually steep 14,750 to 285,000 which is the lowest reading since November last year. But there is a caveat in the latest report and that is seasonal adjustment tied to Easter which is a difficult holiday period to adjust for given its year-to-year calendar shifts.
Jobless Claims Consensus Forecast for 4/4/15: 285,000
Range: 275,000 to 325,000
Wholesale inventories for January were up a tame looking 0.3 percent against, however, a huge 3.1 percent plunge in wholesale sales. This was the largest drop in sales since May 2009. The mismatch drives the stock-to-sales ratio up very sharply, to 1.27 from 1.22. The 1.27 is the heaviest reading since July 2009 and the month-to-month increase is the sharpest since November 2008. Data on the factory sector, released last week with the factory orders report, also showed an unusual build in January with the shipments-to-inventory ratio rising to 1.36 from 1.34.
Wholesale inventories Consensus Forecast for February 15: +0.2 percent
Range: 0.0 to +0.6 percent
Import prices did rise 0.4 percent in February but excluding petroleum imports, prices of which rebounded a sharp 8.1 percent, import prices fell a steep 0.4 percent following a 0.6 percent decline in January. Year-on-year, import prices excluding petroleum are in the negative column at minus 1.8 percent as are total prices which are down a very steep and very deflationary minus 9.4 percent.
Export prices are also down, at minus 0.1 percent for a year-on-year decline of minus 5.9 percent. Agricultural prices are the major component on the export side, down 2.0 percent and excluding which prices edged 0.2 percent higher. Year-on-year, non-agricultural export prices are at minus 5.5 percent.
Import prices Consensus Forecast for March 15: -0.3 percent
Range: -1.1 to +0.5 percent
Export prices Consensus Forecast for March 15: -0.2 percent
Range: -0.8 to +0.3 percent
The U.S. Treasury monthly budget report showed for February a deficit of $192.3 billion, slightly below last February's deficit of $193.5 billion. But the year-to-date deficit, five months into the Treasury's fiscal year, is slightly above last year, by 2.7 percent at $386.5 billion. Year-to-date receipts, led by gains in corporate and individual taxes, which both reflect economic strength, are up a solid 7.1 percent. This, however, is offset by outlays which are the larger side of the ledger and which are up 6.0 percent. Here Medicare outlays are up 9.4 percent, reflecting Obamacare, while social security is up 4.5 percent. In an offset, defense spending is down 4.1 percent. All in all, the government's deficit is in line with last year and, though enormous, is not a major factor right now in the economic outlook.
Looking ahead, the month of March typically shows a moderate deficit for the month. Over the past 10 years, the average deficit for the month of March has been $108.8 billion and $117.4 billion over the past 5 years. The March 2014 deficit came in at $36.9 billion.
Treasury Statement Consensus Forecast for March 15: -$43.0 billion
Range: -$50 billion to -$43.0 billion
R. Mark Rogers can be found on a weekly broadcast talking about the U.S. economy, the easiest way to find him is by going to iTunes and searching for "Simply Economics."
Econoday Senior Writer Mark Pender contributed to this article.
|
