|
Equity markets advanced last week. Investors were relieved by a number of factors, including FOMC minutes that indicate there are wildly disparate views on when the Fed should begin normalizing monetary policy. Greece's on time payment to the International Monetary Fund is helping to ease concerns, at least temporarily, about the difficult situation there. All equity indexes followed here advanced last week. Gains ranged from 0.2 percent for the Taiex to a heady 7.9 percent for the Hang Seng.
A number of central banks met and announced their respective policies, none of which have changed.
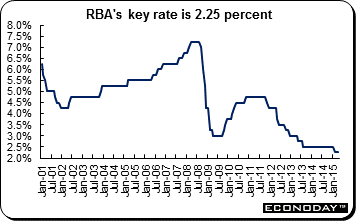 The Reserve Bank of Australia (RBA) left its key cash rate at 2.25 percent where it has been since February. Most analysts thought they would lower its rate by 25 basis points to 2.0 percent. However, in its statement, the RBA said that further easing ahead may be appropriate and it will assess the case for easing at upcoming meetings. It noted that a further decline in the Australian dollar (AUD) seemed likely given the drop in commodity prices. It also said that dwelling prices continue to increase strongly in Sydney. However, inflation is expected to remain within its target range of between 2 percent and 3 percent even with the lower AUD. The Reserve Bank of Australia (RBA) left its key cash rate at 2.25 percent where it has been since February. Most analysts thought they would lower its rate by 25 basis points to 2.0 percent. However, in its statement, the RBA said that further easing ahead may be appropriate and it will assess the case for easing at upcoming meetings. It noted that a further decline in the Australian dollar (AUD) seemed likely given the drop in commodity prices. It also said that dwelling prices continue to increase strongly in Sydney. However, inflation is expected to remain within its target range of between 2 percent and 3 percent even with the lower AUD.
The news ended weeks of fevered speculation about which way the RBA would jump with analysts and economists sharply divided. Australia continues to grapple with an economic slowdown as commodity prices fall and mining investment wanes.
In recent years the Reserve Bank of Australia's warnings about the level of the AUD exchange rate have become increasingly pointed. The characterization of the AUD as being at an "historically high" level was superseded last September when the RBA ramped up the rhetoric by describing the currency as remaining "above most estimates of its fundamental value." All that changed this past week with the Board dropping any reference to the exchange rate being overvalued and reverting to a comparatively tame observation that further depreciation would be likely given the ongoing declines in key commodity prices. This apparent change in the RBA's assessment of the exchange rate is arguably the biggest surprise to emerge from last week's monetary policy meeting.
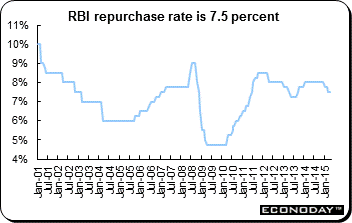 The Reserve Bank of India (RBI) left key interest rates unchanged at Tuesday's policy setting meeting. The benchmark repo rate, which was surprisingly cut 25 basis points at the start of March, remains at 7.5 percent and the reverse repo stays at 6.5 percent. The RBI also opted to keep the cash reserve ratio (CRR) steady at 4.0 percent. The decision was in line with the majority market view although there was a significant minority looking for another 25 basis point ease. The Reserve Bank of India (RBI) left key interest rates unchanged at Tuesday's policy setting meeting. The benchmark repo rate, which was surprisingly cut 25 basis points at the start of March, remains at 7.5 percent and the reverse repo stays at 6.5 percent. The RBI also opted to keep the cash reserve ratio (CRR) steady at 4.0 percent. The decision was in line with the majority market view although there was a significant minority looking for another 25 basis point ease.
Maintaining the status quo reflected domestic inflation developments that have largely followed the official forecast and a broadly neutral assessment of economic risks going forward. It was also attributable to the failure of the two interest rate cuts already delivered in 2015 to be transmitted into banks' lending rates. To this end, additional monetary easing will be contingent upon both a decline in private sector borrowing costs as well as upcoming economic data.
The overall tone of the central bank statement suggested that it has no real bias to policy at the moment. However, with input cost inflation having fallen sharply in recent months and rural wage growth now well short of the double digits rates seen over much of 2013, there is still a good likelihood that official interest rates will be lowered again over coming quarters.
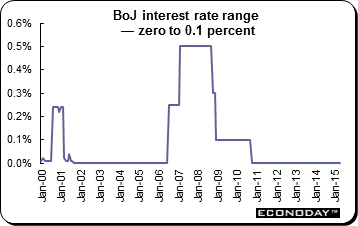 As expected, the Bank of Japan left its key interest rate range at zero to 0.1 percent. It said it would continue to buy JGBs at the annual pace of ¥80 trillion. The vote to maintain its policy was 8 to 1 with Takahide Kiuchi voting against the decision once again, arguing that an earlier pace of purchases (¥60 trillion) is appropriate. As expected, the Bank of Japan left its key interest rate range at zero to 0.1 percent. It said it would continue to buy JGBs at the annual pace of ¥80 trillion. The vote to maintain its policy was 8 to 1 with Takahide Kiuchi voting against the decision once again, arguing that an earlier pace of purchases (¥60 trillion) is appropriate.
According to the BoJ, the economy has continued its moderate recovery trend. Exports have continued to pick up while business fixed investment has been on a moderate increasing trend as corporate profits have improved. Corporate sentiment generally has stayed at a favorable level. Private consumption as a whole has remained resilient against the background of steady improvement in the employment and income situation, although recovery has been sluggish.
However inflation expectations flattened. The BoJ said that annual CPI growth is likely to be about zero for now due in part to falling energy prices. Japan's inflation target is in focus as the country tries to end two decades of deflation that has contributed to the moribund economy. Despite its easy policy, it appears that the BoJ is no closer to hitting its 2 percent inflation target in about two years, part of its promise to pull the Japanese economy out of decades of deflation and spiritless performance. Nevertheless, at his post meeting press conference, BoJ Governor Haruhiko Kuroda said that the "broad trend in prices is steadily improving. There's no change to our stance of aiming to achieve 2 percent inflation at the earliest date possible, with a time frame of two years in mind."
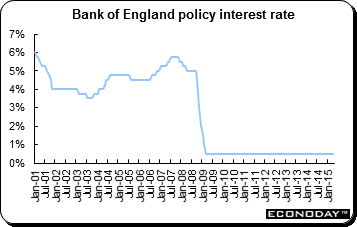 The April Bank of England monetary policy committee meeting produced the expected vote for no change. The Bank Rate stayed at 0.5 percent and the asset purchase ceiling at £75 billion. The April Bank of England monetary policy committee meeting produced the expected vote for no change. The Bank Rate stayed at 0.5 percent and the asset purchase ceiling at £75 billion.
There is clearly disagreement on the MPC over the speed with which inflation (zero in February) is likely to move back to its 2 percent medium term target. But for now the doves remain in the ascendancy. If anything, the real economy looks to have exceeded expectations last quarter and growth could well beat the 0.5 percent quarterly rate registered in October to December. However, with inflation likely to go negative near-term, wage growth accelerating only slowly from historically very weak levels and, as the latest trade data made clear, the pound sterling uncomfortably strong, pressure for any early move is still minimal. There is also the matter of a general election just a few weeks away.
|
|
2014 |
2015 |
% Change |
|
Index |
Dec 31 |
Apr 3 |
Apr 10 |
Week |
2015 |
| Asia/Pacific |
|
|
|
|
|
|
| Australia |
All Ordinaries |
5388.6 |
5869.7 |
5935.4 |
1.1% |
10.1% |
| Japan |
Nikkei 225 |
17450.8 |
19435.1 |
19907.6 |
2.4% |
14.1% |
| Hong Kong |
Hang Seng |
23605.0 |
25275.6 |
27272.4 |
7.9% |
15.5% |
| S. Korea |
Kospi |
1915.6 |
2045.4 |
2087.8 |
2.1% |
9.0% |
| Singapore |
STI |
3365.2 |
3453.8 |
3472.4 |
0.5% |
3.2% |
| China |
Shanghai Composite |
3234.7 |
3863.9 |
4034.3 |
4.4% |
24.7% |
|
|
|
|
|
|
|
| India |
Sensex 30 |
27499.4 |
28260.1 |
28879.4 |
2.2% |
5.0% |
| Indonesia |
Jakarta Composite |
5227.0 |
5456.4 |
5491.3 |
0.6% |
5.1% |
| Malaysia |
KLCI |
1761.3 |
1834.5 |
1844.3 |
0.5% |
4.7% |
| Philippines |
PSEi |
7230.6 |
7993.1 |
8127.48 |
1.7% |
12.4% |
| Taiwan |
Taiex |
9307.3 |
9600.3 |
9617.7 |
0.2% |
3.3% |
| Thailand |
SET |
1497.7 |
1536.1 |
1547.8 |
0.8% |
3.3% |
|
|
|
|
|
|
|
| Europe |
|
|
|
|
|
|
| UK |
FTSE 100 |
6566.1 |
6833.5 |
7089.8 |
3.8% |
8.0% |
| France |
CAC |
4272.8 |
5074.1 |
5240.5 |
3.3% |
22.6% |
| Germany |
XETRA DAX |
9805.6 |
11967.4 |
12374.7 |
3.4% |
26.2% |
| Italy |
FTSE MIB |
19012.0 |
23308.5 |
23877.3 |
2.4% |
25.6% |
| Spain |
IBEX 35 |
10279.5 |
11634.0 |
11749.3 |
1.0% |
14.3% |
| Sweden |
OMX Stockholm 30 |
1464.6 |
1675.5 |
1700.0 |
1.5% |
16.1% |
| Switzerland |
SMI |
8983.4 |
9130.6 |
9471.5 |
3.7% |
5.4% |
|
|
|
|
|
|
|
| North America |
|
|
|
|
|
|
| United States |
Dow |
17823.1 |
17763.2 |
18057.7 |
1.7% |
1.3% |
|
NASDAQ |
4736.1 |
4886.9 |
4996.0 |
2.2% |
5.5% |
|
S&P 500 |
2058.9 |
2067.0 |
2102.1 |
1.7% |
2.1% |
| Canada |
S&P/TSX Comp. |
14632.4 |
15026.6 |
15388.4 |
2.4% |
5.2% |
| Mexico |
Bolsa |
43145.7 |
44202.9 |
44882.0 |
1.5% |
4.0% |
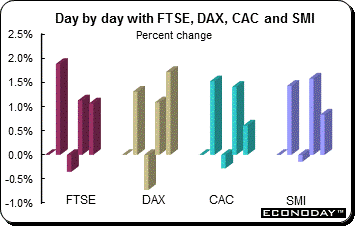 European markets rallied in the holiday shortened week. Investors breathed a sigh of relief after Greece repaid a €450 million loan to the International Monetary Fund on Thursday. IMF Chief Christine Lagarde said Athens would be afforded "flexibility" over its cash-for-reforms program. The Greek government must now work to implement much needed reforms. The FTSE jumped 3.8 percent, the SMI gained 3.7 percent, the DAX added 3.4 percent and the CAC was 3.3 percent higher. European markets rallied in the holiday shortened week. Investors breathed a sigh of relief after Greece repaid a €450 million loan to the International Monetary Fund on Thursday. IMF Chief Christine Lagarde said Athens would be afforded "flexibility" over its cash-for-reforms program. The Greek government must now work to implement much needed reforms. The FTSE jumped 3.8 percent, the SMI gained 3.7 percent, the DAX added 3.4 percent and the CAC was 3.3 percent higher.
In the background, the European Central Bank continues to pump €60 billion a month into debt markets under its stimulus program, driving down yields and pushing investors into equities in search of better returns. The ECB effect also continued to be felt in currency markets, with the euro slipping further against the dollar. Lower yields in the Eurozone diminish the currency's attractiveness to investors.
However, the Greek saga continues. After managing to pay off its €450 million IMF loan, Greece is due to pay €194 million to private bondholders on April 17, followed by a further €80 million payment to the European Central Bank on April 20. Meanwhile, according to Russian President Vladimir Putin, Greek Prime Minister Alexis Tsipras did not ask for financial aid from Russia during talks in Moscow. Talks were focused on a possible Russian investment in energy and other projects.
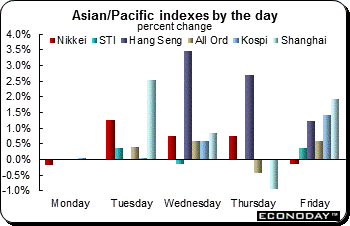 Equities rallied here with all indexes gaining on the week. Investors were relieved that the FOMC minutes left open the question of when the Fed will begin to normalize interest rates. That Greece repaid a €450 million loan it owed the International Monetary Fund also eased worries. Continued hopes that China's central bank could ease its monetary policy further underpinned investor sentiment as the week ended. All indexes followed here advanced on the week. Gains ranged from 7.9 percent (Hang Seng) to 0.2 percent (Taiex). Equities rallied here with all indexes gaining on the week. Investors were relieved that the FOMC minutes left open the question of when the Fed will begin to normalize interest rates. That Greece repaid a €450 million loan it owed the International Monetary Fund also eased worries. Continued hopes that China's central bank could ease its monetary policy further underpinned investor sentiment as the week ended. All indexes followed here advanced on the week. Gains ranged from 7.9 percent (Hang Seng) to 0.2 percent (Taiex).
The Shanghai Composite climbed 4.4 percent on the week and in the process, hit a fresh seven year high as tepid inflation data bolstered the case for more stimulus measures. China's annual consumer inflation stayed flat at 1.4 percent in March, coming in well below Beijing's target of around 3 percent for this year. The Hang Seng soared 7.9 percent in a holiday shortened three day week.
A buying frenzy that sent Chinese stocks surging in recent months spilled over into Hong Kong, where a rally picked up steam and exposed global investors to the type of volatility and unpredictability typically seen only on the mainland. The wild ride in Hong Kong was on show Thursday when the Hang Seng soared 6.4 percent in the opening minutes of trading, quickly pared gains to 1.8 percent and then rebounded to end the day up 2.7 percent. The surge of activity in Hong Kong comes months after Beijing opened up a trading link between the city and Shanghai in the hope that global investors, who tend to hold stocks longer than fast trading mom-and-pop investors in China, will help stabilize the freewheeling mainland market. But the reverse is happening ─ the prospect of fresh money from mainland investors through the same trading channel is pumping up buying in the Hong Kong market and making it more jumpy.
The Nikkei breached the 20,000 level Friday in early trading for the first time since April 2000 on hopes for larger shareholder returns and a recovery in domestic consumption. Until recently, Tokyo's rally had been mostly fueled by domestic investors, including Japanese public pensions and the Bank of Japan. But foreign buying recently reached its highest since November, according to the latest data from Japan's Ministry of Finance. For the week ending April 3, foreign investors bought a net ¥1 trillion yen of stocks. Japan's market has been outpacing many of its global counterparts, with foreign investors shifting money from bonds to Japanese stocks in anticipation of higher yields. These players also reckon things are looking up for the nation's retailers and other businesses.
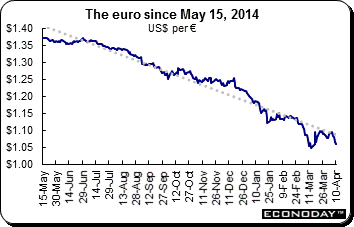 The U.S. dollar advanced against all of its major counterparts last week with the exception of the Australian dollar. After hesitating in its climb, the rally is drawing impetus from the FOMC minutes released on Wednesday. The dollar rally slowed in the last month with disappointing U.S. economic data such as last week's weak jobs report underscoring a weak first quarter. Still, expectations for a recovery are putting a floor under the dollar. The currency's nine month rally had stalled since the March meeting, when U.S. officials reined in expectations for how quickly the fed funds rate will rise. However, the minutes of the meeting made clear that FOMC members believe the U.S. economy could still warrant a rate increase as soon as June. The U.S. dollar advanced against all of its major counterparts last week with the exception of the Australian dollar. After hesitating in its climb, the rally is drawing impetus from the FOMC minutes released on Wednesday. The dollar rally slowed in the last month with disappointing U.S. economic data such as last week's weak jobs report underscoring a weak first quarter. Still, expectations for a recovery are putting a floor under the dollar. The currency's nine month rally had stalled since the March meeting, when U.S. officials reined in expectations for how quickly the fed funds rate will rise. However, the minutes of the meeting made clear that FOMC members believe the U.S. economy could still warrant a rate increase as soon as June.
The U.S. dollar recovered lost ground on Tuesday as trading desks returned to full strength after the Easter weekend and underlying trends for its continued rise reappeared, although it remains hemmed in to tight ranges by mixed economic data. A surprising move by the Reserve Bank of Australia not to cut interest rates boosted the Australian dollar.
|
|
2014 |
2015 |
% Change |
|
|
Dec 31 |
April 2 |
April 10 |
Week |
2015 |
| U.S. $ per currency |
|
|
|
|
|
|
| Australia |
A$ |
0.817 |
0.758 |
0.768 |
1.3% |
-6.0% |
| New Zealand |
NZ$ |
0.780 |
0.750 |
0.754 |
0.6% |
-3.3% |
| Canada |
C$ |
0.861 |
0.796 |
0.795 |
-0.1% |
-7.8% |
| Eurozone |
euro (€) |
1.210 |
1.088 |
1.060 |
-2.6% |
-12.4% |
| UK |
pound sterling (£) |
1.559 |
1.482 |
1.463 |
-1.2% |
-6.1% |
|
|
|
|
|
|
|
| Currency per U.S. $ |
|
|
|
|
|
|
| China |
yuan |
6.206 |
6.197 |
6.209 |
-0.2% |
-0.1% |
| Hong Kong |
HK$* |
7.755 |
7.753 |
7.750 |
0.0% |
0.1% |
| India |
rupee |
63.044 |
62.498 |
62.320 |
0.3% |
1.2% |
| Japan |
yen |
119.820 |
119.740 |
120.230 |
-0.4% |
-0.3% |
| Malaysia |
ringgit |
3.497 |
3.669 |
3.667 |
0.1% |
-4.6% |
| Singapore |
Singapore $ |
1.325 |
1.357 |
1.368 |
-0.8% |
-3.2% |
| South Korea |
won |
1090.980 |
1095.550 |
1092.680 |
0.3% |
-0.2% |
| Taiwan |
Taiwan $ |
31.656 |
31.140 |
31.226 |
-0.3% |
1.4% |
| Thailand |
baht |
32.880 |
32.462 |
32.556 |
-0.3% |
1.0% |
| Switzerland |
Swiss franc |
0.9942 |
0.959 |
0.980 |
-2.1% |
1.5% |
| *Pegged to U.S. dollar |
|
|
|
|
|
|
| Source: Bloomberg |
|
|
|
|
|
|
The number of U.S. rigs drilling for oil fell the most in a month, a sign that America's cutbacks are not over yet. Drillers idled 42 oil rigs (excluding gas rigs), reducing the number to 760, according to Baker Hughes. The rig count has dropped 53 percent since October, an unprecedented retreat, as the decline in oil prices has made production less profitable. However, production has not slowed thanks to new efficiencies which may make numbers of rigs in the field misleading. But the least productive rigs are closed first.
 February retail sales were down 0.2 percent and were up 3.0 percent on the year. The monthly weakness was concentrated in the food, drink & tobacco where purchases were down 0.8 percent after a 0.9 percent increase last time. By contrast, excluding auto fuel, non-food demand edged up 0.1 percent, its fifth consecutive monthly advance. Fuel sales were off 0.4 percent. Regionally February's reversal was led by Germany where sales slid 0.5 percent from January although this only slighted dented the previous two months' cumulative 3.4 percent increase. Among the other larger countries Spain (down 0.7 percent) had a poor period and France (unchanged) similarly failed to make any progress. February retail sales were down 0.2 percent and were up 3.0 percent on the year. The monthly weakness was concentrated in the food, drink & tobacco where purchases were down 0.8 percent after a 0.9 percent increase last time. By contrast, excluding auto fuel, non-food demand edged up 0.1 percent, its fifth consecutive monthly advance. Fuel sales were off 0.4 percent. Regionally February's reversal was led by Germany where sales slid 0.5 percent from January although this only slighted dented the previous two months' cumulative 3.4 percent increase. Among the other larger countries Spain (down 0.7 percent) had a poor period and France (unchanged) similarly failed to make any progress.
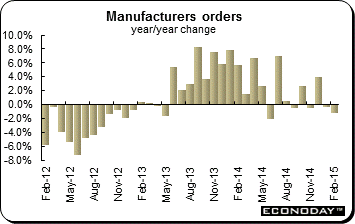 February manufacturing orders were down 0.9 percent on the month after sinking 2.6 percent the month before. This was their first back-to-back decline since May/June last year and saw seasonally and workday adjusted growth ease from minus 0.4 percent to minus 1.2 percent, its worst performance since June 2014. Weakness was concentrated in basics and capital goods which recorded monthly decreases of 1.2 percent and 1.1 percent respectively. Consumer & durables were up 2.9 percent. The domestic market recorded no overall change from January leaving a 1.6 percent drop in overseas demand wholly responsible for the fall in headline orders. Within this, the rest of the Eurozone shrank 2.1 percent while non-Eurozone orders were off 1.3 percent. February manufacturing orders were down 0.9 percent on the month after sinking 2.6 percent the month before. This was their first back-to-back decline since May/June last year and saw seasonally and workday adjusted growth ease from minus 0.4 percent to minus 1.2 percent, its worst performance since June 2014. Weakness was concentrated in basics and capital goods which recorded monthly decreases of 1.2 percent and 1.1 percent respectively. Consumer & durables were up 2.9 percent. The domestic market recorded no overall change from January leaving a 1.6 percent drop in overseas demand wholly responsible for the fall in headline orders. Within this, the rest of the Eurozone shrank 2.1 percent while non-Eurozone orders were off 1.3 percent.
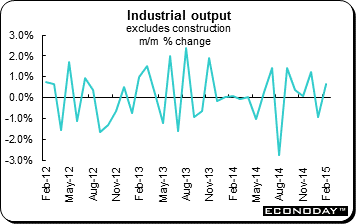 February industrial production expanded 0.2 percent on the month. However, this was only after a sharp downward revision to January which now shows output declining 0.4 percent as opposed to the previously reported 0.6 percent gain. Annual seasonally and workday adjusted growth declined from minus 0.1 percent to minus 0.3 percent, its slowest pace since November 2014. February's modest monthly headline advance mainly reflected a 1.2 percent increase in capital goods output although intermediates (0.2 percent) as well as energy (1.2 percent) also made fresh progress. In fact manufacturing saw a respectable 0.5 percent increase despite a 0.3 percent reversal in consumer goods. However, construction was down a sizeable 3.1 percent. February industrial production expanded 0.2 percent on the month. However, this was only after a sharp downward revision to January which now shows output declining 0.4 percent as opposed to the previously reported 0.6 percent gain. Annual seasonally and workday adjusted growth declined from minus 0.1 percent to minus 0.3 percent, its slowest pace since November 2014. February's modest monthly headline advance mainly reflected a 1.2 percent increase in capital goods output although intermediates (0.2 percent) as well as energy (1.2 percent) also made fresh progress. In fact manufacturing saw a respectable 0.5 percent increase despite a 0.3 percent reversal in consumer goods. However, construction was down a sizeable 3.1 percent.
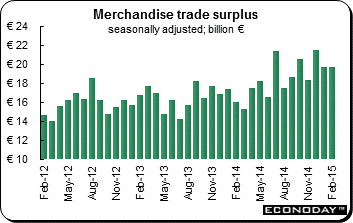 February seasonally adjusted trade surplus was unchanged at January's marginally smaller revised €19.6 billion. Unadjusted, the black ink stood at €19.2 billion, up from €15.9 billion at the start of the year. The flat seasonally adjusted headline was the result of a 1.5 percent monthly increase in exports that was offset by a 1.8 percent increase in imports. Exports have been particularly volatile in recent months and while February's gain failed to offset a 2.1 percent drop in January, this followed a 2.8 percent spurt in December. Still, at €97.7 billion overseas purchases still saw their second highest level on record and unadjusted annual growth rose to 3.9 percent. Meantime, the monthly increase in imports was the first since November and only the second since September. Lower oil costs are a factor here and reflecting this, imports were up just 0.8 percent compared with a year ago. February seasonally adjusted trade surplus was unchanged at January's marginally smaller revised €19.6 billion. Unadjusted, the black ink stood at €19.2 billion, up from €15.9 billion at the start of the year. The flat seasonally adjusted headline was the result of a 1.5 percent monthly increase in exports that was offset by a 1.8 percent increase in imports. Exports have been particularly volatile in recent months and while February's gain failed to offset a 2.1 percent drop in January, this followed a 2.8 percent spurt in December. Still, at €97.7 billion overseas purchases still saw their second highest level on record and unadjusted annual growth rose to 3.9 percent. Meantime, the monthly increase in imports was the first since November and only the second since September. Lower oil costs are a factor here and reflecting this, imports were up just 0.8 percent compared with a year ago.
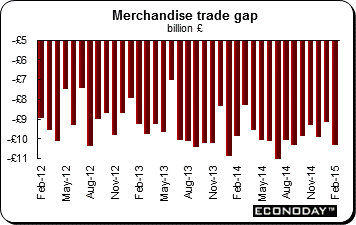 February global good trade deficit widened to £10.34 billion. The underlying shortfall which excludes oil and other erratic items climbed from £8.35 billion to £9.12 billion. The latest headline deterioration reflected mainly a 3.7 percent monthly drop in exports although a 0.8 percent rise in imports did not help either. Worryingly, the decline in the former followed an even steeper 4.3 percent slump at the start of the year and means that the level of exports is now at its lowest mark since September 2010. Weakness was particularly marked in manufactures and the overall drop would have been sharper still but for a pick-up in fuel exports. Net trade with the rest of the EU actually posted a small improvement but the shortfall with the rest of the world increased. For now, despite the disappointing nominal figures, underlying volume trends actually remain positive. Over the last three months, core export volumes rose 2.4 percent compared with a 1.7 percent increase in imports. February global good trade deficit widened to £10.34 billion. The underlying shortfall which excludes oil and other erratic items climbed from £8.35 billion to £9.12 billion. The latest headline deterioration reflected mainly a 3.7 percent monthly drop in exports although a 0.8 percent rise in imports did not help either. Worryingly, the decline in the former followed an even steeper 4.3 percent slump at the start of the year and means that the level of exports is now at its lowest mark since September 2010. Weakness was particularly marked in manufactures and the overall drop would have been sharper still but for a pick-up in fuel exports. Net trade with the rest of the EU actually posted a small improvement but the shortfall with the rest of the world increased. For now, despite the disappointing nominal figures, underlying volume trends actually remain positive. Over the last three months, core export volumes rose 2.4 percent compared with a 1.7 percent increase in imports.
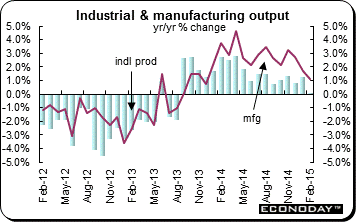 February industrial production edged up just 0.1 percent on the month and 0.1 percent from a year ago. However, manufacturing output expanded 0.4 percent from January when it declined a marginally steeper revised 0.6 percent. On the year, manufacturing was up 1.1 percent. Within manufacturing, seven of the thirteen reporting subsectors posted monthly gains, led by transport equipment (1.6 percent) which alone added 0.2 percentage points to the change in total production. Other contributions were much smaller and for categories where output fell, the declines were only limited. The goods producing sector as whole was hit by monthly declines in mining & quarrying (2.7 percent), where crude petroleum & natural gas slumped nearly 4 percent, and water supply, sewerage & waste (1.4 percent). However, electricity, gas, steam & air conditioning (1.2 percent) had a strong period. February industrial production edged up just 0.1 percent on the month and 0.1 percent from a year ago. However, manufacturing output expanded 0.4 percent from January when it declined a marginally steeper revised 0.6 percent. On the year, manufacturing was up 1.1 percent. Within manufacturing, seven of the thirteen reporting subsectors posted monthly gains, led by transport equipment (1.6 percent) which alone added 0.2 percentage points to the change in total production. Other contributions were much smaller and for categories where output fell, the declines were only limited. The goods producing sector as whole was hit by monthly declines in mining & quarrying (2.7 percent), where crude petroleum & natural gas slumped nearly 4 percent, and water supply, sewerage & waste (1.4 percent). However, electricity, gas, steam & air conditioning (1.2 percent) had a strong period.
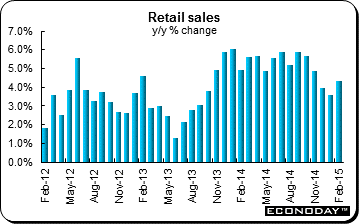 February retail sales were up a greater than anticipated 0.7 percent on the month and 4.3 percent when compared with the same month a year ago. Lower petrol prices and the lower Australian dollar continue to boost sales. In addition the RBA's February rate cut also boosted consumer sentiment. The increase marked the third straight monthly gain. January was also revised upward to an increase of 0.5 percent from 0.4 percent. The biggest contributor to the monthly increase was food retailing (1.2 percent). Also recording monthly increases were household goods (1.8 percent) and other retailing (1.3 percent). However, department stores (down 3.2 percent), cafes, restaurants & takeaway food services (down 0.4 percent) and clothing, footwear & personal accessory retailing (down 0.2 percent) declined. In seasonally adjusted terms there were gains in all states and territories. New South Wales (0.7 percent), Victoria (0.8 percent), South Australia (1.7 percent), Western Australia (0.7 percent), Queensland (0.2 per cent), the Australian Capital Territory (1.6 percent), the Northern Territory (2.3 percent.) and Tasmania (0.7 percent) all gained. February retail sales were up a greater than anticipated 0.7 percent on the month and 4.3 percent when compared with the same month a year ago. Lower petrol prices and the lower Australian dollar continue to boost sales. In addition the RBA's February rate cut also boosted consumer sentiment. The increase marked the third straight monthly gain. January was also revised upward to an increase of 0.5 percent from 0.4 percent. The biggest contributor to the monthly increase was food retailing (1.2 percent). Also recording monthly increases were household goods (1.8 percent) and other retailing (1.3 percent). However, department stores (down 3.2 percent), cafes, restaurants & takeaway food services (down 0.4 percent) and clothing, footwear & personal accessory retailing (down 0.2 percent) declined. In seasonally adjusted terms there were gains in all states and territories. New South Wales (0.7 percent), Victoria (0.8 percent), South Australia (1.7 percent), Western Australia (0.7 percent), Queensland (0.2 per cent), the Australian Capital Territory (1.6 percent), the Northern Territory (2.3 percent.) and Tasmania (0.7 percent) all gained.
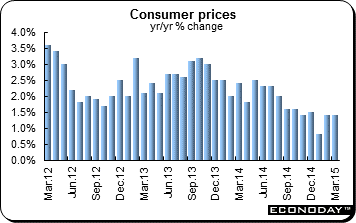 Consumer prices were up 1.4 percent for a second month in March when compared with a year ago. However, the CPI dropped 0.5 percent on the month after increasing 1.2 percent in February and 0.3 percent in January. For the year to date, the CPI was up 1.2 percent. The urban CPI eased to an increase of 1.4 percent on the year from 1.5 percent the month before. Rural consumer prices were up 1.2 percent for a second month. Among the subcategories, food prices were little changed from February, increasing 2.3 percent and 2.2 percent while nonfood prices were up 0.9 percent in March. Transportation & communication prices dropped 1.5 percent after sinking 1.7 percent the month before while tobacco & alcohol prices declined 0.5 percent after 0.6 percent in February. Subdued demand and falling oil prices continue to pull Chinese inflation well below Beijing's target. The reading was well below Beijing's target of "around 3 percent" this year, though it is slightly up from January's five-year low of 0.8 percent. Consumer prices were up 1.4 percent for a second month in March when compared with a year ago. However, the CPI dropped 0.5 percent on the month after increasing 1.2 percent in February and 0.3 percent in January. For the year to date, the CPI was up 1.2 percent. The urban CPI eased to an increase of 1.4 percent on the year from 1.5 percent the month before. Rural consumer prices were up 1.2 percent for a second month. Among the subcategories, food prices were little changed from February, increasing 2.3 percent and 2.2 percent while nonfood prices were up 0.9 percent in March. Transportation & communication prices dropped 1.5 percent after sinking 1.7 percent the month before while tobacco & alcohol prices declined 0.5 percent after 0.6 percent in February. Subdued demand and falling oil prices continue to pull Chinese inflation well below Beijing's target. The reading was well below Beijing's target of "around 3 percent" this year, though it is slightly up from January's five-year low of 0.8 percent.
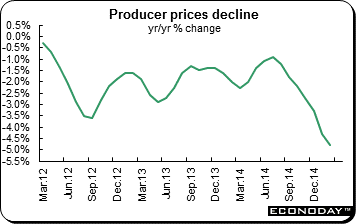 Producer prices continue to be a problem. The PPI declined for a 37th consecutive month in March, falling 4.6 percent after sinking 4.8 percent in February. Producer prices have been falling as China's housing market struggles leading to excess supply of the materials used in the housing boom. Falling oil prices have exacerbated the problem. The PPI was down 0.1 percent on the month, an improvement over February's decline of 0.7 percent. For the year to date, the PPI also declined 3.5 percent. Most subindexes declined. Production materials were down 5.7 percent from a year ago while consumer goods edged down just 0.1 percent. Fuel & power dropped 11.5 percent. Producer prices continue to be a problem. The PPI declined for a 37th consecutive month in March, falling 4.6 percent after sinking 4.8 percent in February. Producer prices have been falling as China's housing market struggles leading to excess supply of the materials used in the housing boom. Falling oil prices have exacerbated the problem. The PPI was down 0.1 percent on the month, an improvement over February's decline of 0.7 percent. For the year to date, the PPI also declined 3.5 percent. Most subindexes declined. Production materials were down 5.7 percent from a year ago while consumer goods edged down just 0.1 percent. Fuel & power dropped 11.5 percent.
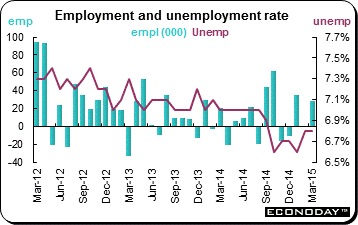 March employment increased 28,700. The participation rate advanced 0.1 percentage point to 65.9 percent, leaving the jobless rate steady at 6.8 percent. The headline increase in jobs was wholly attributable to part time positions which climbed 56,800 while full time headcount dropped 28,200. The public sector created a net 26,500 new jobs while the private sector was up a more modest 19,300. The number of self-employed declined 17,000. At a sector level, a 45,300 jump in service sector positions contrasted sharply with a 16,500 decline in the goods producing area. Within the latter, manufacturing was down 2,400, construction 12,100 and agriculture was off 6,100. The only increase was recorded in natural resources (6,300). The expansion in headcount in services was dominated by a 19,800 rise in trade and a 15,900 advance in transportation & warehousing. Educational services (12,100) and finance, insurance, real-estate & leasing (7,700) also enjoyed a good month. On the downside, the steepest reversal was in public administration (11,300) ahead of business, building & other support services (4,900) and professional, scientific & technical services (4,000). March employment increased 28,700. The participation rate advanced 0.1 percentage point to 65.9 percent, leaving the jobless rate steady at 6.8 percent. The headline increase in jobs was wholly attributable to part time positions which climbed 56,800 while full time headcount dropped 28,200. The public sector created a net 26,500 new jobs while the private sector was up a more modest 19,300. The number of self-employed declined 17,000. At a sector level, a 45,300 jump in service sector positions contrasted sharply with a 16,500 decline in the goods producing area. Within the latter, manufacturing was down 2,400, construction 12,100 and agriculture was off 6,100. The only increase was recorded in natural resources (6,300). The expansion in headcount in services was dominated by a 19,800 rise in trade and a 15,900 advance in transportation & warehousing. Educational services (12,100) and finance, insurance, real-estate & leasing (7,700) also enjoyed a good month. On the downside, the steepest reversal was in public administration (11,300) ahead of business, building & other support services (4,900) and professional, scientific & technical services (4,000).
Several central banks met and kept their respective monetary policies unchanged. Equities in Asia and Europe had healthy gains in a holiday shortened week. The FTSE closed at its highest ever level. At the same time, the Nikkei soared through the 20,000 level temporarily for the first time since April 2000.
Central bank activities will retain investor focus for a second week. The Bank of Canada and European Central Bank announce policy decisions while the Federal Reserve publishes its Beige Book in preparation for its meeting later this month. U.S. industrial production and consumer prices will be released along with China's first quarter GDP. And earnings season in the U.S. gets underway in earnest.
| Central Bank activities |
|
| April 15 |
Canada |
Bank of Canada Monetary Policy Announcement |
|
Eurozone |
European Central Bank Monetary Policy Announcement |
|
United States |
Federal Reserve Beige Book Published |
| |
|
|
| The following indicators will be released this week... |
| Europe |
|
|
| April 13 |
Italy |
Industrial Production (February) |
| April 14 |
Eurozone |
Industrial Production (February) |
|
UK |
Consumer Price Index (March) |
|
|
Producer Price Index (March) |
| April 15 |
Eurozone |
Merchandise Trade (February) |
| April 16 |
Italy |
Merchandise Trade (February) |
| April 17 |
Eurozone |
Harmonized Index of Consumer Prices (March final) |
|
UK |
Labour Market Report (March) |
| |
|
|
| Asia/Pacific |
|
|
| April 13 |
Japan |
Producer Price Index (March) |
|
|
Private Machine Orders (February) |
|
China |
Merchandise Trade (March) |
|
India |
Consumer Price Index (March) |
|
|
Industrial Production (February) |
| April 15 |
China |
Gross Domestic Product (Q1.2015) |
|
|
Industrial Production (March) |
|
|
Retail Sales (March) |
| April 16 |
Australia |
Labour Force Survey (February) |
| |
|
|
| Americas |
|
|
| April 15 |
Canada |
Manufacturing Sales (February) |
| April 17 |
Canada |
Consumer Price Index (March) |
|
|
Retail Sales (February) |
Anne D Picker is the author of International Economic Indicators and Central Banks.
|
