|
The second tier labor market indicators were generally soft this past week, suggesting that the Fed will not be in a hurry to raise rates. But corporate news was mostly favorable.
Equities ended the week with solid gains.
Monday, stocks rose as energy shares rallied with the price of crude. Contributing to the rally was continued speculation the Federal Reserve will delay rate hikes after the prior week's weaker-than-forecast employment data for March. Stocks closed slightly lower Tuesday on lack of momentum with no notable economic news and on profit taking.
 Stocks were slightly higher Wednesday as investors parsed the minutes from the latest Federal Reserve meeting. The minutes were seen as dovish—confirming trader views of the earlier FOMC statement. Stocks were slightly higher Wednesday as investors parsed the minutes from the latest Federal Reserve meeting. The minutes were seen as dovish—confirming trader views of the earlier FOMC statement.
Stocks closed higher on Thursday with energy shares leading the advance as crude oil rebounded. Walgreens Boots was up after its income beat analysts' forecasts. Alcoa posted a first quarter profit that beat expectations, but its revenue fell short. Stocks closed out a strong week with a broad rally on Friday as investors favorably reacted to General Electric's decision to divest most of its high-risk GE Capital business and repurchase up to $50 billion of its shares.
Equities were up this past week. The Dow was up 1.7 percent; the S&P 500, up 1.7 percent; the Nasdaq, up 2.2 percent; the Russell 2000, up 0.7 percent; and the Wilshire 5000, up 1.5 percent.
For the year-to-date, major indexes are up as follows: the Dow, up 1.3 percent; the S&P 500, up 2.1 percent; the Nasdaq, up 5.5 percent; the Russell 2000, up 5.0 percent; and the Wilshire 5000, up 2.8 percent.
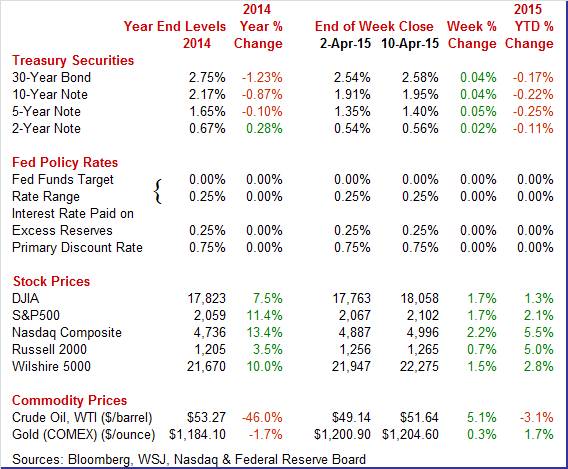
Weekly percent change column reflects percent changes for all components except interest rates. Interest rate changes are reflected in simple differences.
 Treasury rates edged up this past week. Daily market movements were not significant except for modest gains Thursday on mere uncertainty on the direction of Fed policy. But overall, Treasury movements were tame. Treasury rates edged up this past week. Daily market movements were not significant except for modest gains Thursday on mere uncertainty on the direction of Fed policy. But overall, Treasury movements were tame.
For this past week Treasury rates were mostly up marginally as follows: the 2-year note, up 2 basis points; the 5-year note, up 5 basis points; the 7-year note, up 4 basis points; the 10-year note, up 4 basis points; and the 30-year bond, up 4 basis points. The 3-month T-bill was unchanged;
 The spot price of crude rebounded moderately this past week. The spot price of crude rebounded moderately this past week.
The biggest gain was Monday on signs of growing demand in the U.S. and Asia. Supplies at Cushing were reported to have dipped. Crude fell Wednesday on news of a jump in supplies from the weekly government report.
Overall, supply is still heavy and weighing on prices. But on the margin—emphasis on the margin—prices have headed up somewhat and likely will bump up PPI and CPI numbers.
Net for the week, the spot price for West Texas Intermediate rose $2.50 per barrel to settle at $51.64.
The economy seems to be slowing modestly but corporate profits are favorable. Soft labor market conditions are seen as keeping Fed policy loose.
The Federal Reserve published the minutes from its March 17 and 18 meeting when they maintained the fed funds rate range at zero to 0.25 percent. They also deleted the word "patience" from its guidance. The FOMC was split in several directions over the right moment to start lifting rates with some advocating a move as soon as June while others advocated waiting until later this year or into 2016. Minutes noted that several FOMC members expected a move to be merited in June given the improved economic outlook. However others expected falling energy prices and the higher US dollar to keep weighing on inflation, pushing them towards a first move later this year. Two members advocated waiting until 2016.
The divisions point to uncertainty on the committee over how to interpret conflicting evidence about the strength of the recovery and the inflation outlook, amid softer first quarter growth and low inflation coupled with robust job market gains. The meeting was held prior to the release of the weak March employment data.
Monetary policy is going to get messy sometime over the next 12 months. Important new language—as mentioned in the minutes—includes reverse repos (RRP) and interest on excess reserves (IOER).
"In their discussion regarding strategies for reducing ON RRP usage, should it become undesirably large during the early stages of normalization, most participants viewed raising the IOER rate, thereby widening the spread between the IOER and ON RRP rates, as an appropriate initial step."
The minutes reiterated that policy changes will be very gradual. This is probably the most important point out of the minutes.
 The Fed's internal labor market data softened and suggest more control by the Fed doves. The Fed's internal labor market data softened and suggest more control by the Fed doves.
The Fed's Board of Governors Research Department's unofficial report on labor market conditions came in weak for March, dropping to minus 0.3 from plus 2.0 in February. There was no text or detail in the unofficial report but it is highly likely that it was weighed down by the March payroll number from the BLS. Odds have gone up for delayed rate hiking by the Fed. The March number was the lowest since minus 2.4 for June 2012. The Fed revises the historical data every month.
 Job openings rose only modestly in the latest month. Job openings rose only modestly in the latest month.
There were 5.133 million job openings on the last business day of February, little changed from 4.965 million in January. Hires were little changed at 4.916 million in February and separations were little changed at 4.650 million. Within separations, the quits rate was 1.9 percent and the layoffs and discharges rate was 1.1 percent; both rates were little different from the previous month. The release included estimates of the number and rate of job openings, hires, and separations for the nonfarm sector by industry and by four geographic regions.
Over the 12 months ending in February, the number of hires (not seasonally adjusted) was little changed for total nonfarm, total private, and government. The number of hires was little changed in all industries and increased in the Northeast region.
 The headline for consumer credit looked good but the detail was not so good. The headline for consumer credit looked good but the detail was not so good.
Consumer credit rose a solid looking $15.5 billion in February but a closer look shows an unwanted $3.7 billion decline in revolving credit. This is the 4th decline in 5 months for the revolving component which reflects consumer reluctance to finance purchases with credit-card debt. This reluctance may be a plus for consumer wealth, given the extremely high rates of interest credit-card companies often charge, but it is a definite negative for consumer spending which has been very soft in recent months.
In contrast to revolving credit, non-revolving credit rose $19.2 billion which is the strongest gain since July 2011. The gain does reflect financing for autos but also an item not associated with consumer spending, and that's the government's ongoing and heavy acquisition of student loans.
 The economy appears to be very mixed currently. Manufacturing is sluggish along with construction but services—a key part of non-manufacturing—appears to be keeping economic growth moderately positive. The economy appears to be very mixed currently. Manufacturing is sluggish along with construction but services—a key part of non-manufacturing—appears to be keeping economic growth moderately positive.
The ISM non-manufacturing index came in at a very healthy 56.5 for March. Strength in new orders, at 57.8, is a key plus in the report as is growth in backlog orders, at 53.5 which is relatively strong for this reading. Employment, at 56.6, is very strong and at a 5-month high.
Breadth of strength is especially encouraging with 14 of 18 industries reporting composite growth in the month led by management services at the top and even including construction which, though the slowest of the 14, is still in the plus column. The 4 industries in the negative column include mining and also education.
Weakness in foreign demand for US goods, the result in part of the strong dollar, is increasing focus on the non-manufacturing economy and the ability of the US consumer to keep up the nation's economic growth. Right now, with employment trends solid, consumers appear to be doing their share.
 The Fed wants inflation to firm but it's not happening from import prices. Energy and a strong dollar are keeping import prices down. The Fed wants inflation to firm but it's not happening from import prices. Energy and a strong dollar are keeping import prices down.
The doves at the Fed can be a little more persuasive following the latest import & export price report where there are scant signs of any inflationary pressures. Import prices fell 0.3 percent in March with the key reading excluding petroleum down 0.4 percent. Year-on-year, import prices are down for an 8th straight month, at an eye-popping minus 10.5 percent overall and down 2.7 percent excluding petroleum. These year-on-year rates are both the steepest declines since late 2009.
It's all about the Fed and goals. Labor market conditions are still soft despite a lower unemployment rate. And inflation is low. The Fed is likely to stay loose for some time and be extremely gradual with policy moves.
This week covers a variety of sectors. Both manufacturing and housing have shown sluggish numbers. We move into more normal weather with this week's data and get updates on industrial production and housing starts and permits. The Fed wants firmer inflation and data are posted for the PPI and CPI.
February's Treasury deficit was $192.3 billion, slightly below last February's deficit of $193.5 billion. But the year-to-date deficit, five months into the Treasury's fiscal year, was slightly above last year, by 2.7 percent at $386.5 billion. Year-to-date receipts, led by gains in corporate and individual taxes, which both reflect economic strength, are up a solid 7.1 percent. This, however, was offset by outlays which are the larger side of the ledger and which were up 6.0 percent. Looking ahead, the month of March typically shows a deficit for the month. Over the past 10 years, the average deficit for the month of March has been $108.8 billion and $119.0 billion over the past 5 years. The March 2014 deficit came in at $36.9 billion.
Treasury Statement Consensus Forecast for March15: -$43.4 billion
Range: -$50.0 billion to -$40.0 billion
The producer price index for final demand fell 0.5 percent in February after decreasing 0.8 percent in January. Energy was flat, following a 10.3 percent drop while foods decreased 1.6 percent, following a 1.1 percent dip in January. Excluding food and energy, producer price inflation posted a minus monthly 0.5 percent after slipping 0.1 percent the month before. The index for final demand goods decreased 0.4 percent after falling 2.1 percent in January. Leading the decrease, margins for final demand trade services dropped 1.5 percent. (Trade indexes measure changes in margins received by wholesalers and retailers.) The index for final demand services fell 0.5 percent after easing 0.2 percent the month before.
PPI-FD Consensus Forecast for March 15: +0.2 percent
Range: 0.0 to +0.5 percent
PPI-FD ex Food & Energy Consensus Forecast for March 15: +0.1 percent
Range: 0.0 to +0.2 percent
PPI-FD ex Food & Energy & Trade Services Consensus Forecast for March 15
No consensus numbers are available for this month's report
Retail sales dropped in February but gasoline prices were not to blame—rather auto sales. Retail sales in February declined 0.6 percent after decreasing 0.8 percent in January. As expected from unit new auto sales data, auto sales dropped 2.5 percent, following a 0.5 percent rise in January. Excluding autos, sales decreased 0.1 percent, following a 1.1 percent drop in January. Gasoline sales actually partially rebounded 1.5 percent in February after dropping 9.8 percent the month before. Excluding both autos and gasoline sales fell 0.2 percent after slipping 0.1 percent in January.
Retail sales Consensus Forecast for March 15: +1.1 percent
Range: +0.6 to +1.5 percent
Retail sales excluding motor vehicles Consensus Forecast for March 15: +0.6 percent
Range: +0.3 to +1.3 percent
Less motor vehicles & gasoline Consensus Forecast for March 15: +0.4 percent
Range: +0.2 to +0.9 percent
The NFIB Small Business Optimism Index in February edged 1 tenth higher to 98.0. The strongest component was job openings hard to fill. The gain here points to lack of slack in the jobs market, at least for skilled workers. The second strongest component, plans to increase capital outlays, showed no change but the level does point to business confidence and the need to hire in future months. Most readings in the report showed very little change with inflation readings showing no pressure and credit needs at an historic low.
NFIB Small Business Optimism Index Consensus Forecast for March 15 98.2
Range: 97.0 to 99.2
Business inventories were unchanged in both January and a revised December vs sizable declines in sales of 2.0 percent in January and 1.0 percent in December. The inventory-to-sales ratio is at 1.35 vs 1.33 in December and 1.31 in November.
Business inventories Consensus Forecast for February 15: +0.2 percent
Range: +0.2 to +0.3 percent
The Empire State manufacturing index in March, at an index of 6.90, remained modestly favorable but order data have been very soft both this quarter and going back to the fourth quarter. New orders were in contraction in the March report, at minus 2.39 which is the second negative reading of the last 6 months, a stretch where this reading has averaged a pitiful plus 2.24.
Empire State Manufacturing Survey Consensus Forecast for April 15: 7.0
Range: 3.0 to 10.2
Industrial production continued to be soft in February and the manufacturing sector continued to struggle. Industrial production for February edged up 0.1 percent after declining 0.3 percent in January. Overall industrial production was supported by a spike in utilities-other major components declined. Manufacturing dipped 0.2 percent in February after falling 0.3 percent the month before. This was the third consecutive decline for this component. The manufacturing drop was worse than analysts' forecast for a 0.1 percent rise. Notably, manufacturing was revised down for January from plus 0.2 percent to minus 0.3 percent. Mining dropped 2.5 percent in February after a 1.3 percent decrease the prior month. Utilities surged 7.3 percent after gaining 1.0 percent in January.
Overall capacity utilization slipped to 78.9 percent from 79.1 percent in January.
Industrial production Consensus Forecast for March 15: -0.3 percent
Range: -0.9 to +0.3 percent
Manufacturing production component Consensus Forecast for March 15: +0.2 percent
Range: -0.1 to +0.4 percent
Capacity utilization Consensus Forecast for March 15: 78.7 percent
Range: 78.1 to 79.2 percent
The NAHB housing market index showed the lack of first-time buyers as an increasing negative for the new home market, evident in the housing market index for March where growth slowed 2 points to an 8-month low of 53. The traffic component of the index again showed particular weakness, down 2 points to 37 which was a 9-month low and that directly reflected the lack of first-time buyers. The other 2 components of the report remained well over 50, at 58 for current sales, which however was down 3 points from February for a 5-month low, and at 59 for future sales which was unchanged.
NAHB housing market index Consensus Forecast for April 15: 55
Range: 53 to 57
The Beige Book being prepared for the April 28-29 FOMC meeting is released. Traders will likely focus on labor market and inflation commentary.
Housing starts unexpectedly fell sharply in February. Starts fell a monthly 17.0 percent, following no change in January. The 0.897 million unit pace was down 3.3 percent on a year-ago basis. This was the lowest starts level since January 2014 with a 0.897 million unit annualized pace. Adverse winter weather likely played a role. Single-family units dipped 14.9 percent in February, following a 3.9 percent decrease the month before. Multifamily units dropped 20.8 percent after rising 7.9 percent in January. Housing permits, however, were more positive, gaining 3.0 percent after no change in January. The 1.092 million unit pace was up 7.7 percent on a year-ago basis.
Housing starts Consensus Forecast for March 15: 1.040 million-unit rate
Range: 0.950 million to 1.120 million-unit rate
Housing permits Consensus Forecast for March 15: 1.085 million-unit rate
Range: 1.040 million to 1.150 million-unit rate
Initial jobless claims rose 14,000 in the week to 281,000 following a slightly revised decline of 21,000 in the prior week. But the 4-week average, which helps smooth out weekly bumps, was down for a 3rd straight week, 3,000 lower to a 282,250 level that was more than 20,000 below the month-ago reading. This was a sizable improvement and hints at bounce-back strength for the April employment report.
Jobless Claims Consensus Forecast for 4/11/15: 280,000
Range: 275,000 to 290,000
The consumer price index rebounded 0.2 percent in February after falling a sharp 0.7 percent the month before. This was the first rise in the CPI since October. Energy gained 1.0 percent after plunging 9.7 percent in January. Gasoline prices rebounded 2.4 percent in February after plummeting 18.7 percent in January, Gasoline increased for the first time since June 2014. Food rose 0.2 percent after no change in in January. Excluding food and energy, consumer price inflation came in at 0.2 percent for both February and January. Analysts forecast a 0.1 percent gain.
CPI Consensus Forecast for March 15 +0.2 percent
Range: +0.1 to +0.5 percent
CPI ex food & energy Consensus Forecast for March 15: +0.1 percent
Range: +0.1 to +0.2 percent
The University of Michigan's consumer sentiment index rebounded back up in late March. The final consumer sentiment index ended March at 93.0, up 1.8 points from mid-month March of 91.2 and implying a late March trend of roughly the 95 area. This is a very solid area and next only to January's 8-year-high of 98.1.
The index has two components, both showing gains in the last two weeks of the month. The current conditions component rose to a final 105.0 from the mid-month's 103.0 to imply a 107 area for the last two weeks. This compares with February's 106.0 to indicate the possibility of accelerating consumer activity. Strength here also underscores the current health of the jobs market. The expectations component also rose, up 1.6 points from mid-month to 85.3 which, for the last two weeks, implies the 87 area which compares steadily with 88.0 for final February. Expectations hinge on the outlook for jobs.
Consumer sentiment Consensus Forecast for preliminary April 15: 95.0
Range: 92.0 to 100.0
The Conference Board's index of leading indicators held steady at 0.2 percent in February, pointing to moderate growth for the economy over the next 6 months. Once again the yield spread was the biggest positive for the index reflecting the Fed's near zero rate policy. The stock market was the next biggest positive followed by the report's credit index, an index that has however consistently been pointing to healthier borrowing conditions than government reports. Other readings included a 0.2 percent rise in the coincident index, which points to moderate ongoing growth, and a 0.3 percent rise in the lagging index, which points to moderate past growth. Growth may be slow but it is sustainable.
Leading indicators Consensus Forecast for March 15: +0.3 percent
Range: +0.2 to +0.4 percent
R. Mark Rogers can be found on a weekly broadcast talking about the U.S. economy, the easiest way to find him is by going to iTunes and searching for "Simply Economics."
Econoday Senior Writer Mark Pender contributed to this article.
|
