|
Equities fell sharply despite a loose leaning Beige Book due primarily to worries over Greek debt issues.
 Stocks began the week on a down note largely on anxiety about upcoming earnings reports. Tuesday was mostly up but slightly, led by gains in energy companies as the price of oil recovers. Stocks began the week on a down note largely on anxiety about upcoming earnings reports. Tuesday was mostly up but slightly, led by gains in energy companies as the price of oil recovers.
At mid-week, equities jumped with better-than-expected earnings. The standout was Delta with higher traffic and lower jet fuel costs. After little change Thursday, stocks plummeted Friday on Greek debt default worries and new stock market regulations in China.
 Equities were down this past week. The Dow was down 1.3 percent; the S&P 500, down 1.0 percent; the Nasdaq, down 1.3 percent; the Russell 2000, down 1.0 percent; and the Wilshire 5000, down 1.0 percent. Equities were down this past week. The Dow was down 1.3 percent; the S&P 500, down 1.0 percent; the Nasdaq, down 1.3 percent; the Russell 2000, down 1.0 percent; and the Wilshire 5000, down 1.0 percent.
For the year-to-date, major indexes are mostly up as follows: the S&P 500, up 1.1 percent; the Nasdaq, up 4.1 percent; the Russell 2000, up 3.9 percent; and the Wilshire 5000, up 1.8 percent. The Dow is flat for year-to-date.
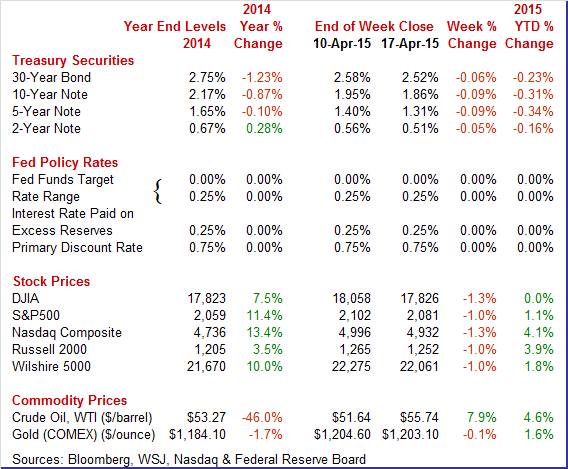
Weekly percent change column reflects percent changes for all components except interest rates. Interest rate changes are reflected in simple differences.
 Treasury yields fell moderately this past week. Treasury yields fell moderately this past week.
Yields dipped Monday on the view of continued Fed ease. Rates declined Tuesday on disappointing retail sales.
After little change Wednesday and Thursday, long rates on Friday declined moderately on flight to safety as equities fell.
Worries over Greek default played a role in flight to safety.
For this past week Treasury rates were down as follows: the 2-year note, down 5 basis points; the 5-year note, down 9 basis points; the 7-year note, down 9 basis points; the 10-year note, down 9 basis points; and the 30-year bond, down 6 basis points. The 3-month T-bill was unchanged.
 The spot price of West Texas Intermediate rebounded this past week but off of low levels. The biggest daily swings were Tuesday, Wednesday, and Friday. The spot price of West Texas Intermediate rebounded this past week but off of low levels. The biggest daily swings were Tuesday, Wednesday, and Friday.
Crude oil rose somewhat over a dollar a barrel on Tuesday after a projection that U.S. shale oil output would post its first monthly decline in more than four years. Tensions in Yemen added to price firming, where top oil exporter Saudi Arabia is involved in a civil war.
WTI jumped almost $2-1/2 per barrel Wednesday on a smaller-than-expected weekly increase in U.S. crude supplies and a higher demand forecast from the International Energy Agency.
But on Friday crude declined a dollar a barrel on Greek worries and concern that demand may soften.
Net for the week, the spot price for West Texas Intermediate increased $4.10 per barrel to settle at $55.74.
The economy is mixed but soft overall.
 Despite some recently moderately favorable sales numbers, housing activity is not picking up in actual construction. Despite some recently moderately favorable sales numbers, housing activity is not picking up in actual construction.
Housing is still sluggish based on the latest starts data which disappointed. Starts in March slightly rebounded a monthly 2.0 percent after plunging a monthly 15.3 percent in February. Expectations were for a 1.040 million pace for February. The 0.926 million unit pace was down 2.5 percent on a year-ago basis.
By region, starts gained 114.9 percent in the Northeast-almost certainly a weather related rebound but in a small region. The Midwest also saw a weather related gain of 31.3 percent. However, the large South region declined 3.5 percent and the West fell 19.3 percent.
Housing permits were a little stronger but still disappointed, falling 5.7 percent after gaining 4.0 percent in February. The 1.039 million unit pace was up 2.9 percent on a year-ago basis. The median market forecast was for a 1.085 million unit pace.
Overall, housing is still soft even with weather improving.
 The manufacturing sector remains sluggish. Industrial production for March fell 0.6 percent after a February rise of 0.1 percent. The March drop was largely due to utilities although manufacturing was soft. Manufacturing edged up 0.1 percent in March after dipping 0.2 percent the month before. The manufacturing sector remains sluggish. Industrial production for March fell 0.6 percent after a February rise of 0.1 percent. The March drop was largely due to utilities although manufacturing was soft. Manufacturing edged up 0.1 percent in March after dipping 0.2 percent the month before.
Mining dropped 0.7 percent in March after a 1.6 percent decrease the prior month. Utilities plunged 5.9 percent after surging 5.7 percent in February.
The production of durable goods moved up 0.2 percent, on the strength of a rebound in the production of motor vehicles and parts. The output of primary metals declined 3.2 percent to register the largest loss among durable goods industries. The production of nondurable goods moved up 0.1 percent; decreases in the indexes for paper, for chemicals, and for plastics and rubber products mostly offset gains by the other major nondurables industries. The production of other manufacturing industries (publishing and logging) fell 0.4 percent. The decrease of 0.7 percent for mining reflected a drop of 17 1/2 percent in the index for oil and gas well drilling and servicing that was partly offset by gains in crude oil and natural gas extraction and by a bounce back in coal mining.
Overall capacity utilization declined to 78.4 percent from 79.0 percent in February.
The manufacturing sector remains soft and the latest numbers will likely keep the Fed in a delayed mode for policy changes.
 Early indications for April in the manufacturing sector are not good. The Empire State index points to month-to-month contraction for April, at minus 1.19 for only the second negative reading in the last 23 months. The other negative reading was in December which was just about the beginning of this indicator's slowdown. Early indications for April in the manufacturing sector are not good. The Empire State index points to month-to-month contraction for April, at minus 1.19 for only the second negative reading in the last 23 months. The other negative reading was in December which was just about the beginning of this indicator's slowdown.
New orders are contracting noticeably, at minus 6.00 for the second straight contraction. Weakness in exports, tied to the strong dollar and soft global demand, is a major factor behind the dip in orders. Unfilled orders, at minus 11.70, are in sharp contraction for a second straight month.
But the drop in orders has yet to pull down shipments which, at least for now, are still in the plus column and well into the plus column, at 15.23. Employment is also well into the plus column at 9.57 on top of March's standout strength of 18.56.
 The consumer sector remains the strong point of the economy—especially after atypically adverse winter weather has lifted. Retail sales in March rebounded 0.9 percent after dropping 0.5 percent in February. The market consensus for March was for a 1.1 percent boost. Excluding autos, sales gained 0.4 percent, following no change in February. Expectations were for a 0.6 percent increase. Gasoline sales dipped 0.6 percent after a 2.3 percent increase in February. Excluding both autos and gasoline, sales rebounded 0.5 percent after declining 0.3 percent in February. Expectations were for a 0.4 percent increase. The consumer sector remains the strong point of the economy—especially after atypically adverse winter weather has lifted. Retail sales in March rebounded 0.9 percent after dropping 0.5 percent in February. The market consensus for March was for a 1.1 percent boost. Excluding autos, sales gained 0.4 percent, following no change in February. Expectations were for a 0.6 percent increase. Gasoline sales dipped 0.6 percent after a 2.3 percent increase in February. Excluding both autos and gasoline, sales rebounded 0.5 percent after declining 0.3 percent in February. Expectations were for a 0.4 percent increase.
By components, strength was seen in motor vehicles (up 2.7 percent), furniture, clothing, department stores, and miscellaneous store retailers.
On a year-ago basis, retail trade and food service were up 1.3 percent in March, compared to 1.9 percent in February.
Again, retail sales appear to be coming out of adverse winter weather doldrums. First quarter GDP estimates are likely to be nudged up. Importantly, the consumer sector is still carrying the economy.
 Consumer sentiment remains very strong, at 95.9 for the mid-month April reading vs a final March reading of 93.0 and well up from 91.2 at mid-month March. The index hit an 8-year high of 98.1 in January. Consumer sentiment remains very strong, at 95.9 for the mid-month April reading vs a final March reading of 93.0 and well up from 91.2 at mid-month March. The index hit an 8-year high of 98.1 in January.
A solid gain in the current conditions component to 108.2 vs a final March reading of 105.0 hints at strength this month for consumer activity, perhaps even for retail sales. The expectations component is at 88.0, up from 85.3 and pointing to rising confidence in the jobs outlook.
Gas prices are steady at low levels and are contributing to a significant downturn in inflation expectations, to 2.5 percent for the 1-year outlook vs a final reading of 3.0 percent in March. Five-year expectations are also down, to 2.6 percent from 2.8 percent.
These inflation readings are very low for this report and are certain to catch the eyes of Federal Reserve policy makers who are hoping for an increase in pressures. Low inflation expectations pose the risk of a self-fulfilling prophecy, that consumers will refrain from spending in anticipation that prices will move lower.
 Consumer price inflation remains on a low trajectory. Consumer price inflation remains on a low trajectory.
Higher energy prices coming up from low levels boosted the CPI. But the trend is still soft. Overall consumer price inflation rose 0.2 percent after rebounding 0.2 percent in February. The March figure equaled analysts' forecast for a 0.2 percent gain. Energy increased 1.1 percent after gaining 1.0 percent in February. Gasoline prices increased 3.9 percent after rebounding 2.4 percent in February after plummeting 18.7 percent in January, Food slipped 0.2 percent after rising 0.2 percent in February. Excluding food and energy, consumer price inflation posted at a 0.2 percent increase, following a 0.2 percent rise for February. Analysts forecast a 0.1 percent gain.
 Within the core, along with the shelter index, a broad array of indexes rose in March, including medical care, used cars and trucks, apparel, new vehicles, household furnishings and operations, and recreation. The index for airline fares, in contrast, declined for the fourth time in the last 5 months. Within the core, along with the shelter index, a broad array of indexes rose in March, including medical care, used cars and trucks, apparel, new vehicles, household furnishings and operations, and recreation. The index for airline fares, in contrast, declined for the fourth time in the last 5 months.
On a seasonally adjusted basis, the headline CPI was essentially unchanged after being down 0.1 percent in February on a year-ago basis. Excluding food and energy, the year-ago rate was 1.8 percent versus 1.7 percent February. Essentially, the trend in inflation is still sluggish and will allow the Fed to not hurry rate increases.
 Further upstream for inflation, numbers have been anemic on average. Further upstream for inflation, numbers have been anemic on average.
 The PPI for total final demand rose 0.2 percent in March after falling 0.5 percent in February. Energy jumped 1.5 percent after being flat in February. Foods decreased 0.8 percent after a 1.6 percent decrease in February. Excluding food and energy, producer price inflation partially rebounded 0.2 percent after falling 0.5 percent the month before. Total excluding food, energy and trade services rose 0.2 percent after no change in February The PPI for total final demand rose 0.2 percent in March after falling 0.5 percent in February. Energy jumped 1.5 percent after being flat in February. Foods decreased 0.8 percent after a 1.6 percent decrease in February. Excluding food and energy, producer price inflation partially rebounded 0.2 percent after falling 0.5 percent the month before. Total excluding food, energy and trade services rose 0.2 percent after no change in February
Final demand for goods rebounded 0.3 percent after a drop of 0.4 in February. The index for final demand services edged up 0.1 percent in March after falling 0.5 percent in February.
On a seasonally adjusted year-ago basis, PPI final demand was down 0.8 percent after being down 0.7 percent, in February. Excluding food & energy, the PPI final demand posted at up 0.9 percent after being up 1.0 percent the month before. Excluding food, energy, and trade services PPI inflation came in at 0.8 percent after posting at 0.7 percent in February.
Inflation at the producer level remains extremely low. The latest numbers will let the Fed stay loose for a while.
The latest Beige Book reported five of 12 Districts expanding moderately. The report partly focused on labor markets, noting they are either stable or improving modestly. Most Districts reported higher retail sales-likely due to improved weather. Auto sales rose in most Districts. Similarly, real estate activity was seen as improved somewhat in most Districts.
Demand for manufactured products was mixed during the current reporting period. Weakening activity was attributed in part to the strong dollar, falling oil prices, and the harsh winter weather. Business service firms saw rising activity, especially for high-tech services, and they expect positive near-term growth.
Districts generally reported stable or modestly increasing overall price levels.
Overall, the Beige Book is modestly positive but still sluggish, suggesting no rush for a rate hike.
 Growth is tepid for the index of leading economic indicators, up only 0.2 percent in March following a downwardly revised gain of only 0.1 percent in February. The leading strength for March, the jobless claims component, may already be evaporating this month. The next biggest positive is the rate spread reflecting what is still the Fed's near zero-rate policy. The most convincing plus is consumer expectations which, based on the gain for the mid-month consumer sentiment index, looks to be a positive for April as well. Growth is tepid for the index of leading economic indicators, up only 0.2 percent in March following a downwardly revised gain of only 0.1 percent in February. The leading strength for March, the jobless claims component, may already be evaporating this month. The next biggest positive is the rate spread reflecting what is still the Fed's near zero-rate policy. The most convincing plus is consumer expectations which, based on the gain for the mid-month consumer sentiment index, looks to be a positive for April as well.
In the negative column are building permits which, Thursday's disappointing housing starts report, fell sharply. This is a reminder that housing, despite some hopeful signs, has yet to boost economic growth. And declines in the factory workweek and for factory orders are reminders that the manufacturing sector, due in part to weak exports, may now be pulling down economic growth.
Other readings include a paltry 0.1 percent gain for the coincident index which confirms ongoing weakness in economic growth and a 0.4 percent gain in the lagging index that highlights prior strength in economic growth.
In sum, this report is definitely soft and will not move expectations forward for a Fed rate hike.
The only really healthy sector is the consumer sector. Other indicators point to soft growth in the near term. And inflation numbers have on average been sluggish. The Fed likely will be slow to raise policy rates.
The highlights this week focus on housing and manufacturing. Housing starts last week were very soft. Data on existing home sales, new home sales, and FHFA home prices will indicate if there is improvement. Manufacturing has been hit by a strong dollar and slow growth abroad. This week's update on the sector will come from durables orders.
The Chicago Fed National Activity Index shows that the economy has indeed gotten off to a slow start this year, confirmed by the national activity index which came in at minus 0.11 in February vs minus 0.10 in January. The 3-month average is in negative ground, at minus 0.08 in February vs plus 0.26 in January. The weakest component in February was for personal consumption & housing, at minus 0.17. The component for production-related indicators, at minus 0.07, is the second weakest. These readings offer tangible confirmation that both housing and manufacturing are pulling down economic growth.
Chicago Fed National Activity Index Consensus Forecast for March 15: 0.15
Range: -0.26 to 0.20
Housing is still sluggish. The FHFA purchase only house price index continued to rise in January but at a slower pace. FHFA house prices advanced 0.3 percent, following a gain of 0.7 percent in December. The year-ago rate came in at 5.1 percent, compared to 5.4 percent in December. Adverse weather may be the reason for softening in price growth.
FHFA purchase only house price index Consensus Forecast for February 15: +0.6 percent
Range: +0.4 to +0.6 percent
Existing home sales bounced 1.2 percent higher in February to a 4.88 million annual pace which was above January's 4.82 million but still was not that strong. The year, in fact, opened with the two weakest months for existing home sales since April last year. The year-on-year rate, however, was showing moderate strength, at plus 4.7 percent in February for the strongest reading since October 2013. Supply was still limiting sales. Existing homes on the market were still on the scarce side, at 4.6 months of supply and unchanged from January. A year ago, the rate was 4.9 months.
Existing home sales Consensus Forecast for March 15: 5.045 million-unit rate
Range: 4.850 to 5.200 million-unit rate
Initial jobless claims rose 12,000 in the April 11 week to 294,000 vs a revised 282,000 in the prior week. But the 4-week average was little changed, up only fractionally to 282,750 which is nearly 25,000 below the month-ago comparison.
Jobless Claims Consensus Forecast for 4/18/14: 286,000
Range: 280,000 to 305,000
The Markit PMI manufacturing index (final) for March showed rising production and rising orders giving a lift to Markit's manufacturing PMI, to a 5-month high of 55.7 for final March vs 55.3 at mid-month and 55.1 in final February. The strength in production, underpinned by a rise in backlog orders, is giving a lift to employment. On the negative side were export orders underscoring the FOMC's concerns over weak foreign demand and the negative effects of the strong dollar. Inflation readings were very low, at a nearly 6-year low for inputs and a 10-month low for finished goods.
Markit PMI manufacturing flash index Consensus Forecast for April 15: 56.0
Range: 55.5 to 56.4
New home sales picked up sharply in February to a 539,000 annual rate. Adding to the good news was a big upward revision to January, to 500,000 from 481,000. These were the first two 500,000 readings going all the way back to April and May of 2008. The gain drew down what was already thin supply on the market, to 4.7 months at the current sales rate versus 5.1 and 5.3 months in the prior two reports. The February reading was the lowest since June 2013 and will undoubtedly encourage builders to expand construction.
New home sales Consensus Forecast for March 14: 518 thousand-unit annual rate
Range: 470 thousand to 569 thousand-unit annual rate
Durable goods orders fell 1.4 percent in February after rebounding 1.9 percent the month before. Excluding transportation, the core declined 0.8 percent, following a 1.0 percent drop in January. Transportation dropped 3.3 percent, following a monthly rebound of 8.9 percent the prior month. Outside of the core, orders were mixed. Industries that advanced were primary metals and electrical equipment. Declines were seen in fabricated metals, machinery, computers & electronics, and "other."
Numbers reflect revisions from the more recent total factory orders report.
New orders for durable goods Consensus Forecast for March 15: +0.5 percent
Range: -1.0 percent to +1.7 percent
New orders for durable goods, ex-trans., Consensus Forecast for March 15: +0.3 percent
Range: -0.6 percent to +1.0 percent
R. Mark Rogers can be found on a weekly broadcast talking about the U.S. economy, the easiest way to find him is by going to iTunes and searching for "Simply Economics."
Econoday Senior Writer Mark Pender contributed to this article.
|
