|
This past week housing data were mixed but corporate earnings bumped up equities.
 Equities gained sharply Monday on China's steps to stimulate its slowing economy and on better-than-expected earnings. Tuesday, U.S. stocks were mostly lower as major companies reported a mixed batch of earnings results. Equities gained sharply Monday on China's steps to stimulate its slowing economy and on better-than-expected earnings. Tuesday, U.S. stocks were mostly lower as major companies reported a mixed batch of earnings results.
At mid-week, U.S. stocks closed higher on better-than-expected earnings and a positive report on existing-homes sales.
 U.S. stocks hit records on Thursday which saw the Nasdaq Composite close at its highest level ever as the S&P 500 came close a record close. Stocks advanced despite mixed earnings reports from General Motors, Proctor & Gamble and others. Several export-heavy companies reported their results Thursday. All of them said the strong US dollar hurt results. Friday, better-than-expected earnings sent the Nasdaq Composite and S&P 500 to finish at all-time highs. U.S. stocks hit records on Thursday which saw the Nasdaq Composite close at its highest level ever as the S&P 500 came close a record close. Stocks advanced despite mixed earnings reports from General Motors, Proctor & Gamble and others. Several export-heavy companies reported their results Thursday. All of them said the strong US dollar hurt results. Friday, better-than-expected earnings sent the Nasdaq Composite and S&P 500 to finish at all-time highs.
Equities were up this past week. The Dow was up 1.4 percent; the S&P 500, up 1.8 percent; the Nasdaq, up 3.2 percent; the Russell 2000, up 1.3 percent; and the Wilshire 5000, up 1.7 percent.
For the year-to-date, major indexes are up as follows: the Dow, up 1.4 percent; the S&P 500, up 2.9 percent; the Nasdaq, up 7.5 percent; the Russell 2000, up 5.2 percent; and the Wilshire 5000, up 3.5 percent.
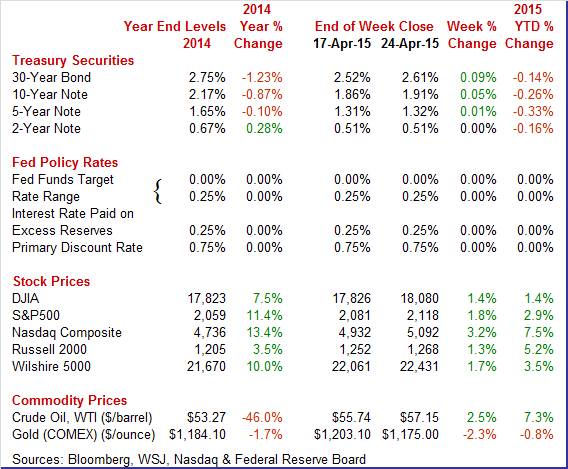
Weekly percent change column reflects percent changes for all components except interest rates. Interest rate changes are reflected in simple differences.
 Rates firmed this past week. Rates firmed this past week.
On Monday, rates bumped up after the People's Bank of China announced on Sunday it would cut the reserve requirement ratio for banks by the most since December 2008. This eased flight to safety. Yields firmed a bit Tuesday on signs of progress in Greek debt negotiations.
Yields jumped Wednesday as haven demand fell essentially worldwide. Also, existing home sales posted notably stronger-than-expected. However, on Thursday rates eased slightly after data on manufacturing in China and Germany softened. Rates dropped Friday on unexpected weakness in nondefense capital goods in the durables orders report.
For this past week Treasury rates were up as follows: 3-month T-bill, up 1 basis point; the 5-year note, up 1 basis point; the 7-year note, up 3 basis points; the 10-year note, up 5 basis points; and the 30-year bond, up 9 basis points.
The 2-year note was unchanged.
 The spot price of West Texas Intermediate rose moderately for the past week. The spot price of West Texas Intermediate rose moderately for the past week.
The only notable daily swing was Thursday with a gain over a dollar a barrel. Oil futures rallied Thursday, with WTI settling at its highest level of the year as traders worried over potential supply disruptions in the Middle East and as weak data from China raised prospects for economic stimulus.
Net for the week, the spot price for West Texas Intermediate increased $1.41 per barrel to settle at $57.15.
The housing sector was the focus this week with data being mixed.
Weather is playing havoc with housing data but most recently on the positive side for existing home sales.
 This winter's heavy weather may very well have held down the housing market which appears to be heading into the spring with new momentum. Existing home sales surged 6.1 percent in March to a 5.190 million annual rate. This is near high-end expectations and the best rate since September 2013. In percentage terms, the 6.1 percent gain is the strongest since December 2010 and among the very highest in the 16-year history of the series. This winter's heavy weather may very well have held down the housing market which appears to be heading into the spring with new momentum. Existing home sales surged 6.1 percent in March to a 5.190 million annual rate. This is near high-end expectations and the best rate since September 2013. In percentage terms, the 6.1 percent gain is the strongest since December 2010 and among the very highest in the 16-year history of the series.
Sales of single-family homes jumped 5.5 percent in the month to a 4.590 million rate while condos really jumped, up 11.1 percent to a 600,000 rate. All regions show solid gains in total sales led by the Midwest at 10.1 percent with the South at the rear, though still up a solid 3.8 percent.
More homes did enter the market in March, to 2.0 million vs 1.9 million in February, but inventory relative to sales still remains tight, at 4.6 months vs 4.7 months in the prior month.
Despite the gain in existing home sales, homebuilders are not likely optimistic based on the latest sales numbers.
 New home sales in March fell a very steep 11.4 percent to a 481,000 annual rate. New home sales in March fell a very steep 11.4 percent to a 481,000 annual rate.
The bulk of the decline came in the largest region, the South, where sales fell 15.8 percent. The drop here does follow a 9.3 percent gain in the prior month but the latest result is not good news for the region's builders. Also contributing to the decline was the Northeast, but sales in this region are very small, as well as the West, a much larger region where sales were down 3.4 percent. Sales in the Midwest rose 5.9 percent in the month.
More new homes actually came onto the market in March, up 4,000 to 213,000 nationwide, but supply relative to sales rose sharply because of the drop in sales, to 5.3 months from 4.6 months. This reading, however, is still pretty thin and won't scale back builder plans.
 House prices picked up in February. FHFA house prices gained 0.7 percent in February, compared to 0.3 percent in January. The year-ago rate came in at 5.4 percent, compared to 5.1 percent the month before. House prices picked up in February. FHFA house prices gained 0.7 percent in February, compared to 0.3 percent in January. The year-ago rate came in at 5.4 percent, compared to 5.1 percent the month before.
Regionally, eight Census regions reported gains in February while one declined.
Home prices have rebounded but it "may" be weather related. It will take one or two months to determine the normal trend.
Overall, the manufacturing sector remains soft.
 Manufacturing is on a dual track—transportation up and non-transportation soft. Durables orders rebounded 4.0 percent in March after falling 1.4 percent in February. Excluding transportation, the core dipped 0.2 percent, following a decline of 1.3 percent in February. Transportation spiked 13.5 percent after a 1.8 percent dip in February. All major transportation subcomponents gained. But the core was soft. Manufacturing is on a dual track—transportation up and non-transportation soft. Durables orders rebounded 4.0 percent in March after falling 1.4 percent in February. Excluding transportation, the core dipped 0.2 percent, following a decline of 1.3 percent in February. Transportation spiked 13.5 percent after a 1.8 percent dip in February. All major transportation subcomponents gained. But the core was soft.
Within the core, orders were almost all down. The only major industry that gained was computers & electronics. Declines were seen in primary metals, fabricated metals, machinery, electrical equipment, and "other."
Nondefense capital goods orders excluding aircraft were down 0.5 percent, following a 2.2 percent dip in February. This suggests that businesses are being reluctant to invest in equipment and that business equipment investment will be soft in coming quarters. Shipments of this series declined 0.4 percent in March after slipping 0.1 percent the month before. This likely will cut into first quarter GDP growth estimates.
The manufacturing sector continues to be weak outside of transportation. This is another indicator that points to a soft first quarter and continued Fed ease. The Fed likely will continue to see the manufacturing sector as soft and not be in a hurry to raise rates.
Early indications on this month's manufacturing activity are not encouraging including a 54.2 reading for the PMI flash where details are weak. And it's been weakness in export demand, the result of soft foreign economies and strength in the dollar, that has been hurting the sector. New export orders show their first decline in this report since November 2014. New orders overall are growing at their softest rate since January.
Production is also slowing, showing its softest growth rate since December.
Last week's Empire State and Philly Fed reports were similarly soft, showing better readings at the headline level but weakness in orders tied to exports. The manufacturing sector is having a rough year so far and has not been contributing to the nation's economic growth.
Housing is mixed but even favorable numbers are coming off low levels. Manufacturing clearly is soft.
There is a broad range of news this week. The highlight might be the Wednesday FOMC announcement with traders focusing on characterization of the economy and possible changes in guidance. Housing has been sluggish and we get updates on Case-Shiller home prices and also pending home sales. The consumer sector has been leading the economy and this week's updates are personal income and consumer confidence.
The Markit PMI services index indicates that the service sector is increasingly the key to U.S. economic health. And right now conditions look very solid with the PMI services index jumping to 59.2 in final March, up more than 1/2 point from the March flash reading and up more than 2 points from the final reading for February. The final reading for March is the strongest since August last year. New orders, backlog orders, business activity and employment are all accelerating with inflation readings remaining dormant.
Markit PMI services index (flash) Consensus Forecast for April 15: 59.5
Range: 58.0 to 60.4
The Dallas Fed general business activity index in its Texas manufacturing survey declined in March. The production index, a key measure of state manufacturing conditions, fell to minus 5.2, posting its first negative reading in nearly two years.
Other measures of current manufacturing activity also reflected contraction in March. The new orders index pushed further into negative territory, coming in at minus 16.1, and the growth rate of orders index remained negative for a fifth consecutive month but edged up to minus 15.3 in March. The shipments and capacity utilization indexes slipped to more negative readings, minus 8.7 and minus 6.4, respectively.
Perceptions of broader business conditions were rather pessimistic for a third month in a row. The general business activity index declined 6 points to minus 17.4 in March, while the company outlook index was largely unchanged at minus 4.
Dallas Fed general business activity index Consensus Forecast for April 15: -12.0
Range: -13.0 to -10.0
FOMC meeting begins
The S&P/Case-Shiller 20-city home price index (SA) rose 0.9 percent in January following a 0.9 percent gain in December and a 0.8 percent rise in November. This is the strongest streak for this report since late 2013. Year-on-year, however, prices are still on the soft side, up only 4.6 percent in January and only fractionally higher than the prior two months.
The S&P/Case-Shiller 20-city HPI (SA, m/m) Consensus Forecast for February 15: +0.7 percent
Range: +0.6 to +1.0 percent
The S&P/Case-Shiller 20-city HPI (NSA, m/m) Consensus Forecast for February 15: +0.2 percent
Range: +0.1 to +0.2 percent
The S&P/Case-Shiller 20-city HPI (NSA, y/y) Consensus Forecast for February 15: +4.8 percent
Range: +4.5 to +5.0 percent
The Conference Board's consumer confidence index jumped to 101.3 in March from an upwardly revised 98.8 in February. March's reading is close to January's 7-1/2 year high of 103.8. March's gain was centered entirely in the expectations component which was up 6.0 points to 96.0. This is the best reading for this component since February 2011 and reflects expected gains in income and the jobs market. A negative, however, was the present situation component which fell 3.0 points to 109.1. Weakness here reflects a slight rise in the jobs-hard-to-get reading, which is a marginally negative indication for Friday's March employment report, and also a rise in those describing current business conditions as bad. Still, those describing conditions as bad, at 19.4 percent, are well outnumbered by those describing conditions as good, at 26.7 percent.
Consumer confidence Consensus Forecast for April 15: 103.0
Range: 100.5 to 104.0
The Richmond Fed manufacturing index in March fell into contraction, to minus 8 vs zero in February. Order readings, both for new orders and backlogs, were down substantially as were shipments and the workweek. Hiring, however, remained respectable, at least for now. Price readings showed only the most marginal pressure.
Richmond Fed manufacturing index Consensus Forecast for April 15: -2
Range: -3 to 2
GDP third estimate for fourth quarter growth was unrevised overall. The economy grew 2.2 percent in the fourth quarter compared to the second estimate of 2.2 percent and the advance estimate of 2.6 percent. Final sales of domestic product were nudged up to 2.3 percent from the second estimate of 2.1 percent. Final sales to domestic purchasers were revised up to 3.3 percent from 3.2 percent. On the price front, the chain-weighted price index was unrevised at 0.1 percent annualized. The core chain index, excluding food and energy, was unrevised from the second estimate of 0.7 percent.
Real GDP Consensus Forecast for advance estimate Q1 15: +1.0 percent annual rate
Range: +0.2 to +2.4 percent annual rate
GDP price index Consensus Forecast for advance estimate Q1 15: +0.5 percent annual rate
Range: -1.5 to +0.8 percent annual rate
The pending home sales index picked up steam in February, up a much stronger-than-expected 3.1 percent on top of a 1.2 percent revised gain in January. This is the first back-to-back gain since April and May last year. Today's report is a second shot in the arm for the ever-lagging housing sector, following last week's big surge in new homes sales. Year-on-year, pending home sales, which are defined as contract signings for existing homes, are up a robust-looking 12.0 percent which is a 6th straight increase. But this is misleading as many deals fall through. Final sales of existing homes, in data posted last week, are up only 4.7 percent year-on-year.
Pending home sales Consensus Forecast for March 15: +1.0 percent
Range: -1.4 to +3.5 percent
The FOMC announcement at 2:00 p.m. ET for the April 28-29 FOMC policy meeting is expected to leave policy rates unchanged with fed funds still at a range of zero to 0.25 percent. FOMC participants are likely to focus on recently soft economic data.
FOMC Consensus Forecast for 4/29/15 policy vote on fed funds target range: unchanged at a range of zero to 0.25 percent
Initial jobless claims were little changed in the April 18 week, up 1,000 to 295,000, but the comparison of the 4-week average, at 284,500, with the 4-week average one month ago showed an improvement of more than 20,000. This comparison matches the sampling weeks for the March and April employment reports. Continuing claims, where reporting lags by a week, were also pointing to improvement. Continuing claims for the April 11 week did rise 50,000 to 2.325 million but the 4-week average is down 22,000 to a new 15-year low of 2.309 million. This reading was down a very convincing 99,000 from the month ago comparison.
Jobless Claims Consensus Forecast for 4/25/14: 288,000
Range: 228,000 to 295,000
Personal income in February advanced 0.4 percent after posting an equal gain of 0.4 percent in January. The wages & salaries component increased 0.3 percent, but followed a robust 0.6 percent the prior month. Personal spending made a partial rebound of 0.1 percent after declining 0.2 percent in January. Prices at the headline level rebounded a moderate 0.2 percent, following three declines including 0.4 percent for January. The core PCE price index rose 0.1 percent, matching the pace in January.
Personal income Consensus Forecast for March 15: +0.2 percent
Range: 0.0 to +0.4 percent
Personal consumption expenditures Consensus Forecast for March 15: +0.5 percent
Range: +0.3 to +0.6 percent
PCE price index Consensus Forecast for March 15: +0.2 percent
Range: +0.2 to +0.3 percent
Core PCE price index Consensus Forecast for March 15: +0.2 percent
Range: +0.1 to +0.2 percent
The Kansas City Fed manufacturing index was minus 4 in March, down from plus 1 in February and 3 in January. Other month-over-month indexes decreased from the previous month. The production and shipments indexes fell after rising last month, and the new orders and order backlog indexes dropped to their lowest levels in over two years. In contrast, the employment and new orders for exports indexes inched higher but remained negative. The finished goods inventory index eased from 3 to minus 2, and the raw materials inventory index also moved into negative territory.
Kansas City Fed manufacturing index Consensus Forecast for April 15: -2
Range: -2 to 0
The employment cost index held at a high rate in the third quarter, at a quarter-to-quarter plus 0.6 percent but down 1 tick from 0.7 percent gains in the prior two quarters. Year-on-year, the fourth-quarter rate held at the third-quarter rate of plus 2.2 percent. Pressure in recent quarters has been about evenly split between the wages & salaries component and the benefits components, up 0.5 percent and 0.6 percent respectively in the latest quarter. Year-on-year, however, benefits are higher at plus 2.6 percent, which matches second-quarter last year as a recent high, vs plus 2.1 percent for wages & salaries.
Employment cost index Consensus Forecast for Q1 15: +0.6 percent
Range: +0.5 to +1.4 percent
The Chicago PMI posted at a sub-50 March index of 46.3 following 45.8 in February. On a quarterly basis, the index averaged only 50.5 in the first quarter, down steeply from 61.3 in the fourth quarter for the weakest reading since the third quarter of 2009. Respondents are citing bad weather and fallout from the West Coast port slowdown as temporary negatives, and they see orders picking up during the second quarter. Though the Chicago report, which covers both the manufacturing and non-manufacturing sectors, is often volatile, the last two months of sub-50 readings do confirm other indications of first-quarter weakness for the nation's economy as a whole.
Chicago PMI Consensus Forecast for April 15: 50.0
Range: 45.1 to 52.0
The Kansas City Fed manufacturing index declined in March, and producers' expectations moderated somewhat but remained slightly positive. Most price indexes continued to decrease, with several reaching their lowest level since 2009. In a special question about the West Coast port disruptions, 32 percent of firms said it had affected them negatively. The month-over-month composite index was minus 4 in March, down from plus 1 in February and 3 in January . The composite index is an average of the production, new orders, employment, supplier delivery time, and raw materials inventory indexes. The overall slower growth was mostly attributable to declines in plastics, food, and chemical production and continued weakness in metals and machinery. Looking across District states, the largest decline was in Oklahoma, with moderate slowdowns in Kansas and Nebraska.
Kansas City Fed manufacturing index Consensus Forecast for April 15: -2
Range: -2 to 0
Sales of total light motor vehicles popped up strongly in March, up 6.2 percent to an annual rate of 17.2 million units. This is the strongest rate since November and points to a badly needed gain for the motor vehicle component of the monthly retail sales report which has declined in 2 of the last 3 reports and was down very sharply in February. The gain is evenly distributed between North American-made vehicles and foreign-made vehicles and between cars and light trucks. Today's data are the first hard sales data for the month of March and suggest that consumers, enjoying a strong jobs market, may finally be spending more.
Motor vehicle domestic sales Consensus Forecast for April 15: 13.3 million-unit rate
Range: 13.2 to 16.8 million-unit rate
Motor vehicle total sales Consensus Forecast for April 15: 16.9 million-unit rate
Range: 16.7 to 17.1 million-unit rate
The Markit PMI manufacturing flash index for April was not encouraging including a 54.2 reading where details are weak. And it's been weakness in export demand, the result of soft foreign economies and strength in the dollar that has been hurting the sector. New export orders showed their first decline in this report since November 2014. New orders overall were growing at their softest rate since January. Production is also slowing, showing its softest growth rate since December.
Markit PMI manufacturing index (final) Consensus Forecast for Apr. 15: 54.5
Range: 54.0 to 56.0
The composite index from the ISM manufacturing survey for March fell 1.4 points to 51.5. This is below what was a soft consensus forecast of 52.5 and is the lowest reading since May 2013. New orders fell 7 tenths to 51.8 for its lowest reading since April 2013. New export orders are in contraction for a 3rd straight month, down 1.0 point to 47.5 for their lowest reading since November 2012.
ISM manufacturing composite index Consensus Forecast for April 15: 52.0
Range: 50.0 to 53.0
The University of Michigan's consumer sentiment index remains very strong, at 95.9 for the mid-month April reading vs a final March reading of 93.0 and well up from 91.2 at mid-month March. The index hit an 8-year high of 98.1 in January. A solid gain in the current conditions component to 108.2 vs a final March reading of 105.0 hints at strength this month for consumer activity, perhaps even for retail sales. The expectations component is at 88.0, up from 85.3 and pointing to rising confidence in the jobs outlook.
Consumer sentiment Consensus Forecast for final April 15: 96.0
Range: 95.0 to 96.4
Construction spending unexpectedly dipped 0.1 percent in February after falling 1.7 percent in January. Market expectations were for a 0.2 percent increase. February's decrease was led by public outlays which dropped 0.8 percent. Private nonresidential construction spending rebounded 0.5 percent. Private residential spending slipped 0.2 percent. On a year-ago basis, total outlays were up 2.1 percent in February compared to 1.4 percent in January. Adverse weather may be still affecting construction data.
Construction spending Consensus Forecast for March 15: +0.4 percent
Range: -0.6 to +1.8 percent
R. Mark Rogers can be found on a weekly broadcast talking about the U.S. economy, the easiest way to find him is by going to iTunes and searching for "Simply Economics."
Econoday Senior Writer Mark Pender contributed to this article.
|
