|
'Markets gyrated' sums up trading activity last week with Asian stocks hit the hardest on China's Shanghai Composite sell-off. Analysts pointed to nothing in particular that triggered the mid-week equity retreat. Certainly the weak data from China played a key role both in the drop in stock prices and the subsequent rally Friday on the prospect of new stimulus to stir the Chinese economy. U.S. and European equity markets rallied Friday on the UK election results and U.S. employment data that showed employers were hiring at a steady pace. Employment added 223,000 jobs in April while the unemployment rate slipped to 5.4 percent from 5.5 percent in March.
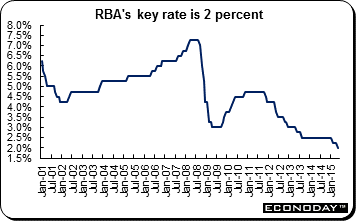 Another key event in the Asia Pacific was the Reserve Bank of Australia's monetary policy meeting Tuesday. As expected the RBA cut its policy cash rate by 25 basis points to a record low of 2 percent. The RBA last lowered its interest rate to 2.25 percent in a surprise move in February 2015. In his statement, Governor Glenn Stevens said that the inflation outlook provided the opportunity to ease further "so as to reinforce recent encouraging trends in household demand." Recently released inflation data for the first three months of this year came in marginally ahead of expectations, with the core measure rising 2.3 percent from the same quarter a year ago and at the low end of the RBA's inflation target range of 2 percent to 3 percent. Another key event in the Asia Pacific was the Reserve Bank of Australia's monetary policy meeting Tuesday. As expected the RBA cut its policy cash rate by 25 basis points to a record low of 2 percent. The RBA last lowered its interest rate to 2.25 percent in a surprise move in February 2015. In his statement, Governor Glenn Stevens said that the inflation outlook provided the opportunity to ease further "so as to reinforce recent encouraging trends in household demand." Recently released inflation data for the first three months of this year came in marginally ahead of expectations, with the core measure rising 2.3 percent from the same quarter a year ago and at the low end of the RBA's inflation target range of 2 percent to 3 percent.
Stevens noted that the Australian dollar had declined noticeably against a rising US dollar over the past year, though less so against a basket of currencies. Further depreciation seems both likely and necessary, particularly given the significant declines in key commodity prices. Financial conditions remain accommodative globally with some major central banks stepping up the pace of unconventional policy measures even though the Federal Reserve is expected to start increasing its policy rate later this year. However, the statement omitted a mention that further action could prove necessary.
Later in the week, the RBA published its quarterly Statement on Monetary Policy. The Bank trimmed its growth and inflation forecasts for the Australian economy, and reintroduced language saying it is assessing the outlook and will adjust policy as needed. The phrase was absent in both the February Statement and the Bank's interest rate decision on May 6. As a result of removing this "forward guidance", the Bank gave markets the impression the easing cycle was over and pushed the Australian dollar above US$0.80 as a result — not the outcome the RBA would have been looking for.
Growth to December 2015 is forecast at 2.5 percent compared to 2.75 percent in the February Statement and forecast growth to December 2016 was lowered from 3.5 percent to 3.25 percent. The Bank has also decided to lower its inflation forecasts. It retained its 2.5 percent forecast for underlying inflation in 2015 but lowered the 2016 forecast from 2.5 percent to 2.25 percent.
|
|
2014 |
2015 |
% Change |
|
Index |
Dec 31 |
May 1 |
May 8 |
Week |
2015 |
| Asia/Pacific |
|
|
|
|
|
|
| Australia |
All Ordinaries |
5388.6 |
5798.8 |
5635.4 |
-2.8% |
4.6% |
| Japan |
Nikkei 225 |
17450.8 |
19531.6 |
19379.2 |
-0.8% |
11.1% |
| Hong Kong |
Hang Seng |
23605.0 |
28133.0 |
27577.3 |
-2.0% |
16.8% |
| S. Korea |
Kospi |
1915.6 |
2127.2 |
2085.5 |
-2.0% |
8.9% |
| Singapore |
STI |
3365.2 |
3487.4 |
3452.0 |
-1.0% |
2.6% |
| China |
Shanghai Composite |
3234.7 |
4441.7 |
4205.9 |
-5.3% |
30.0% |
|
|
|
|
|
|
|
| India |
Sensex 30 |
27499.4 |
27011.3 |
27105.4 |
0.3% |
-1.4% |
| Indonesia |
Jakarta Composite |
5227.0 |
5086.4 |
5182.2 |
1.9% |
-0.9% |
| Malaysia |
KLCI |
1761.3 |
1818.3 |
1807.7 |
-0.6% |
2.6% |
| Philippines |
PSEi |
7230.6 |
7714.8 |
7763.21 |
0.6% |
7.4% |
| Taiwan |
Taiex |
9307.3 |
9820.1 |
9692.0 |
-1.3% |
4.1% |
| Thailand |
SET |
1497.7 |
1526.7 |
1510.5 |
-1.1% |
0.9% |
|
|
|
|
|
|
|
| Europe |
|
|
|
|
|
|
| UK |
FTSE 100 |
6566.1 |
6986.0 |
7046.8 |
0.9% |
7.3% |
| France |
CAC |
4272.8 |
5046.5 |
5090.4 |
0.9% |
19.1% |
| Germany |
XETRA DAX |
9805.6 |
11454.4 |
11709.7 |
2.2% |
19.4% |
| Italy |
FTSE MIB |
19012.0 |
23045.5 |
23312.4 |
1.2% |
22.6% |
| Spain |
IBEX 35 |
10279.5 |
11385.0 |
11424.7 |
0.3% |
11.1% |
| Sweden |
OMX Stockholm 30 |
1464.6 |
1628.0 |
1616.5 |
-0.7% |
10.4% |
| Switzerland |
SMI |
8983.4 |
9077.1 |
9093.3 |
0.2% |
1.2% |
|
|
|
|
|
|
|
| North America |
|
|
|
|
|
|
| United States |
Dow |
17823.1 |
18024.1 |
18191.1 |
0.9% |
2.1% |
|
NASDAQ |
4736.1 |
5005.4 |
5003.6 |
0.0% |
5.6% |
|
S&P 500 |
2058.9 |
2108.3 |
2116.1 |
0.4% |
2.8% |
| Canada |
S&P/TSX Comp. |
14632.4 |
15339.8 |
15170.0 |
-1.1% |
3.7% |
| Mexico |
Bolsa |
43145.7 |
44582.4 |
45126.0 |
1.2% |
4.6% |
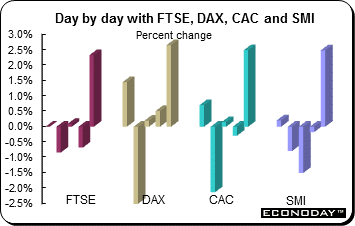 Trading was volatile last week as investors nervously waited for the outcome of Britain's national election that was held Thursday. If polls were to believed, the country was headed for a deadlock. The polls were wrong and the Conservative Party led by Prime Minister David Cameron unexpectedly won the general election. With results of all seats in the 650-member House of Commons declared, the ruling party won 330 seats, four seats more than the absolute majority threshold. The FTSE surged Friday on the news as did European stock indexes. On the week, the FTSE and CAC gained 0.9 percent, the DAX added 2.2 percent and the SMI edged up 0.2 percent. Trading was volatile last week as investors nervously waited for the outcome of Britain's national election that was held Thursday. If polls were to believed, the country was headed for a deadlock. The polls were wrong and the Conservative Party led by Prime Minister David Cameron unexpectedly won the general election. With results of all seats in the 650-member House of Commons declared, the ruling party won 330 seats, four seats more than the absolute majority threshold. The FTSE surged Friday on the news as did European stock indexes. On the week, the FTSE and CAC gained 0.9 percent, the DAX added 2.2 percent and the SMI edged up 0.2 percent.
Many investors had backed the Conservatives over the opposition, centre-left Labour Party which had promised tough regulation of industries such as banking, utilities, real estate and gambling which could have hit the profits of companies in those sectors. Analysts noted that Friday's gains stemmed from a relief rally. But the political uncertainty isn't going to go away. At some point PM Cameron could yet find himself having to turn elsewhere to ensure the safe passage of the government's controversial austerity legislation. There is also the issue of Scottish independence which, with the SNP essentially sweeping the board in Scotland (56 of 59 seats), will need to be addressed (again), and quickly. And the PM has already promised a referendum on EU membership before the end of 2017 and a backbench in-house rebellion in favor of exiting the Union will not be defeated easily. As the referendum draws closer, investor sentiment could be at the mercy of the opinion polls once again.
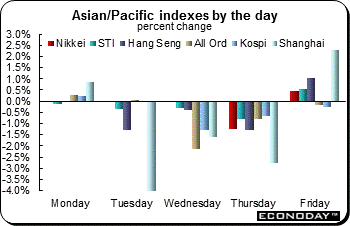 Most equity indexes retreated last week on global growth worries along with the ongoing situation in Greece. The turmoil in Chinese trading was the regional focus. However, after gaining a torrid 18.5 percent in April, the Shanghai Composite plunged over 8 percent in just three days. But gains on Monday and Friday left the index down 5.3 percent for the week. The Hang Seng retreated for six consecutive sessions only to rally Friday on bargain hunting. However, the index lost 2.0 percent on the week. Most equity indexes retreated last week on global growth worries along with the ongoing situation in Greece. The turmoil in Chinese trading was the regional focus. However, after gaining a torrid 18.5 percent in April, the Shanghai Composite plunged over 8 percent in just three days. But gains on Monday and Friday left the index down 5.3 percent for the week. The Hang Seng retreated for six consecutive sessions only to rally Friday on bargain hunting. However, the index lost 2.0 percent on the week.
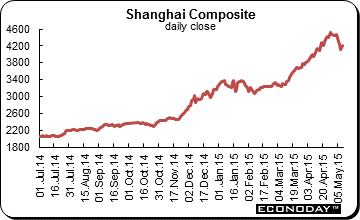 Friday's rally in China was spurred on by expectations of further economic stimulus measures to avert a sharper economic slowdown after a spate of weak data. China's exports and imports both tumbled in April, adding to recent signs of slower growth. While yuan-denominated exports unexpectedly fell 6.2 percent in April from a year earlier, imports fell by a bigger than expected 16.1 percent. The benchmark Shanghai Composite Index, though up 2.3 percent for the day, lost 5.3 percent for the week, its worst performance since May 2010. Most other stock markets in the region also crept higher to regain some of the losses from earlier in the week. Friday's rally in China was spurred on by expectations of further economic stimulus measures to avert a sharper economic slowdown after a spate of weak data. China's exports and imports both tumbled in April, adding to recent signs of slower growth. While yuan-denominated exports unexpectedly fell 6.2 percent in April from a year earlier, imports fell by a bigger than expected 16.1 percent. The benchmark Shanghai Composite Index, though up 2.3 percent for the day, lost 5.3 percent for the week, its worst performance since May 2010. Most other stock markets in the region also crept higher to regain some of the losses from earlier in the week.
Much of the focus this week has been on China's stock market where volatility isn't entirely unexpected. Many say the market was due for a cool down after doubling over the past 12 months and as more investors are looking to take profits. Also denting the market are growing concerns about a clampdown on margin trading. A slew of new share sales have also soaked up cash from the market.
Warning of a cloudy economic outlook, China's central bank said it does not need to buy bonds or securities to boost liquidity, that traditional policy tools will do the job. In its quarterly monetary policy report, the People's Bank of China (PBoC) said it had scope to use a variety of policy tools to adjust liquidity levels and growth in money supply. The PBoC's latest denial that it may buy securities to loosen policy came in the wake of market speculation that such a move was in the cards as the Chinese economy stutters. Policymakers will use "a variety" of tools to "maintain an appropriate level in liquidity and achieve reasonable growth in money supply, credit and social financing."
Japanese markets were open only two days last week. The Nikkei was down 0.8 percent from a week ago. The All Ordinaries slid 2.8 percent on the week and in the process hit a three month low, with sentiment hurt mainly by expectations that the Reserve Bank of Australia is approaching the end of its easing cycle.
The Indian markets rose sharply on Friday and the rupee also rebounded from a 20-month low hit the previous day as a three percent decline in oil prices overnight and an announcement by the Modi government that it would form a panel to resolve a tax dispute with foreign investors triggered heavy short covering in most beaten-down stocks. The Sensex was able to add 0.3 percent for the week.
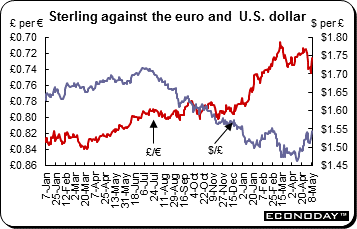 The U.S. dollar was down against most of its major counterparts including the yen, pound sterling, Swiss franc and the Canadian and Australian dollars. It advanced against the euro, however. On Wednesday, the dollar sell-off intensified, with the main gauge of the currency's strength falling to a three month low. A raft of weak U.S. economic data including an unexpected jump in the trade deficit cast fresh doubt over growth and pushed back expectations on when the Federal Reserve may start raising interest rates this year. The currency rallied Friday, however, after April employment data rebounded from March. The U.S. dollar was down against most of its major counterparts including the yen, pound sterling, Swiss franc and the Canadian and Australian dollars. It advanced against the euro, however. On Wednesday, the dollar sell-off intensified, with the main gauge of the currency's strength falling to a three month low. A raft of weak U.S. economic data including an unexpected jump in the trade deficit cast fresh doubt over growth and pushed back expectations on when the Federal Reserve may start raising interest rates this year. The currency rallied Friday, however, after April employment data rebounded from March.
The pound sterling rallied after the Conservatives won a majority. Unexpected gains for the Conservatives allayed pre-election market jitters, sparking a solid rebound in asset prices with the pound sterling experiencing its largest one day increase in five years against the U.S. dollar. Investors are — for now — playing down the challenge facing a new government about the role of the UK in Europe and the rise of the Scottish National Party.
During the week, Eurozone bonds sank and the euro strengthened, as a brutal reversal of market moves linked to the European Central Bank's stimulus program continued. The euro had slumped against the U.S. dollar during the first few months of the year, largely as a result of the ECB's aggressive stimulus measures coupled with expectations that the U.S. Federal Reserve was preparing to raise rates. The euro's weakness in 2015 has supported stocks in European exporters, propelling many indexes to record highs, but its rebound in recent days has weighed on equities.
|
|
2014 |
2015 |
% Change |
|
|
Dec 31 |
May 1 |
May 8 |
Week |
2015 |
| U.S. $ per currency |
|
|
|
|
|
|
| Australia |
A$ |
0.817 |
0.784 |
0.793 |
1.2% |
-2.9% |
| New Zealand |
NZ$ |
0.780 |
0.754 |
0.748 |
-0.7% |
-4.1% |
| Canada |
C$ |
0.861 |
0.822 |
0.827 |
0.6% |
-4.0% |
| Eurozone |
euro (€) |
1.210 |
1.122 |
1.121 |
-0.1% |
-7.3% |
| UK |
pound sterling (£) |
1.559 |
1.515 |
1.546 |
2.0% |
-0.8% |
|
|
|
|
|
|
|
| Currency per U.S. $ |
|
|
|
|
|
|
| China |
yuan |
6.206 |
6.203 |
6.209 |
-0.1% |
-0.1% |
| Hong Kong |
HK$* |
7.755 |
7.752 |
7.753 |
0.0% |
0.0% |
| India |
rupee |
63.044 |
63.423 |
63.938 |
-0.8% |
-1.4% |
| Japan |
yen |
119.820 |
120.150 |
119.740 |
0.3% |
0.1% |
| Malaysia |
ringgit |
3.497 |
3.574 |
3.599 |
-0.7% |
-2.8% |
| Singapore |
Singapore $ |
1.325 |
1.331 |
1.328 |
0.2% |
-0.3% |
| South Korea |
won |
1090.980 |
1077.450 |
1088.340 |
-1.0% |
0.2% |
| Taiwan |
Taiwan $ |
31.656 |
30.624 |
30.699 |
-0.2% |
3.1% |
| Thailand |
baht |
32.880 |
33.238 |
33.550 |
-0.9% |
-2.0% |
| Switzerland |
Swiss franc |
0.9942 |
0.932 |
0.931 |
0.1% |
6.7% |
| *Pegged to U.S. dollar |
|
|
|
|
|
|
| Source: Bloomberg |
|
|
|
|
|
|
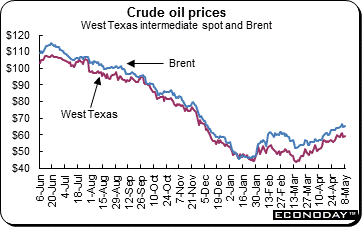 With oil prices rising, the pace at which energy companies are taking oil rigs offline slowed this week. The number of active rigs drilling for oil in the U.S. fell by 11 to 668 in the week to May 8, according to oilfield services company Baker Hughes. This was the 22nd straight weekly drop and brings the rig count to its lowest level since September 2010. The pace of declines was lower than last week, when 24 rigs were idled. Active oil rigs have declined nearly 57 percent since December in response to the drop in crude. Oil producers took 7 of the more efficient horizontal rigs offline, bringing the total to 692. On Wednesday, the Energy Information Administration said U.S. crude inventories fell for the first time since January. With oil prices rising, the pace at which energy companies are taking oil rigs offline slowed this week. The number of active rigs drilling for oil in the U.S. fell by 11 to 668 in the week to May 8, according to oilfield services company Baker Hughes. This was the 22nd straight weekly drop and brings the rig count to its lowest level since September 2010. The pace of declines was lower than last week, when 24 rigs were idled. Active oil rigs have declined nearly 57 percent since December in response to the drop in crude. Oil producers took 7 of the more efficient horizontal rigs offline, bringing the total to 692. On Wednesday, the Energy Information Administration said U.S. crude inventories fell for the first time since January.
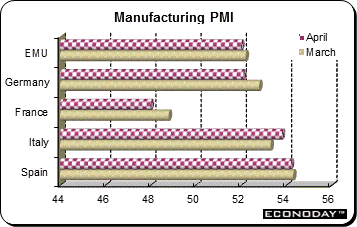 April final manufacturing PMI was 52.0, just 0.1 points above its flash estimate and 0.2 points below its final March result. Manufacturing production was up again but at a slightly slower rate than the 10-month high recorded in March while new orders were up for a fifth time in a row. Employment advanced for an eighth straight month and at its quickest pace since August 2011. Inflation developments were also more positive. Input costs increased for a second successive month after a 6-month sequence of declines while, more importantly, factory gate prices edged higher for the first time since August 2013. Regionally, the best performer was Ireland (national PMI 55.8) ahead of Spain (54.2) and the Netherlands (54.0). Italy (53.8) managed a 12-month high and remained above both Germany (52.1) and France (48.0), the latter once again the only member of the larger group of countries to post a sub-50 reading. Elsewhere, Greece (46.5) ominously dropped to a 22-month low. April final manufacturing PMI was 52.0, just 0.1 points above its flash estimate and 0.2 points below its final March result. Manufacturing production was up again but at a slightly slower rate than the 10-month high recorded in March while new orders were up for a fifth time in a row. Employment advanced for an eighth straight month and at its quickest pace since August 2011. Inflation developments were also more positive. Input costs increased for a second successive month after a 6-month sequence of declines while, more importantly, factory gate prices edged higher for the first time since August 2013. Regionally, the best performer was Ireland (national PMI 55.8) ahead of Spain (54.2) and the Netherlands (54.0). Italy (53.8) managed a 12-month high and remained above both Germany (52.1) and France (48.0), the latter once again the only member of the larger group of countries to post a sub-50 reading. Elsewhere, Greece (46.5) ominously dropped to a 22-month low.
 March retail sales declined a monthly 0.8 percent and were up only 1.6 percent on the year for their slowest rate since November. March's monthly slide was roughly evenly split between food, drink & tobacco (down 0.6 percent) and non-food, ex-auto fuel (down 0.8 percent). Fuel sales were 2.7 percent lower, compounding their 1.0 percent fall in mid-quarter. The headline decline was led by Germany where purchases were down 2.3 percent from their February mark but both France (down 0.3 percent) and Spain (down 0.2 percent) also had a poor month. The steepest drop was recorded in Portugal (down 3.5 percent) ahead of Slovenia (down 2.8 percent) while the best performer was Slovakia (1.1 percent) followed by Lithuania (0.8 percent). March retail sales declined a monthly 0.8 percent and were up only 1.6 percent on the year for their slowest rate since November. March's monthly slide was roughly evenly split between food, drink & tobacco (down 0.6 percent) and non-food, ex-auto fuel (down 0.8 percent). Fuel sales were 2.7 percent lower, compounding their 1.0 percent fall in mid-quarter. The headline decline was led by Germany where purchases were down 2.3 percent from their February mark but both France (down 0.3 percent) and Spain (down 0.2 percent) also had a poor month. The steepest drop was recorded in Portugal (down 3.5 percent) ahead of Slovenia (down 2.8 percent) while the best performer was Slovakia (1.1 percent) followed by Lithuania (0.8 percent).
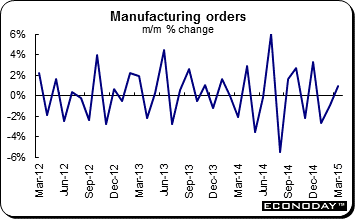 March manufacturing orders were up 0.9 percent following an unrevised 0.9 percent monthly drop in February. The end of quarter gain boosted annual workday adjusted orders growth from minus 1.2 percent to plus 1.9 percent, its highest mark so far in 2015. The monthly increase in overall orders was largely attributable to capital goods which were up 1.3 percent. However, basics also saw a respectable 0.9 percent advance leaving consumer & durables (down 2.2 percent) as the only sector to record a decline. Domestic demand was strong as orders generated from the home market expanded a very solid 4.3 percent from mid-quarter when they edged up 0.1 percent. Within this, capital goods again dominated with a jump of 5.8 percent. However, foreign orders were soft, falling 1.6 percent on the month on the back of broadly equivalent decreases in all three main sectors. The decline here was not due to weakness in the Eurozone, where orders climbed 2.5 percent, but rather to a 4.0 percent drop elsewhere. March manufacturing orders were up 0.9 percent following an unrevised 0.9 percent monthly drop in February. The end of quarter gain boosted annual workday adjusted orders growth from minus 1.2 percent to plus 1.9 percent, its highest mark so far in 2015. The monthly increase in overall orders was largely attributable to capital goods which were up 1.3 percent. However, basics also saw a respectable 0.9 percent advance leaving consumer & durables (down 2.2 percent) as the only sector to record a decline. Domestic demand was strong as orders generated from the home market expanded a very solid 4.3 percent from mid-quarter when they edged up 0.1 percent. Within this, capital goods again dominated with a jump of 5.8 percent. However, foreign orders were soft, falling 1.6 percent on the month on the back of broadly equivalent decreases in all three main sectors. The decline here was not due to weakness in the Eurozone, where orders climbed 2.5 percent, but rather to a 4.0 percent drop elsewhere.
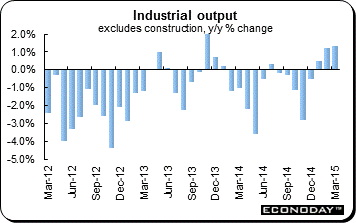
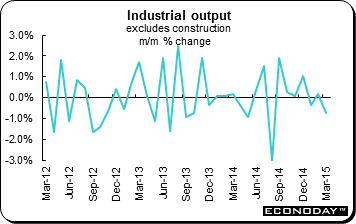 March industrial production declined 0.5 percent on the month and was the steepest drop since last August. It followed a downwardly revised flat performance in February. As a result, calendar and seasonally adjusted annual growth slipped from 0.1 percent to minus 0.1 percent, its worst showing since November 2014. The underlying deterioration was actually even more marked as manufacturing output was down 0.8 percent from February when it was up a revised 0.1 percent. Weakness was most apparent in the key capital goods subsector which posted a monthly 1.4 percent contraction. Intermediates were not far behind with a 0.8 percent decrease but consumer goods advanced 0.7 percent. Energy was unchanged on the month but overall production found support in a 2.1 percent increase in construction. March industrial production declined 0.5 percent on the month and was the steepest drop since last August. It followed a downwardly revised flat performance in February. As a result, calendar and seasonally adjusted annual growth slipped from 0.1 percent to minus 0.1 percent, its worst showing since November 2014. The underlying deterioration was actually even more marked as manufacturing output was down 0.8 percent from February when it was up a revised 0.1 percent. Weakness was most apparent in the key capital goods subsector which posted a monthly 1.4 percent contraction. Intermediates were not far behind with a 0.8 percent decrease but consumer goods advanced 0.7 percent. Energy was unchanged on the month but overall production found support in a 2.1 percent increase in construction.
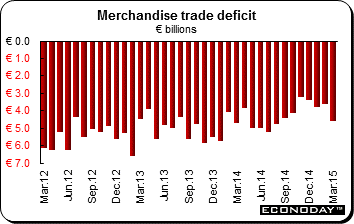
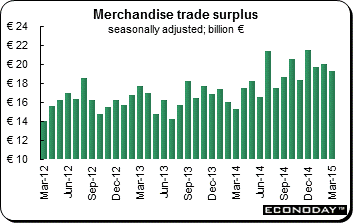 March seasonally adjusted merchandise trade surplus was €19.3 billion surplus, only €0.7 billion short of February's upwardly revised level and some €4.0 billion above its mark a year ago. Unadjusted the excess stood at an even larger €23.0 billion, an 18 percent increase from its mid-quarter mark. The minor reduction in the headline surplus reflected a 2.4 percent monthly increase in imports, their strongest rise since last September. Exports were up a more modest 1.2 percent, a slight weakening from February's 1.5 percent pace. Compared with March 2014 exports expanded 12.4 percent and imports a much smaller 7.1 percent but both sides of the balance sheet registered new record highs. March seasonally adjusted merchandise trade surplus was €19.3 billion surplus, only €0.7 billion short of February's upwardly revised level and some €4.0 billion above its mark a year ago. Unadjusted the excess stood at an even larger €23.0 billion, an 18 percent increase from its mid-quarter mark. The minor reduction in the headline surplus reflected a 2.4 percent monthly increase in imports, their strongest rise since last September. Exports were up a more modest 1.2 percent, a slight weakening from February's 1.5 percent pace. Compared with March 2014 exports expanded 12.4 percent and imports a much smaller 7.1 percent but both sides of the balance sheet registered new record highs.
 March industrial production (excluding construction) was down 0.3 percent but only after a sharp upward revision to output in February to 0.5 percent. Annual growth was up 1.3 percent. Manufacturing output was up 0.3 percent from February when it increased 0.5 percent. March's headline weakness was primarily attributable to a near-3 percent slump in the volatile mining & quarrying, energy, water supply & waste management subsector. Within manufacturing, food & drink gained 1.0 percent, coke & refined petroleum products added 6.6 percent and transport equipment gained 0.6 percent. The other manufactured goods category also edged 0.1 percent firmer but electrical equipment & machinery followed a 0.6 percent decline last time with a 0.4 percent loss. Construction rose 0.9 percent. March industrial production (excluding construction) was down 0.3 percent but only after a sharp upward revision to output in February to 0.5 percent. Annual growth was up 1.3 percent. Manufacturing output was up 0.3 percent from February when it increased 0.5 percent. March's headline weakness was primarily attributable to a near-3 percent slump in the volatile mining & quarrying, energy, water supply & waste management subsector. Within manufacturing, food & drink gained 1.0 percent, coke & refined petroleum products added 6.6 percent and transport equipment gained 0.6 percent. The other manufactured goods category also edged 0.1 percent firmer but electrical equipment & machinery followed a 0.6 percent decline last time with a 0.4 percent loss. Construction rose 0.9 percent.
 March seasonally adjusted trade deficit widened out from a marginally larger revised €3.6 billion in February to €4.6 billion in March, the most red ink since August 2015. March's marked deterioration reflected strong imports which, up 3.1 percent on the month, were close to their record high on the back of a sharp increase in energy purchases. Imports of autos, capital goods and intermediates were also firm. Exports increased a relatively sluggish 0.9 percent from February and gains in autos, pharmaceuticals, metals & electronic equipment were partially offset by declines in aerospace deliveries. Compared with a year ago, imports were up 3.1 percent and exports 3.8 percent firmer. March seasonally adjusted trade deficit widened out from a marginally larger revised €3.6 billion in February to €4.6 billion in March, the most red ink since August 2015. March's marked deterioration reflected strong imports which, up 3.1 percent on the month, were close to their record high on the back of a sharp increase in energy purchases. Imports of autos, capital goods and intermediates were also firm. Exports increased a relatively sluggish 0.9 percent from February and gains in autos, pharmaceuticals, metals & electronic equipment were partially offset by declines in aerospace deliveries. Compared with a year ago, imports were up 3.1 percent and exports 3.8 percent firmer.
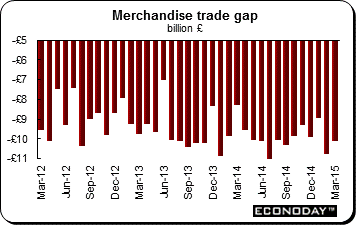 March trade deficit eased to Stg10.1 billion, down only Stg0.7 billion from a larger revised February posting. The limited improvement reflected a 1.4 percent monthly rise in exports, itself built on gains in material manufactures and chemicals. Imports fell 1.0 percent as a drop in manufactured products was partially offset by an increase in fuels. However, the volumes picture was very different. Excluding oil and erratics, real exports declined a monthly 1.0 percent and now show no growth since December last year. Underlying import volumes were flat at their mid-quarter level and are 1.7 percent higher than in December. Net exports to other EU countries improved by Stg0.5 billion to a Stg7.0 billion deficit while the shortfall with the rest of the world dipped by just Stg0.1 billion to Stg3.2 billion. March trade deficit eased to Stg10.1 billion, down only Stg0.7 billion from a larger revised February posting. The limited improvement reflected a 1.4 percent monthly rise in exports, itself built on gains in material manufactures and chemicals. Imports fell 1.0 percent as a drop in manufactured products was partially offset by an increase in fuels. However, the volumes picture was very different. Excluding oil and erratics, real exports declined a monthly 1.0 percent and now show no growth since December last year. Underlying import volumes were flat at their mid-quarter level and are 1.7 percent higher than in December. Net exports to other EU countries improved by Stg0.5 billion to a Stg7.0 billion deficit while the shortfall with the rest of the world dipped by just Stg0.1 billion to Stg3.2 billion.
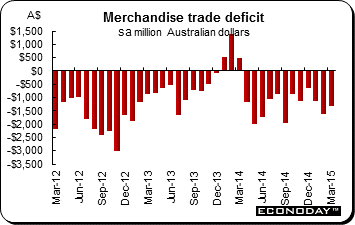 The trade deficit narrowed to A$1.3 billion from a revised A$1.6 billion in February. Exports retreated 1.5 percent on the month and 4.1 percent on the year. Imports were down 2.4 percent in March and were up 2.3 percent from the same month a year ago. Both rural and non-rural exports were down 2 percent. The main component contributing to the decline in rural goods was other rural, which was down 7 percent. Partly offsetting this decline was meat and meat preparations, up 5 percent. The main components contributing to the decline in non-rural goods were other mineral fuels and metal ores and minerals. Partly offsetting these declines was coal, coke & briquettes. Intermediate and other merchandise goods imports declined 4 percent. Capital goods slid 4 percent and consumption goods were down 3 percent. The trade deficit narrowed to A$1.3 billion from a revised A$1.6 billion in February. Exports retreated 1.5 percent on the month and 4.1 percent on the year. Imports were down 2.4 percent in March and were up 2.3 percent from the same month a year ago. Both rural and non-rural exports were down 2 percent. The main component contributing to the decline in rural goods was other rural, which was down 7 percent. Partly offsetting this decline was meat and meat preparations, up 5 percent. The main components contributing to the decline in non-rural goods were other mineral fuels and metal ores and minerals. Partly offsetting these declines was coal, coke & briquettes. Intermediate and other merchandise goods imports declined 4 percent. Capital goods slid 4 percent and consumption goods were down 3 percent.
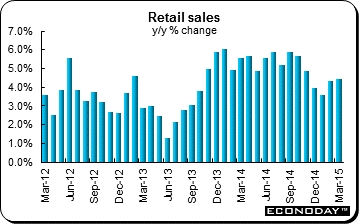 March retail sales were up 0.3 percent after increasing 0.7 percent in February. The March increase was slightly below expectations of a 0.4 percent monthly increase. On the year, sales were up 4.5 percent. March quarter sales were up 0.7 percent when compared with the December 2014 quarter. In seasonally adjusted terms the largest contributor to the increase was department stores (3.8 percent), clothing, footwear & personal accessory retailing (2.2 percent), food retailing (0.4 percent) and other retailing (0.1 percent). Household goods retailing declined 1.0 percent and cafes, restaurants & takeaway food services retreated 1.1 percent. Sales increased in Queensland (0.7 percent), New South Wales (0.3 percent), Victoria (0.2 percent), South Australia (0.3 percent) and Tasmania (0.5 percent). Sales declined in Western Australia (down 0.3 percent), the Australian Capital Territory (down 0.5 percent) and the Northern Territory (down 0.8 percent). March retail sales were up 0.3 percent after increasing 0.7 percent in February. The March increase was slightly below expectations of a 0.4 percent monthly increase. On the year, sales were up 4.5 percent. March quarter sales were up 0.7 percent when compared with the December 2014 quarter. In seasonally adjusted terms the largest contributor to the increase was department stores (3.8 percent), clothing, footwear & personal accessory retailing (2.2 percent), food retailing (0.4 percent) and other retailing (0.1 percent). Household goods retailing declined 1.0 percent and cafes, restaurants & takeaway food services retreated 1.1 percent. Sales increased in Queensland (0.7 percent), New South Wales (0.3 percent), Victoria (0.2 percent), South Australia (0.3 percent) and Tasmania (0.5 percent). Sales declined in Western Australia (down 0.3 percent), the Australian Capital Territory (down 0.5 percent) and the Northern Territory (down 0.8 percent).
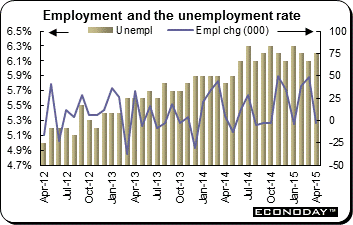 April unemployment rate edged up 0.1 percentage points to 6.2 percent. Employment in April was down 2,900 – expectations were for a modest increase of 5,000. However the number of jobs added in March was revised upwards from 37,700 to 48,100, taking the sting out of the miss. April's employment decline was driven by decreases in full-time employment for males (down 47,900) and part-time employment for females (down 10,700). These were offset by increases in male part-time employment (up 29,700) and female full-time employment (up 26,000). The seasonally adjusted labour force participation rate remained steady at 64.8 per cent in April 2015. The number of people unemployed increased by 7,000 to 769,500. This was driven by people who looked for part-time work only, which increased by 9,800 to 228,000. April unemployment rate edged up 0.1 percentage points to 6.2 percent. Employment in April was down 2,900 – expectations were for a modest increase of 5,000. However the number of jobs added in March was revised upwards from 37,700 to 48,100, taking the sting out of the miss. April's employment decline was driven by decreases in full-time employment for males (down 47,900) and part-time employment for females (down 10,700). These were offset by increases in male part-time employment (up 29,700) and female full-time employment (up 26,000). The seasonally adjusted labour force participation rate remained steady at 64.8 per cent in April 2015. The number of people unemployed increased by 7,000 to 769,500. This was driven by people who looked for part-time work only, which increased by 9,800 to 228,000.
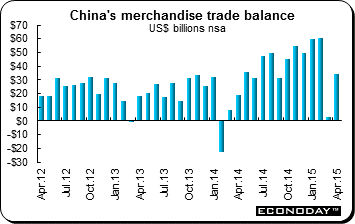 April merchandise trade surplus was $34.13 billion. Both exports and imports were down from a year ago. Exports dropped 6.4 percent and imports sank 16.2 percent on the year. The data suggest that the first quarter's weakness cannot be fully attributed to Chinese New Year distortions and is actually the result of soft conditions at home and abroad. A strong real effective yuan exchange rate and a crackdown on fake trade invoicing also may have hurt exports. The trade figures are the latest sign of weakness in China's economy. In the first quarter, China's gross domestic product expanded by 7 percent from a year earlier, its slowest pace in six years. And despite recent monetary easing, industrial profits are down, monthly factory prices have been falling for more than three years and the real-estate market continues to swoon. April merchandise trade surplus was $34.13 billion. Both exports and imports were down from a year ago. Exports dropped 6.4 percent and imports sank 16.2 percent on the year. The data suggest that the first quarter's weakness cannot be fully attributed to Chinese New Year distortions and is actually the result of soft conditions at home and abroad. A strong real effective yuan exchange rate and a crackdown on fake trade invoicing also may have hurt exports. The trade figures are the latest sign of weakness in China's economy. In the first quarter, China's gross domestic product expanded by 7 percent from a year earlier, its slowest pace in six years. And despite recent monetary easing, industrial profits are down, monthly factory prices have been falling for more than three years and the real-estate market continues to swoon.
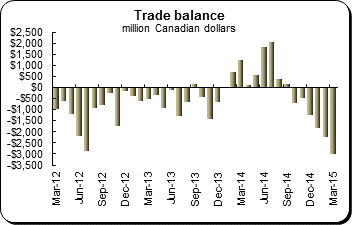 March merchandise trade deficit was C$3.02 billion, a new record. March's sharp deterioration followed a significant upward revision to February's deficit which now stands at C$2.22 billion. The trade account has now been in the red for six consecutive months and has worsened every month since last November. The slide in the headline reflected a modest 0.4 percent monthly increase in exports that was easily more than eclipsed by a 2.2 percent surge in imports. However, price volatility was again marked and export volumes were up 1.9 percent, 0.4 percentage more than imports. The bilateral surplus with the U.S. widened from C$1.95 billion to C$2.18 billion as sales across the border dropped a monthly 0.9 percent while imports declined a steeper 1.7 percent. Within the overall monthly gain in exports, energy plunged 8.9 percent and, without this category, would have expanded a healthy 2.4 percent. The other main declines were in aircraft & other transportation equipment & parts (9.9 percent) and electronic & electrical equipment & parts (2.2 percent). However, strong advances were recorded in motor vehicles & parts (11.7 percent), basic & industrial chemical, plastic & rubber products (5.3 percent) and metal ores & non-metallic minerals (7.4 percent). Imports were helped by consumer goods (7.9 percent), energy products (2.3 percent) and basic & industrial chemical, plastic & rubber products (3.4 percent). Farm, fishing & intermediate food products (4.5 percent) and autos (3.7 percent) also performed well. March merchandise trade deficit was C$3.02 billion, a new record. March's sharp deterioration followed a significant upward revision to February's deficit which now stands at C$2.22 billion. The trade account has now been in the red for six consecutive months and has worsened every month since last November. The slide in the headline reflected a modest 0.4 percent monthly increase in exports that was easily more than eclipsed by a 2.2 percent surge in imports. However, price volatility was again marked and export volumes were up 1.9 percent, 0.4 percentage more than imports. The bilateral surplus with the U.S. widened from C$1.95 billion to C$2.18 billion as sales across the border dropped a monthly 0.9 percent while imports declined a steeper 1.7 percent. Within the overall monthly gain in exports, energy plunged 8.9 percent and, without this category, would have expanded a healthy 2.4 percent. The other main declines were in aircraft & other transportation equipment & parts (9.9 percent) and electronic & electrical equipment & parts (2.2 percent). However, strong advances were recorded in motor vehicles & parts (11.7 percent), basic & industrial chemical, plastic & rubber products (5.3 percent) and metal ores & non-metallic minerals (7.4 percent). Imports were helped by consumer goods (7.9 percent), energy products (2.3 percent) and basic & industrial chemical, plastic & rubber products (3.4 percent). Farm, fishing & intermediate food products (4.5 percent) and autos (3.7 percent) also performed well.
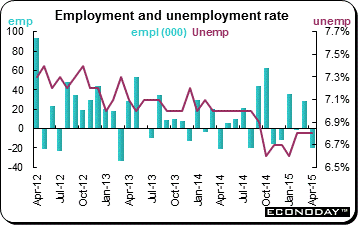 May employment followed March's surprisingly sharp 28,700 increase with a 19,700 retracement. However, with the participation rate dipping a tick to 65.8 percent the decline was not enough to budge the unemployment rate from the previous period's 6.8 percent. While part-time positions contracted 66,500, full-time headcount rose a solid 46,900. Similarly a more than respectable 24,200 advance in private sector jobs contrasted with both a 19,900 slide in public sector workers and a 24,100 decrease in the number of self-employed. Much of the overall decline was concentrated in the goods producing sector which shrank 15,500. However, the drop here was more than accounted for by a 28,400 reversal in construction and masked a 10,400 gain in manufacturing. The other subsectors were broadly stable. Employment in services was down just 4,200 although this masked sizeable declines in trade (20,500) and information, culture & recreation (9,800). Support was provided mainly by an 11,000 increase in business, building & other support services together with smaller rises in other services (5,500), transportation & warehousing (5,400) and accommodation & food (3,600). May employment followed March's surprisingly sharp 28,700 increase with a 19,700 retracement. However, with the participation rate dipping a tick to 65.8 percent the decline was not enough to budge the unemployment rate from the previous period's 6.8 percent. While part-time positions contracted 66,500, full-time headcount rose a solid 46,900. Similarly a more than respectable 24,200 advance in private sector jobs contrasted with both a 19,900 slide in public sector workers and a 24,100 decrease in the number of self-employed. Much of the overall decline was concentrated in the goods producing sector which shrank 15,500. However, the drop here was more than accounted for by a 28,400 reversal in construction and masked a 10,400 gain in manufacturing. The other subsectors were broadly stable. Employment in services was down just 4,200 although this masked sizeable declines in trade (20,500) and information, culture & recreation (9,800). Support was provided mainly by an 11,000 increase in business, building & other support services together with smaller rises in other services (5,500), transportation & warehousing (5,400) and accommodation & food (3,600).
Mixed economic data made for volatile financial markets last week. However, U.S. employment data and the UK election result helped put a positive end to the week with European and U.S. equities advancing while those in the Asia Pacific mostly retreated. Economic data were mixed in Europe and the Asia-Pacific. While data from Australia was mostly positive, China's data point to a weakening economy.
In the week, the Bank of England on Monday announces its decision. No policy change is anticipated. Flash first quarter gross domestic product will be reported for the Eurozone, Germany, France and Italy.
| Central Bank activities |
|
| May 11 |
UK |
Bank of England Monetary Policy Announcement |
| |
|
|
| The following indicators will be released this week... |
| Europe |
|
|
| May 12 |
UK |
Industrial Production (March) |
| May 13 |
UK |
Labour Market Report (April) |
|
Eurozone |
Gross Domestic Product (Q1.2015 flash) |
|
|
Industrial Production (March) |
|
Germany |
Gross Domestic Product (Q1.2015 flash) |
|
France |
Gross Domestic Product (Q1.2015 flash) |
|
Italy |
Gross Domestic Product (Q1.2015 flash) |
| |
|
|
| Asia/Pacific |
|
|
| May 12 |
India |
Consumer Price Index (April) |
|
|
Industrial Production (March) |
| May 13 |
China |
Industrial Production (April) |
|
|
Retail Sales (April) |
| May 15 |
Japan |
Producer Price Index (April) |
| |
|
|
| Americas |
|
|
| May 15 |
Canada |
Manufacturing Sales (March) |
Anne D Picker is the author of International Economic Indicators and Central Banks.
|
