|
The second-quarter is getting off to a rough start. First it was soft payroll growth in the April employment report followed in the latest week by flat retail sales and a reversal for consumer sentiment. And the latest on the factory sector doesn't make for pleasant reading.
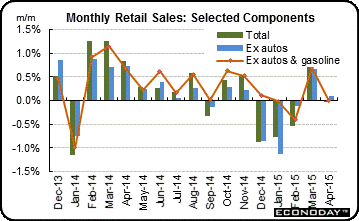 "Growth in household spending," the FOMC told us last month, "declined," an assessment they may have to downgrade one more notch given the latest data. Retail sales were unchanged in April, held down by a decline in vehicle sales which have been no better than flat going back a year now. Ex-auto was up only 0.1 percent, at low-end expectations, while ex-auto ex-gasoline was up a no more impressive 0.2 percent, below low-end expectations. "Growth in household spending," the FOMC told us last month, "declined," an assessment they may have to downgrade one more notch given the latest data. Retail sales were unchanged in April, held down by a decline in vehicle sales which have been no better than flat going back a year now. Ex-auto was up only 0.1 percent, at low-end expectations, while ex-auto ex-gasoline was up a no more impressive 0.2 percent, below low-end expectations.
Department stores and electronics & appliance stores were especially weak, the latter, cell phones or not, down now for 7 straight months. The results have already downgraded second-quarter GDP talk from the 3 percent area to the 2 percent area.
Unfortunately, early indications on May are no better. Redbook's weekly same-store sales tally has been showing hardly any life. Easter effects had been holding down growth rates in April but the latest year-on-year reading, at only 2.1 percent in the May 9 week, is far below the usual pace of 3 percent plus. Readings in Redbook broke down in March and have yet to recover.
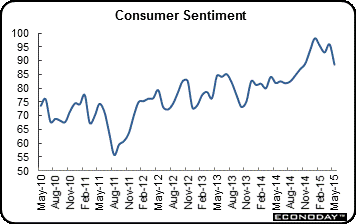 Turning to what the FOMC considers to be a leading indicator for retail sales is no cause for joy. In support of its forecast for a second-quarter snap back, the FOMC inserted in the April statement that "consumer sentiment remains high." Well, maybe then but not anymore. The index for mid-May came in at a far-lower-expected 88.6 for a 7.3 point decline which is the steepest in 3-1/2 years. A drop in current conditions points to softness in this month's jobs market while a drop in expectations is a downgrade for the jobs outlook. If consumer sentiment does indeed lead retail sales, than there's not much punch in the economic outlook. Turning to what the FOMC considers to be a leading indicator for retail sales is no cause for joy. In support of its forecast for a second-quarter snap back, the FOMC inserted in the April statement that "consumer sentiment remains high." Well, maybe then but not anymore. The index for mid-May came in at a far-lower-expected 88.6 for a 7.3 point decline which is the steepest in 3-1/2 years. A drop in current conditions points to softness in this month's jobs market while a drop in expectations is a downgrade for the jobs outlook. If consumer sentiment does indeed lead retail sales, than there's not much punch in the economic outlook.
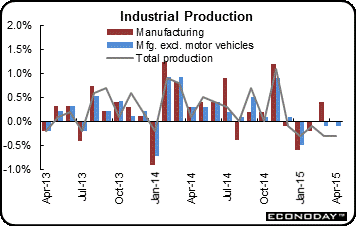 The Federal Reserve's industrial production report has been in a very long tailspin, falling 0.3 percent in April for its 5th straight contraction. Capacity utilization, which inflation hawks like to watch for signs of pressure, fell back 4 tenths to 78.2 percent for its lowest reading since January last year. Not much inflation here. Utilities fell for a 2nd straight month while mining, hit by deep contraction in oil & gas drilling, fell for a 6th time in 7 months. The Federal Reserve's industrial production report has been in a very long tailspin, falling 0.3 percent in April for its 5th straight contraction. Capacity utilization, which inflation hawks like to watch for signs of pressure, fell back 4 tenths to 78.2 percent for its lowest reading since January last year. Not much inflation here. Utilities fell for a 2nd straight month while mining, hit by deep contraction in oil & gas drilling, fell for a 6th time in 7 months.
But it's the manufacturing component that's most closely watched and it came in at no change to extend its long flat trend. Auto output was a plus for April but can't be depended on for May given weakness in April auto sales. Construction supplies rose 0.1 percent which, believe it or not, is their best showing of the year and more evidence of how weak construction and housing has been.
Turning to May, the first indication comes from the New York Fed and the result is the same. The Empire State index edged into plus ground but only just barely, at a lower-than-expected 3.09 but still up from April's even more dismal minus 1.19. Shipments are strong in the report but don't look to last given only marginal growth in new orders and deep contraction in backlogs. Employment growth is down as is the 6-month outlook, neither pointing to optimism.
The industrial economy is flat at best and is becoming more and more of a drag at a time when economic growth is supposed to be on a springtime rebound. Contractions in both drilling and energy equipment are holding down the sector, as is weakness in exports which is tied to both slowing in foreign economies not to mention the rise in the dollar which has made US goods more expensive. The FOMC's assessment of the nation's exports has been downgraded in the last two statements from having "weakened" in March to having "declined" in April. Don't be surprised to see the next downgrade in the June statement.
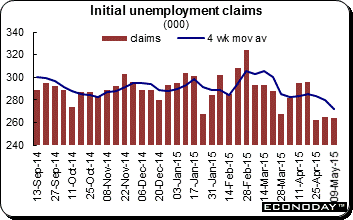 But there is still a lonely beacon of light for the economy. Jobless claims are way down and are easily sending out the strongest positive signals of any indicator, employment or otherwise. Claims data go all the way back to 1948 and have rarely been this low. Initial claims were last this low back in March and April 2000 when they averaged 272,500. The current 4-week average out to May 9 is at 271,750, this at a time when the civilian labor force, at 157.1 million, is 10 percent larger than it was back in 2000. Continuing claims tell the same story, at a 15-year low of 2.229 million. The unemployment rate for insured workers is very low, at only 1.7 percent. But there is still a lonely beacon of light for the economy. Jobless claims are way down and are easily sending out the strongest positive signals of any indicator, employment or otherwise. Claims data go all the way back to 1948 and have rarely been this low. Initial claims were last this low back in March and April 2000 when they averaged 272,500. The current 4-week average out to May 9 is at 271,750, this at a time when the civilian labor force, at 157.1 million, is 10 percent larger than it was back in 2000. Continuing claims tell the same story, at a 15-year low of 2.229 million. The unemployment rate for insured workers is very low, at only 1.7 percent.
The decline in jobless claims does fit nicely with the decline underway in the overall unemployment rate, down 1 tenth in the last report to a 7-year low of 5.4 percent. But claims don't fit in with stubbornly slow payroll growth nor with two other job indicators. The Fed's labor market conditions index, which is very broad based, has shown no life at all and fell back into the negative column in April. Job openings in the JOLTS report had been on the climb but also fell back, down a surprising 2.9 percent in March data to what, however, is still a strong level of 4.994 million.
Gains in most employment data have not been impressive with the exception of jobless claims which are sending a major signal of some kind. Is it that the exception proves the rule' Or that it's difficult to find the right person and employers are apparently happy to keep the ones they're with.
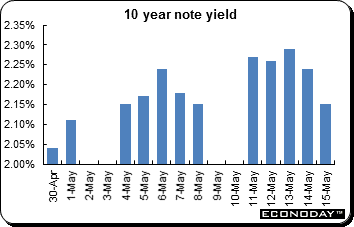 The week's lowlight of course was a second breakdown in as many weeks in the market you'd least expect to see one in -- bonds. Yields spiked for no apparent reason and at an odd time in late afternoon trading on Monday. The 10-year yield jumped 12 basis points to 2.27 percent. It's really not fair that bond traders should go through this. Most everyone's blaming the bursts of selling to a rise in the inflation outlook based on oil's recent move, up from about $50 for March WTI to $60 this month. This gain presumably pulls forward Fed action. The week's lowlight of course was a second breakdown in as many weeks in the market you'd least expect to see one in -- bonds. Yields spiked for no apparent reason and at an odd time in late afternoon trading on Monday. The 10-year yield jumped 12 basis points to 2.27 percent. It's really not fair that bond traders should go through this. Most everyone's blaming the bursts of selling to a rise in the inflation outlook based on oil's recent move, up from about $50 for March WTI to $60 this month. This gain presumably pulls forward Fed action.
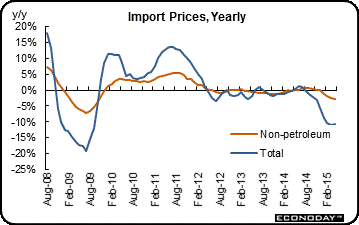 So far, however, actual inflation is nowhere to be found, at least not in the latest week's data. Producer prices fell a steep 0.4 percent in April with the year-on-year rate at minus 1.3 percent. Import & export prices also fell and are at year-on-year rates of minus 10.7 percent for imports and minus 6.3 percent for exports. The Fed has been expecting inflation to move toward its 2 percent growth target, not away from it. So far, however, actual inflation is nowhere to be found, at least not in the latest week's data. Producer prices fell a steep 0.4 percent in April with the year-on-year rate at minus 1.3 percent. Import & export prices also fell and are at year-on-year rates of minus 10.7 percent for imports and minus 6.3 percent for exports. The Fed has been expecting inflation to move toward its 2 percent growth target, not away from it.
For the Fed, the jumpiness in the bond market is evidence that even the most careful dedication to transparency may not fully limit market volatility, to say the least. Some are saying the 10-year yield, ending the week at 2.15 percent, may move to the 2.50 percent level by time the Fed actually does raise rates. Such a move would be sharp but not extreme, unless of course the move happens all at once.
The stock market gained on the week with the S&P hitting a new high. The Dow came up just short of a new record, ending the week with a fractional gain to 18,272. But record highs against a less-and-less optimistic outlook for the economy together with the risk of a Fed rate hike are a reminder, at least to some, of Janet Yellen's warning the other week, that valuations in the stock market are "generally quite high."
The strength of the signal being sent out by jobless claims is a puzzle, but otherwise the economy across sectors is showing cracks and not much of a rebound at all from what the Fed told us were the "transitory" setbacks of the first quarter. Unless the pace picks up soon, some will wonder whether those first-quarter setbacks were masking what was really fundamental economic slowing.
The week starts off with two indications on one of the most disappointing sectors of the economy -- the new home market. Homebuilders will express their views in the housing market index on Monday followed by hard data on Tuesday with the housing starts & permits report. FOMC minutes on Wednesday will focus attention on the internal debate at the Fed and how dominant the view is that first-quarter slowing was only temporary. Thursday's calendar is very heavy with reports on jobless claims and existing home sales standing out, both indicators among the calendar's best performers. Friday wraps up the week with the consumer price index and whether it corroborates other data that show, despite the rise underway in gasoline prices, there are just about no inflationary pressures whatsoever in the economy.
The housing market index has long been signaling strength in the new home market that has never appeared. Homebuilders have been very confident in the 6-month sales outlook despite unusually weak buyer traffic. The consensus is calling for a 1 point rise in the May report from an already strong April reading of 56.
NAHB Housing Market Index - Consensus Forecast for May: 57
Range: 56 to 58
Housing starts & permits have been some of the most disappointing data on the calendar, underscoring how weak the new home market really is. Excuses were abundant during the heavy weather of the first quarter but those excuses won't apply to the latest report which is for April. Both starts and permits are expected to show big gains from depressed levels.
Housing Starts - Consensus Forecast for April: 1.029 million
Range: 0.970 to 1.120 million
Housing Starts - Consensus Forecast for April: 1.070 million
Range: 1.050 to 1.120 million
Minutes of the April 28-29 meeting will be posted at 2:00 p.m. ET. Watch for the debate on removing assurance that a rate hike is not imminent and also on whether all were agreed that the first-quarter was slowed by "transitory" factors only.
Initial jobless claims are at rock bottom and are strongly signaling that employers are holding onto their employees. The three prior weeks for initial claims came in at the low 260,000 level, a 15-year low and one of the very lowest stretches in the long history of the series.
Jobless Claims - Consensus Forecast for May 16 week: 270,000
Range: 265,000 to 280,000
The Chicago Fed activity index will offer a summation of all the economic data during April, a month that was surprisingly slow coming off the even slower months of the first quarter.
Chicago Fed Activity Index - Consensus Forecast for April: +0.10
Range: -0.48 to +0.20
The real bright spot in the housing sector which, in total, is still struggling despite the onset of spring, has been existing home sales. But the comparison with the 6.1 percent sales jump March is difficult, holding down the Econoday consensus to only a modest gain for April, up 0.6 percent to 5.22 million from 5.19 million.
Existing Home Sales - Consensus Forecast for April: 5.22 million
Range: 5.10 to 5.32 million
The Philadelphia Fed business outlook survey will, following last week's soft Empire State report, offer a second glimpse at manufacturing activity this month. The two reports have been well aligned with one another -- that is showing very little life in the sector.
Philadelphia Fed Business Outlook Survey - Consensus Forecast for April: 8.0
Range: 3.5 to 14.5
Leading indicators have not been signaling the big bounce back many expect following the slow first quarter. The housing component and the manufacturing components have been holding back this report, now joined perhaps by weakness in consumer confidence. A major positive, however, will be jobless claims which are near record lows.
Leading Indicators - Consensus Forecast for April: 0.3%
Range: 0.2% to 0.5%
The Kansas City Fed manufacturing index, like other regional Fed reports, has been offering early signals of weakness. The consensus, at minus 2, is calling for a third straight negative reading.
Kansas City Fed Manufacturing Index - Consensus Forecast for April: -2
Range: -2 to +1
The importance of the consumer price index is being heightened by questions over the very low readings for producer prices and import & export prices, neither of which have been reflecting much upward push from higher energy prices. Energy prices pushed up the CPI slightly in February and March but are not expected to give a boost to April where both the total and core readings are expected at dovish-friendly readings of only plus 0.1 percent.
Consumer Price Index - Consensus Forecast for April: 0.1%
Range: 0.0% to 0.4%
Consumer Price Index Less Food & Energy- Consensus Forecast for April: 0.1%
Range: 0.1% to 0.2%
The PMI manufacturing index has been strong in general, in contrast to government data, and has been signaling special strength in hiring, also in contrast to hard data. Markit Economics' manufacturing data are closely watched for indications on other countries but not, at least yet, on the US.
PMI Manufacturing Index - Consensus Forecast for April: 54.6
Range: 54.2 to 56.0
|
