|
The April employment and retail sales reports pushed back the FOMC's coming rate hike, right' Not so fast. Exports may be hurting growth but the other side of the Fed's balance arm — inflation — is suddenly showing some pressure.
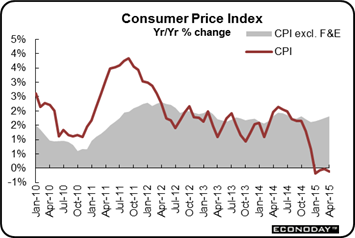
The core CPI has come out of nowhere and, for the last couple of months, is running very hot. After a 0.2 percent rise in March, the core rose 0.3 percent in April which was last matched in early 2013. But that's only one decimal place. Go two decimal places and the core reading, at 0.26 percent, was last matched in 2011 and last exceeded way back in 2008. And keeping to two places, the gain for March comes out to 0.23 percent for the fourth highest going back to 2009.
 The pressure is coming out of services, a domestic-dominated sector insulated from both weakness in foreign demand and also from price swings in energy. Service costs, again sticking to two decimal places, rose 0.27 percent for the highest reading since May last year and the fourth highest since 2008. The pressure is coming out of services, a domestic-dominated sector insulated from both weakness in foreign demand and also from price swings in energy. Service costs, again sticking to two decimal places, rose 0.27 percent for the highest reading since May last year and the fourth highest since 2008.
Shelter costs, reflecting rising rents, rounded out in April at plus 0.3 percent for the third time in four months. This is the hottest streak for this reading since way back in late 2006 and early 2007. Rental costs rose a rounded 0.3 percent for the fourth straight month. Year-on-year, rental costs, up 3.5 percent, are as high as they've been since way back when in 2008. And the list doesn't stop. Medical costs rose 0.7 percent in April with education costs up 0.5 percent, both very hot.
Masking all this pressure, however, have been energy prices which, despite the recent jump in the price of oil, moved lower in the April report. Pulled down by a 1.3 percent decline in energy, the overall CPI rose only 0.1 percent with the year-on-year rate in negative ground at minus 0.2 percent. But the core is definitely not in negative ground, at plus 1.8 percent and closing in on the Fed's 2 percent target.
Core-level inflation is back on the radar for the first time in a long time and could be the first sign of economic acceleration. Personal expenditures on goods have mostly showed weakness including three recent declines, but personal expenditures on services haven't slowed at all and which, looking back, perhaps first signaled some of the inflation pressures that are now appearing. Doves take note! The screeches you're hearing are from the hawks.
 They may not be hiring so much, but employers, based on jobless claims data, are holding onto the employees they got more than ever. Initial claims did rise in the May 16 week but not by much, 10,000 higher to 274,000 which follow three straight weeks in the low to mid 260,000 range. This is the lowest run since 2000. They may not be hiring so much, but employers, based on jobless claims data, are holding onto the employees they got more than ever. Initial claims did rise in the May 16 week but not by much, 10,000 higher to 274,000 which follow three straight weeks in the low to mid 260,000 range. This is the lowest run since 2000.
The 4-week average fell for a fourth straight week, 5,500 lower to a 266,250 level which is more than 20,000 lower than the comparison with the April 18 week. The May 16 week to April 18 week comparison offers a sample-week to sample-week look at the monthly employment report, and the 4-week average is pointing to major improvement.
Continuing claims are also pointing to improvement, down 12,000 to 2.211 million in lagging data for the May 9 week with the 4-week average down 29,000 to 2.230 million. The unemployment rate for insured workers is down yet another notch to only 1.6 percent. These are all the best readings in 15 years.
Claims are pointing to further improvement in the unemployment rate and are doing so with more force than ever. Of all the reports on the calendar, there's only one throbbing with undeniably red-hot signals — jobless claims.
The FOMC minutes released last week included a warning, repeated by Janet Yellen herself at week's end, over "statistical noise" that may have exaggerated weakness during the winter months. If there's a place where this noise has been most heard, it's the housing sector where nearly every report shows huge swings.
 This is no more evident than in housing starts which fell 15.3 percent in February, bounced back in March with a 4.9 percent gain, then surged by an historic 20.2 percent in April to a 1.135 million annual rate. Permits, also volatile, jumped 10.1 percent to a 1.143 million rate. This is no more evident than in housing starts which fell 15.3 percent in February, bounced back in March with a 4.9 percent gain, then surged by an historic 20.2 percent in April to a 1.135 million annual rate. Permits, also volatile, jumped 10.1 percent to a 1.143 million rate.
The strength in starts was split between single-family homes, up 16.7 percent to 733,000, and multi-family, up 27.2 percent to 402,000. The gain in multi-family underscores the importance of renters in the housing sector and also the upward price pressure for rentals seen in the consumer price report.
The gain for starts is the best in 7-1/2 years with the gain in permits the best in 7 years. If not for all the noise, this report by itself could have turned around what are still soft outlooks for the construction and housing sectors.
Another housing series swinging back and forth, but one not showing much strength at all, has been existing home sales which fell a very deep 3.3 percent in April to a 5.04 million rate. But there are positives, especially a big rise in supply, to 2.21 million on the market from 2.01 million in March. Higher prices are no doubt pulling homes into the market and, also perhaps, are giving off their own inflationary signals. The median price for an existing home rose 4.1 percent in April to $219,400 for almost frothy looking year-on-year appreciation of 8.9 percent.
Housing data month-to-month are always volatile, especially during the winter months and in the comparisons coming out of the winter. It's probably too soon to decipher how strong the spring housing season is right now but if starts and permits can hold their gains in the next report, don't be surprised to see the Fed upgrade its assessment which last described housing as "weak".
Weak is unquestionably the right description for the factory sector that's getting hit by strength in the dollar. The Fed stays away from citing the dollar in its FOMC statements but the minutes show a lot of discussion, that "the value of the dollar had increased significantly since the middle of last year" and would likely "continue to be a factor restraining U.S. net exports and economic growth."
 As we know, April was a weak month for the factory sector and was first signaled by the regional Fed reports which are now signaling more trouble for May. The Philly Fed report echoed the same theme from the Empire State report released earlier this month, that is barely any growth at all. The Philly Fed's general conditions index came in at only 6.7 for May, down from an already soft 7.5 in April. New orders did show some life, but not much at 4.0 vs an even weaker 0.7 in March. As we know, April was a weak month for the factory sector and was first signaled by the regional Fed reports which are now signaling more trouble for May. The Philly Fed report echoed the same theme from the Empire State report released earlier this month, that is barely any growth at all. The Philly Fed's general conditions index came in at only 6.7 for May, down from an already soft 7.5 in April. New orders did show some life, but not much at 4.0 vs an even weaker 0.7 in March.
Interestingly, price readings in the Philly report showed, in contrast to core consumer prices where service prices are going up, significant downward pressure including lower prices for both raw materials and finished goods. These readings reflect weak demand in the factory sector and point to an extension of the declines seen in the very weak producer price report earlier this month where the April headline fell 0.4 percent.
Showing even greater weakness than the Philly Fed was the Kansas City Fed report where the composite index moved deeper into negative ground, to a recovery low of minus 13 from minus 7 in April. Both new orders and backlog orders are in deep contraction, at minus 19 and minus 21 respectively. And like the Philly Fed report, price readings are on the deflationary side.
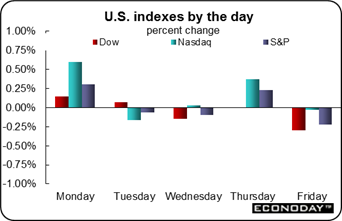
It was a dull week for the stock market which mostly inched about. There was no significant reaction to core prices on Friday nor to Janet Yellen's comments on the economy which did not mention the consumer price report. On the week, the Dow slipped 0.2 percent to 18,232.
 The dollar had an unusually strong week against the euro, up 3.9 percent for the strongest weekly gain in 4-1/2 years, a gain that no doubt will further pressure U.S. exports. And there were no flash crashes this week in the bond market, but yields did swing around a bit. Bond market volatility has been no surprise to the FOMC which, in its April minutes, actually cited the risk of the bond market volatility that subsequently appeared. And the reason for the volatility' The Fed pointed its finger first at high-frequency traders followed by decreased inventories of bonds held by broker-dealers and finally at elevated assets of bond funds. The 10-year yield rose 9 basis points in the week to 2.23 percent, pointing in turn to further gains for mortgage rates where the average 30-year fixed rate mortgage is now over 4.0 percent. The dollar had an unusually strong week against the euro, up 3.9 percent for the strongest weekly gain in 4-1/2 years, a gain that no doubt will further pressure U.S. exports. And there were no flash crashes this week in the bond market, but yields did swing around a bit. Bond market volatility has been no surprise to the FOMC which, in its April minutes, actually cited the risk of the bond market volatility that subsequently appeared. And the reason for the volatility' The Fed pointed its finger first at high-frequency traders followed by decreased inventories of bonds held by broker-dealers and finally at elevated assets of bond funds. The 10-year yield rose 9 basis points in the week to 2.23 percent, pointing in turn to further gains for mortgage rates where the average 30-year fixed rate mortgage is now over 4.0 percent.
The rise in core consumer prices offers a reminder of what the FOMC sees as the economy's fundamental strengths: rising consumer spending, high consumer confidence and rising household income. The service economy is strong and related prices are beginning to show pressure and, together with a coming increase in energy costs, they likely pull forward, at least a little bit, the coming rate hike.
Major updates come this week from the manufacturing, housing, and consumer sectors. Durable goods leads the week off with what is expected to be another decline though the outlook for ex-transportation is positive. Housing then takes the focus with price data from FHFA and Case-Shiller and followed by new home sales and pending sales of existing homes. After this week, we'll know whether last week's surge in starts and permits was a fluke or not for the housing sector. Readings on the consumer will include consumer confidence and consumer sentiment, both of which have been sagging. The week winds up with the first revision to first-quarter GDP which is seen moving from marginally positive ground to the negative side.
Durable goods orders, held down by exports, have been shockingly weak and, due to an expected swing lower in aircraft, are expected to fall again, down 0.6 percent. But the range for this volatile report is quite wide, from minus 3.0 percent on the downside to plus 1.8 percent on the top side. At least as important as the headline will be ex-transportation which is expected to rise a respectable 0.4 percent.
Durable Goods Orders - Consensus Forecast for April: -0.6%
Range: -3.0% to +1.8%
Durable Goods Orders Excluding Transportation - Consensus Forecast for April: +0.4%
Range: -0.2% to +1.0%
FHFA house prices are expected to rise a solid 0.7 percent in March. Gains in this report, as well as the S&P Case-Shiller report, would hint at momentum for housing going into the spring selling season.
FHFA House Price Index - Consensus Forecast for March: +0.7%
Range: +0.6% to +1.2%
S&P Case-Shiller house prices have been accelerating, reflecting low supply of used homes on the market and pointing to gains for household wealth. Gains for this report would suggest that housing was turning higher going into the spring selling season.
S&P Case-Shiller House Price Index - 20 City M/M adj. - Consensus Forecast for March: +0.9%
Range: +0.5% to +1.6%
S&P Case-Shiller House Price Index - 20 City M/M not adj. - Consensus Forecast for March: +0.9%
Range: +0.5% to +0.9%
S&P Case-Shiller House Price Index - 20 City Y/Y not adj. - Consensus Forecast for March: +4.6%
Range: +4.5% to +5.4%
New home sales have been one of the most volatile of any reports, a reflection of the report's small sample size. The last report, at a 0.481 million rate, was especially weak and forecasters are calling for a turn higher to 0.509 million.
New Home Sales - Consensus Forecast for April: 0.509 million
Range: 0.485 to 0.540 million
The consumer confidence index has been holding up though is off its highs earlier in the year. Forecasters, at a consensus 95.1, see little change from April's 95.2, but there might be some downward risk to this report given the mid-month plunge in the consumer sentiment report.
Consumer Confidence Index - Consensus Forecast for May: 95.1
Range: 91.0 to 98.0
The early indications on May's manufacturing activity have all been weak and the Richmond Fed manufacturing index is expected to be no exception. The Econoday consensus is calling for only the smallest gain of 1 point, still this would be up from two prior months of contraction.
Richmond Fed Manufacturing Index - Consensus Forecast for May: +1
Range: -1 to +9
The energy sector is hurting badly and is concentrated in the Dallas Fed manufacturing region where the index has been in heavy negative territory the last three months, at minus 16.0, minus 17.4, and minus 11.2. Forecasters see some improvement for May, but not very much with the consensus at minus 10.0.
Dallas Fed Manufacturing Index - Consensus Forecast for May: -10.0
Range: -12.0 to -9.0
With exports weak and the energy sector hurting, the service sector is of increasing importance to the nation's economic health. Markit's PMI services report has been showing solid strength and more is expected for the May flash, at a consensus 56.5.
Markit PMI Services Flash - Consensus Forecast for May: 56.5
Range: 54.0 to 58.0
Initial jobless claims are signaling great strength in the labor market, at least signaling that layoffs are at record lows. Continuing claims have been sending the same signal. Further improvement in this report has been pointing to further declines for the unemployment rate.
Initial Jobless Claims - Consensus Forecast for May 23 week: 270,000
Range: 265,000 to 275,000
Pending home sales have been on a tear, up for three straight months and contrasting with what have been weaker results in final sales of existing homes. Forecasters see a solid 0.8 percent gain for the April report though the range is quite wide with a low reading of minus 1.7 percent, one that would once again lower the housing outlook.
Pending Home Sales - Consensus Forecast for April: +0.8%
Range: -1.7% to +2.5%
First-quarter GDP is expected to move from an initial reading of plus 0.2 percent to a contractionary minus 0.8 percent. To blame is a wider-than-expected trade gap, the result of that quarter's port slowdown. Lower growth in inventories and nonresidential fixed investment are also cited.
Real GDP, 1st revision - Consensus Forecast for First Quarter: -0.8%
Range: -1.0% to -0.2%
GDP Price Index, 1st revision - Consensus Forecast for May: -0.1%
Range: -0.1% to -0.1%
The Chicago PMI was depressed during the winter months but shot back solidly in April to 53.3, roughly where forecasters see it holding in May, at 53.1. This report is often very volatile, including in April when new orders swung back into the plus-50 column with the largest monthly swing in more than 30 years.
Chicago PMI - Consensus Forecast for May: 53.1
Range: 51.0 to 54.0
The mid-month plunge in consumer sentiment, to 88.6 from 95.9, has been one of May's biggest shocks. Readings deteriorated for both current conditions and expectations. If the final report for May doesn't show a big bounce, questions will start being asked about the outlook for household spending.
Consumer Sentiment - Consensus Forecast for May: 90.3
Range: 86.5 to 99.5
|
