|
Equities retreated last week thanks to mixed U.S. earnings reports, especially from the technology sector. With little new economic data being released and Greece angst subsiding at least for now, U.S. earnings results were the focus of investors globally.
Flash PMIs
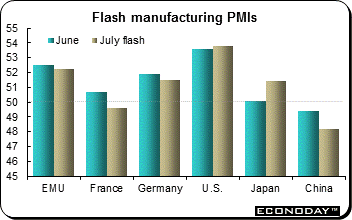 According to the July flash manufacturing PMIs, output eased in the Eurozone, Germany and France but increased in Japan. However, in China, it contracted at the fastest pace in 15 months in a blow that undercut recent signs of stabilization in the struggling economy. The news came as Beijing announced it would allow the yuan to fluctuate more widely within its trading band as a way to support the trade sector. According to the July flash manufacturing PMIs, output eased in the Eurozone, Germany and France but increased in Japan. However, in China, it contracted at the fastest pace in 15 months in a blow that undercut recent signs of stabilization in the struggling economy. The news came as Beijing announced it would allow the yuan to fluctuate more widely within its trading band as a way to support the trade sector.
The July flash manufacturing PMI dropped to a reading of 48.2, the lowest reading since April last year and the fifth straight month under 50 which separates contraction from expansion. Output, new orders and export orders all decreased. The China survey overshadowed better news from Japan where the flash manufacturing PMI rose to 51.4 in July from a final 50.1 in June.
In the Eurozone, the flash manufacturing index slipped to 52.2 from the 52.5 final reading in June. Manufacturing in France disappointed, dipping once again into contraction with a reading of 49.6 after a June final of 50.5. Germany's manufacturing PMI also slipped to 51.5 from 51.9. The tumult with Greece weighed on sentiment.
In the U.S., the index was virtually unchanged with a reading of 53.8, up slightly from June's 53.6 final which was a 20-month low. However, the survey did point to a strong increase in incoming new business, with the rate of expansion picking up to its fastest in three months. A number of survey respondents noted that they have turned to boosting domestic markets given that export demand is subdued thanks to the strong dollar.
Gold!
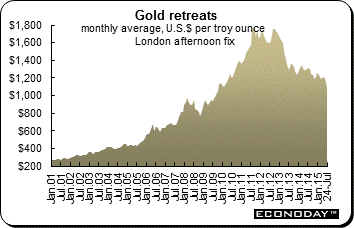 Gold retreated last week following Monday's "bear raid" when sellers dumped an estimated 33 tonnes in just two minutes. The sudden bout of selling in Shanghai and New York occurred during illiquid trading hours, with a wave of orders placed during a one minute period shortly after the Shanghai Gold Exchange opened on Monday. Within a further minute, the deals had been completed, sending the most-active U.S. gold futures contract down $48 to as low as $1,080.00 per ounce, its weakest since February 2010. Gold worth $1.3 billion changed hands on the Chinese and U.S. markets and the lack of liquidity on a day when Japanese markets were closed for a holiday hastened the slide. Gold retreated last week following Monday's "bear raid" when sellers dumped an estimated 33 tonnes in just two minutes. The sudden bout of selling in Shanghai and New York occurred during illiquid trading hours, with a wave of orders placed during a one minute period shortly after the Shanghai Gold Exchange opened on Monday. Within a further minute, the deals had been completed, sending the most-active U.S. gold futures contract down $48 to as low as $1,080.00 per ounce, its weakest since February 2010. Gold worth $1.3 billion changed hands on the Chinese and U.S. markets and the lack of liquidity on a day when Japanese markets were closed for a holiday hastened the slide.
A looming increase in U.S. interest rates has driven gold's recent descent along with sluggish demand in top consumers China and India. China disclosed on Friday a 57 percent increase in its gold reserves from 2009, far less than the market had estimated. Investors have found less and less reason to hold gold as a safe haven following the international financial crisis, with the dollar strengthening before what is expected to be the first increase in U.S. interest rates in nearly a decade.
| |
|
2014 |
2015 |
% Change |
|
Index |
Dec 31 |
July 17 |
July 24 |
Week |
2015 |
| Asia/Pacific |
|
|
|
|
|
|
| Australia |
All Ordinaries |
5388.6 |
5652.5 |
5556.8 |
-1.7% |
3.1% |
| Japan |
Nikkei 225 |
17450.8 |
20650.9 |
20544.5 |
-0.5% |
17.7% |
| Hong Kong |
Hang Seng |
23605.0 |
25415.3 |
25128.5 |
-1.1% |
6.5% |
| S. Korea |
Kospi |
1915.6 |
2076.8 |
2046.0 |
-1.5% |
6.8% |
| Singapore |
STI |
3365.2 |
3353.5 |
3352.7 |
0.0% |
-0.4% |
| China |
Shanghai Composite |
3234.7 |
3957.4 |
4070.9 |
2.9% |
25.9% |
|
|
|
|
|
|
|
| India |
Sensex 30 |
27499.4 |
28463.3 |
28112.3 |
-1.2% |
2.2% |
| Indonesia |
Jakarta Composite |
5227.0 |
4869.9 |
4856.6 |
-0.3% |
-7.1% |
| Malaysia |
KLCI |
1761.3 |
1726.7 |
1720.8 |
-0.3% |
-2.3% |
| Philippines |
PSEi |
7230.6 |
7617.1 |
7665.52 |
0.6% |
6.0% |
| Taiwan |
Taiex |
9307.3 |
9046.0 |
8767.9 |
-3.1% |
-5.8% |
| Thailand |
SET |
1497.7 |
1479.3 |
1438.1 |
-2.8% |
-4.0% |
|
|
|
|
|
|
|
| Europe |
|
|
|
|
|
|
| UK |
FTSE 100 |
6566.1 |
6775.1 |
6579.8 |
-2.9% |
0.2% |
| France |
CAC |
4272.8 |
5124.4 |
5057.4 |
-1.3% |
18.4% |
| Germany |
XETRA DAX |
9805.6 |
11673.4 |
11347.5 |
-2.8% |
15.7% |
| Italy |
FTSE MIB |
19012.0 |
23765.4 |
23507.7 |
-1.1% |
23.6% |
| Spain |
IBEX 35 |
10279.5 |
11480.7 |
11309.3 |
-1.5% |
10.0% |
| Sweden |
OMX Stockholm 30 |
1464.6 |
1635.5 |
1612.8 |
-1.4% |
10.1% |
| Switzerland |
SMI |
8983.4 |
9446.2 |
9323.0 |
-1.3% |
3.8% |
|
|
|
|
|
|
|
| North America |
|
|
|
|
|
|
| United States |
Dow |
17823.1 |
18086.5 |
17568.5 |
-2.9% |
-1.4% |
|
NASDAQ |
4736.1 |
5210.1 |
5088.6 |
-2.3% |
7.4% |
|
S&P 500 |
2058.9 |
2126.6 |
2079.7 |
-2.2% |
1.0% |
| Canada |
S&P/TSX Comp. |
14632.4 |
14642.8 |
14186.2 |
-3.1% |
-3.0% |
| Mexico |
Bolsa |
43145.7 |
45325.4 |
44249.5 |
-2.4% |
2.6% |
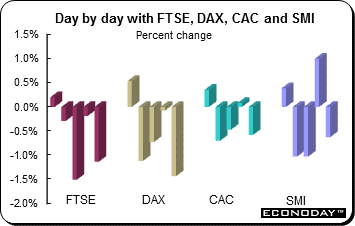 Equities slumped with commodity shares tracking the sharp decline in mining and oil prices. Shares were negatively hit Friday after China's flash manufacturing PMI contracted for a fifth month. For the week, the FTSE lost 2.9 percent, the CAC declined 1.3 percent, the DAX dropped 2.8 percent and the SMI retreated 1.3 percent. The FTSE's decline is its worst since early December when it tumbled 6.5 percent. Although the UK is not a big commodities producer, the FTSE dropped as a slump in commodities from iron ore to copper sent their producers' shares tumbling. Commodity firms retreated over ebbing demand in China alongside global oversupply. Equities slumped with commodity shares tracking the sharp decline in mining and oil prices. Shares were negatively hit Friday after China's flash manufacturing PMI contracted for a fifth month. For the week, the FTSE lost 2.9 percent, the CAC declined 1.3 percent, the DAX dropped 2.8 percent and the SMI retreated 1.3 percent. The FTSE's decline is its worst since early December when it tumbled 6.5 percent. Although the UK is not a big commodities producer, the FTSE dropped as a slump in commodities from iron ore to copper sent their producers' shares tumbling. Commodity firms retreated over ebbing demand in China alongside global oversupply.
Analysts said that the market weakness was mainly due to a sharp decline in commodity stocks and less because of news on Greece. As concerns over Greece continue to ease, investors have shifted their focus to corporate earnings results.
Greece cleared another hurdle and stepped into the bailout zone after the government approved the second set of reform measures early Thursday. Prime Minister Alexis Tsipras is seeking to close a deal that will offer up to £86 billion even as the country faces protests and violence. The reforms, which are the final requirement before the country can start the bailout negotiations with its creditors, included lifting of liquidity of banks and deposit security. Meetings with the troika will take place in Athens.
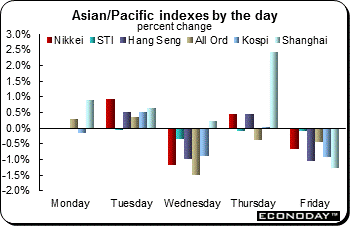 Most equity indexes retreated last week thanks to some disappointing U.S. earnings reports and at week's end, China's manufacturing PMI which crumbled to a 15-month low. The reading rekindled concerns for the region's exports as China's economy struggles to arrest a broad downturn. The Shanghai Composite advanced four of five days to increase 2.9 percent on the week. However, the Hang Seng lost 1.1 percent. Most equity indexes retreated last week thanks to some disappointing U.S. earnings reports and at week's end, China's manufacturing PMI which crumbled to a 15-month low. The reading rekindled concerns for the region's exports as China's economy struggles to arrest a broad downturn. The Shanghai Composite advanced four of five days to increase 2.9 percent on the week. However, the Hang Seng lost 1.1 percent.
The three week rebound comes amid heavy-handed intervention measures from the government. The stock regulator has said the central bank would inject cash into regulator owned fund China Securities Financial Corp. which helps brokerages finance loans for stock buying. The flash manufacturing PMI dropped to 48.2 and the lowest reading since April last year. It was the fifth straight month below 50, the level which separates contraction from expansion. The weak PMI came on the heels of some gloomy data elsewhere in the region. South Korea's economy recorded its weakest expansion in six years for the second quarter while Japanese exports to China were relatively weak, reviving concerns of slowing corporate profits across Asia. The Australian dollar, which investors use as a liquid proxy for risk in China, slumped to six year low. The All Ordinaries were down 1.7 percent for the week.
The Nikkei declined 0.5 percent for the week. Japanese shares hit a 1-1/2 week low Friday as disappointing U.S. earnings and the sluggish Chinese data overshadowed optimism over domestic earnings. Also dampening sentiment was the IMF's warning that Japan's debt could rise three times the size of its economy by 2030 and that the country shouldn't rely too much on the weak yen to boost growth.
Reserve Bank of India
India's Ministry of Finance released a draft regulation aimed at revamping the decision making processes at the Reserve Bank of India as the two institutions negotiate changes in the way monetary policy is set by the RBI. In a draft of the Indian Financial Code circulated for public discussion, the finance ministry proposed the setting up of a seven member Monetary Policy Committee that would set interest rates. Now, India's RBI governor is advised by a technical committee, but is the one to make the final decision on rates. The debate on how India should revamp its monetary policy framework has been ongoing for months. According to the draft, the ministry would appoint four members while the RBI would choose the remaining three. The proposal strips the RBI governor of his power to set rates alone, but suggests that he casts a second vote in the event of a tie in the MPC. At stake is the RBI's independence, which is not enshrined in its 1930s founding charter. The RBI has routinely come under political pressure from New Delhi to cut rates to spur growth.
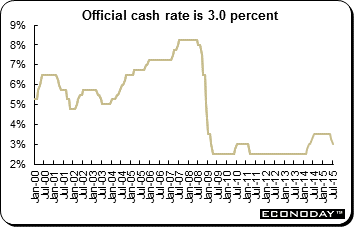 As broadly anticipated, the RBNZ lowered its overnight cash rate (OCR) by 25 basis points to 3.0 percent. The Bank has now lowered its OCR at three consecutive meetings and indicated that further cuts were likely. The RBNZ joins counterparts in Canada and Australia in responding to falling commodity prices. The Bank of Canada this month cut its benchmark rate for a second time this year as lower oil prices cut growth in the first half of the year. The Reserve Bank of Australia has also cut rates twice in 2015 as a mining boom dwindles. As broadly anticipated, the RBNZ lowered its overnight cash rate (OCR) by 25 basis points to 3.0 percent. The Bank has now lowered its OCR at three consecutive meetings and indicated that further cuts were likely. The RBNZ joins counterparts in Canada and Australia in responding to falling commodity prices. The Bank of Canada this month cut its benchmark rate for a second time this year as lower oil prices cut growth in the first half of the year. The Reserve Bank of Australia has also cut rates twice in 2015 as a mining boom dwindles.
The economy has been losing momentum with sharp declines in household and business confidence. Commodity prices have dropped sharply taking them to the lowest level in six years. Almost every product declined. There also has been softness in inflation. Consumer prices rose by only 0.3 percent over the past year. While this is up from the very weak March result, it is still the second slowest pace in 15 years. What have been going up are petrol prices which will weigh on household demand over the coming months. Adding to the challenges for the economy is that one of the major drivers of growth in recent years, the Canterbury rebuild, is starting to dissipate. In recent years, increases in the amount of reconstruction work completed each quarter provided a significant boost to GDP growth and employment.
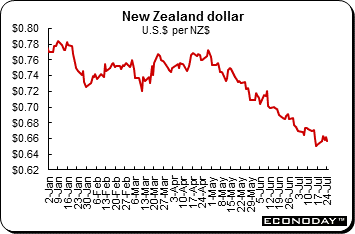 The U.S. dollar was up against the pound sterling, Swiss franc and the Canadian and Australian dollars. However, it was lower against the euro and yen. A slide in Asia-Pacific currencies accelerated Friday amid fresh signs of a deepening slowdown in China. The Australian dollar declined to its weakest level against the U.S. dollar in six years. Friday's move added to existing pressure to regional currencies, as expectations that the Federal Reserve will increase short term interest rates have strengthened the U.S. dollar. The Federal Reserve has its sights on raising rates while the European Central Bank and Bank of Japan are still deeply committed to monetary easing. This is widely expected to favor the dollar in the long term. The U.S. dollar was up against the pound sterling, Swiss franc and the Canadian and Australian dollars. However, it was lower against the euro and yen. A slide in Asia-Pacific currencies accelerated Friday amid fresh signs of a deepening slowdown in China. The Australian dollar declined to its weakest level against the U.S. dollar in six years. Friday's move added to existing pressure to regional currencies, as expectations that the Federal Reserve will increase short term interest rates have strengthened the U.S. dollar. The Federal Reserve has its sights on raising rates while the European Central Bank and Bank of Japan are still deeply committed to monetary easing. This is widely expected to favor the dollar in the long term.
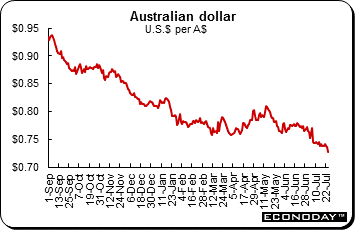 Currencies in the Asia Pacific accelerated their slide Friday as Beijing signaled moves that could threaten regional growth and signs of a deepening slowdown in China emerged. Several currencies in the region hit fresh multi-year lows Friday. The Australian dollar plummeted to its weakest level against the U.S. dollar in six years and Indonesia's rupiah fell to its lowest level in almost two decades. South Korea's won fell to its weakest in three years and Thailand's baht weakened to its worst level since 2009. The pressure on Asian currencies even reached India's rupee and the Philippine peso, which had held up against a broadly strengthening U.S. dollar so far this year. Indonesia's monetary authority said it was watchful for instability in the rupiah, blaming recent weakness on external factors and maintaining that the domestic economy was improving. Currencies in the Asia Pacific accelerated their slide Friday as Beijing signaled moves that could threaten regional growth and signs of a deepening slowdown in China emerged. Several currencies in the region hit fresh multi-year lows Friday. The Australian dollar plummeted to its weakest level against the U.S. dollar in six years and Indonesia's rupiah fell to its lowest level in almost two decades. South Korea's won fell to its weakest in three years and Thailand's baht weakened to its worst level since 2009. The pressure on Asian currencies even reached India's rupee and the Philippine peso, which had held up against a broadly strengthening U.S. dollar so far this year. Indonesia's monetary authority said it was watchful for instability in the rupiah, blaming recent weakness on external factors and maintaining that the domestic economy was improving.
|
|
2014 |
2015 |
% Change |
|
|
Dec 31 |
July 17 |
July 24 |
Week |
2015 |
| U.S. $ per currency |
|
|
|
|
|
|
| Australia |
A$ |
0.8170 |
0.7381 |
0.729 |
-1.3% |
-10.8% |
| New Zealand |
NZ$ |
0.7801 |
0.6527 |
0.657 |
0.7% |
-15.8% |
| Canada |
C$ |
0.8614 |
0.7701 |
0.767 |
-0.4% |
-11.0% |
| Eurozone |
euro (€) |
1.2098 |
1.0846 |
1.098 |
1.2% |
-9.3% |
| UK |
pound sterling (£) |
1.5585 |
1.5608 |
1.551 |
-0.6% |
-0.5% |
|
|
|
|
|
|
|
| Currency per U.S. $ |
|
|
|
|
|
|
| China |
yuan |
6.2055 |
6.2095 |
6.210 |
0.0% |
-0.1% |
| Hong Kong |
HK$* |
7.7546 |
7.7506 |
7.752 |
0.0% |
0.0% |
| Indonesia |
rupiah |
12427 |
13347 |
13447.000 |
-0.7% |
-7.6% |
| India |
rupee |
63.0437 |
63.4738 |
64.043 |
-0.9% |
-1.6% |
| Japan |
yen |
119.8200 |
124.08 |
123.800 |
0.2% |
-3.2% |
| Malaysia |
ringgit |
3.4973 |
3.7968 |
3.810 |
-0.3% |
-8.2% |
| Singapore |
Singapore $ |
1.3246 |
1.3676 |
1.372 |
-0.3% |
-3.5% |
| South Korea |
won |
1090.9800 |
1147.49 |
1167.870 |
-1.7% |
-6.6% |
| Taiwan |
Taiwan $ |
31.6560 |
31.077 |
31.425 |
-1.1% |
0.7% |
| Thailand |
baht |
32.8800 |
34.228 |
34.890 |
-1.9% |
-5.8% |
| Switzerland |
Swiss franc |
0.9942 |
0.9605 |
0.9622 |
-0.2% |
3.3% |
| *Pegged to U.S. dollar |
|
|
|
|
|
|
| Source: Bloomberg |
|
|
|
|
|
|
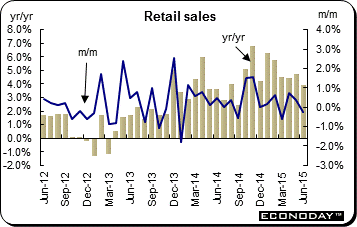 June retail sales retreated 0.3 percent and were up 4.0 percent on the year. June's monthly reversal was only partly a reflection of weaker auto fuel purchases which dropped a slightly steeper 0.3 percent. Rather, the main downward pressure came from household goods (down 0.9 percent) and, in particular, the other stores category (down 3.0 percent). Excluding auto fuel, non-food sales were off 0.7 percent following a 0.4 percent contraction in mid-quarter while food purchases were down 0.3 percent after a 1.4 percent bounce last time. Inflation developments were little changed with the implied deflator for total sales 2.9 percent weaker on the year, matching its May result, and excluding fuel prices 2.1 percent lower. June retail sales retreated 0.3 percent and were up 4.0 percent on the year. June's monthly reversal was only partly a reflection of weaker auto fuel purchases which dropped a slightly steeper 0.3 percent. Rather, the main downward pressure came from household goods (down 0.9 percent) and, in particular, the other stores category (down 3.0 percent). Excluding auto fuel, non-food sales were off 0.7 percent following a 0.4 percent contraction in mid-quarter while food purchases were down 0.3 percent after a 1.4 percent bounce last time. Inflation developments were little changed with the implied deflator for total sales 2.9 percent weaker on the year, matching its May result, and excluding fuel prices 2.1 percent lower.
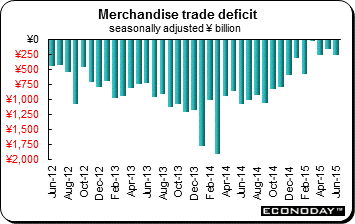 June merchandise trade deficit was Y69.0 billion. Analysts expected a surplus of Y45.8 billion. Exports were up slightly less than expected, at 9.5 percent, while imports dropped less than expected at 2.9 percent. It was the 10th consecutive increase for exports and sixth consecutive drop for imports. The decline in imports reflects the lower value of the yen which makes imports more expensive, but it also reflects weaker consumption. The decline in petroleum prices also dented imports. Exports to Asia were up 10.1 percent on the year while those to China were 5.9 percent higher. Exports to the European Union added 10.8 percent. It was the seventh consecutive increase. Exports to the U.S. climbed for the 10th straight month, this time by 17.6 percent. On a seasonally adjusted basis, the trade deficit was Y251.7 billion. Exports were up 4.4 percent on the month while imports jumped 5.8 percent. June merchandise trade deficit was Y69.0 billion. Analysts expected a surplus of Y45.8 billion. Exports were up slightly less than expected, at 9.5 percent, while imports dropped less than expected at 2.9 percent. It was the 10th consecutive increase for exports and sixth consecutive drop for imports. The decline in imports reflects the lower value of the yen which makes imports more expensive, but it also reflects weaker consumption. The decline in petroleum prices also dented imports. Exports to Asia were up 10.1 percent on the year while those to China were 5.9 percent higher. Exports to the European Union added 10.8 percent. It was the seventh consecutive increase. Exports to the U.S. climbed for the 10th straight month, this time by 17.6 percent. On a seasonally adjusted basis, the trade deficit was Y251.7 billion. Exports were up 4.4 percent on the month while imports jumped 5.8 percent.
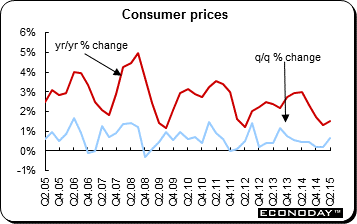 June quarter consumer prices were up 0.7 percent on the quarter after increasing 0.2 percent in the March quarter. The increase was slightly below expectations of an 0.8 percent quarterly increase. On the year, the CPI was up 1.5 percent. The most significant price increases in this quarter were in automotive fuel (up 12.2 percent), medical & hospital services (up 4.5 percent) and new dwelling purchase by owner–occupiers (up 1.5 percent). The increases were partially offset by declines in domestic holiday travel & accommodation (down 5.4 percent) and pharmaceutical products (down 1.8 percent). The increase in fuel is registered in four of the five fuel types with the quarterly rise the largest since December 1990. The trimmed mean inflation, the RBA's preferred measure because it strips out volatile prices, was up 2.2 percent on the year and below the March quarter reading of 2.3 percent. The weighted mean was up 2.4 percent after 2.4 percent in the previous quarter. The Reserve Bank of Australia's inflation target range is 2 percent to 3 percent. Should the RBA decide to spur the economy with another cut to interest rates, the threat of inflation should not stand in the way. June quarter consumer prices were up 0.7 percent on the quarter after increasing 0.2 percent in the March quarter. The increase was slightly below expectations of an 0.8 percent quarterly increase. On the year, the CPI was up 1.5 percent. The most significant price increases in this quarter were in automotive fuel (up 12.2 percent), medical & hospital services (up 4.5 percent) and new dwelling purchase by owner–occupiers (up 1.5 percent). The increases were partially offset by declines in domestic holiday travel & accommodation (down 5.4 percent) and pharmaceutical products (down 1.8 percent). The increase in fuel is registered in four of the five fuel types with the quarterly rise the largest since December 1990. The trimmed mean inflation, the RBA's preferred measure because it strips out volatile prices, was up 2.2 percent on the year and below the March quarter reading of 2.3 percent. The weighted mean was up 2.4 percent after 2.4 percent in the previous quarter. The Reserve Bank of Australia's inflation target range is 2 percent to 3 percent. Should the RBA decide to spur the economy with another cut to interest rates, the threat of inflation should not stand in the way.
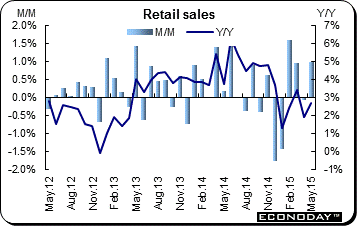 May retail sales advanced 1.0 percent on the month lifting annual growth of purchases to 2.7 percent, up from a firmer revised 1.9 percent in April. However, volumes performed more sedately and a 0.4 percent monthly increase here made for a 2.5 percent increase from May 2014. There were monthly increases in nine of the 11 reporting subsectors. Motor vehicles & parts advanced 1.3 percent thanks to a 2.0 percent jump in new vehicles but even excluding this category purchases were up a solid 0.9 percent. Elsewhere, gasoline was up 1.9 percent and electronics & appliance stores 6.1 percent. Food & drink recorded a 0.6 percent gain and general merchandise climbed 0.7 percent. The main decline came from sporting goods, hobby, book & music stores (1.8 percent) ahead of clothing & accessories (0.5 percent). May retail sales advanced 1.0 percent on the month lifting annual growth of purchases to 2.7 percent, up from a firmer revised 1.9 percent in April. However, volumes performed more sedately and a 0.4 percent monthly increase here made for a 2.5 percent increase from May 2014. There were monthly increases in nine of the 11 reporting subsectors. Motor vehicles & parts advanced 1.3 percent thanks to a 2.0 percent jump in new vehicles but even excluding this category purchases were up a solid 0.9 percent. Elsewhere, gasoline was up 1.9 percent and electronics & appliance stores 6.1 percent. Food & drink recorded a 0.6 percent gain and general merchandise climbed 0.7 percent. The main decline came from sporting goods, hobby, book & music stores (1.8 percent) ahead of clothing & accessories (0.5 percent).
Markets were jittery thanks to mixed earnings reports with little positive economic data to offset. Flash June manufacturing PMI data were mixed. One needed to be two handed to understand U.S. June housing data — existing home sales posted strong results while new home sales retreated. Australia's second quarter consumer price index showed no inflation threat.
Virtually no one is anticipating a policy move at Tuesday and Wednesday's FOMC meeting, while at the same time, it only brings September and its expectations for the Fed to begin normalizing policy that much closer. The coming week makes up for this week's lack of new economic data. It is the last week of the month so Japan will release a slew of data for June.
| Central Bank activities |
|
| July 28, 29 |
United States |
FOMC Meeting and Announcement |
|
|
|
| The following indicators will be released this week... |
| Europe |
|
|
| July 27 |
Eurozone |
M3 Money Supply (June) |
|
Germany |
Retail Sales (June) |
|
|
Ifo Business Survey (July) |
| July 28 |
UK |
Gross Domestic Product (Q2.2015, first estimate) |
| July 30 |
Eurozone |
EC Economic Sentiment (July) |
|
Germany |
Unemployment (July) |
| July 31 |
Eurozone |
Harmonized Index of Consumer Prices (July, preliminary) |
|
|
Unemployment (June) |
|
France |
Consumption of Manufactured Goods (June) |
|
|
Producer Price Index (June) |
|
|
|
| Asia/Pacific |
|
|
| July 29 |
Japan |
Retail Sales (June) |
| July 30 |
Japan |
Industrial Production (June) |
| July 31 |
Japan |
Consumer Price Index (June) |
|
|
Household Spending (June) |
|
|
Unemployment (June) |
|
|
|
| Americas |
|
|
| July 28 |
Canada |
Industrial Product Price Index (June) |
| July 31 |
Canada |
Monthly Gross Domestic Product (May) |
Anne D Picker is the author of International Economic Indicators and Central Banks.
|
