|
Activity in the housing sector is brewing, if not always sales and prices unfortunately. But homes are coming into the market and housing looks to be a central plus for the second-half of the year. But the economy as a whole looks flat, much as it has through this cycle's long recovery.
Housing data dominated the week's calendar and, on net, the news is good. Existing home sales were very strong in June, up 3.2 percent to a higher-than-expected annual rate of 5.49 million which is the best since the bubble days of February 2007. June's gain was on top of May's revised 4.5 percent jump. These gains aren't getting a boost from low priced distressed homes where sales, at only 8 percent of June's total, are suddenly at record lows. And the gains aren't getting any boost from first-time buyers who, content to rent and  unimpressed by the dream of owning your own home, are making up a decreasing share of 30 percent of total sales. unimpressed by the dream of owning your own home, are making up a decreasing share of 30 percent of total sales.
Month-to-month readings in the existing home sales report are comparatively stable unlike the new homes report where volatility, due to a small sample size, can be extreme, as it was in the June report where the headline plunged 6.8 percent to a far lower-than-expected annual rate of 482,000. And there was more bad news as revisions erased 40,000 from the prior two months. As the accompanying graph shows, new home sales are struggling with three declines in the last four months. In contrast, existing home sales are climbing fast, posting four gains in five months.
 But there is good news for new homes and that's a surge in supply, up 3.4 percent to a 5-year high at 215,000. The gain here was signaled by the housing starts & permits report where completions surged in both May and June. Housing under construction has been climbing and homes not yet started has been climbing. Permits, of course, have been rising strongly, up three straight months capped by a 7.4 percent surge in June. Supply of existing homes for sale is also on the climb, rising 0.9 percent in June to 2.3 million following May's 2.7 percent jump. But there is good news for new homes and that's a surge in supply, up 3.4 percent to a 5-year high at 215,000. The gain here was signaled by the housing starts & permits report where completions surged in both May and June. Housing under construction has been climbing and homes not yet started has been climbing. Permits, of course, have been rising strongly, up three straight months capped by a 7.4 percent surge in June. Supply of existing homes for sale is also on the climb, rising 0.9 percent in June to 2.3 million following May's 2.7 percent jump.
One of the effects of the rise in supply may be to hold down pricing and help shift housing toward a buyer's market. Price appreciation of late has been moderate to respectable which is evident in the week's report from FHFA. Its house price index for May rose 0.4 percent for a second straight month. Year-over-year, the FHFA reading is a solid plus 5.7 percent which is the best rate since April last year. The index is now about where it was way back in 2006 suggesting that home equity has finally recouped the big losses of the bubble, the bubble of course that probably turned off those elusive first-time buyers. The graph compares the FHFA index, which tracks mortgage transactions for existing homes securitized by Fannie Mae or Freddie Mac, against Case-Shiller which also tracks prices of existing homes. Both curves are similar and are on a slow climb.
Manufacturing absolutely has the most reasons to complain of any sector in the economy. The strong dollar is killing off exports while the prior collapse in oil prices continues to depress equipment investment in the energy sector. The latter is the unwanted theme in a long run of manufacturing reports from the Kansas City and Dallas Feds where the data are definitely dismal.
 For Kansas City, deep continuing contraction is the score with the headline index little changed in July at minus 7. Order readings point to more trouble ahead with new orders at minus 6 and backlog orders at minus 14. Weakness in export orders, at minus 10, is a central negative for the report, as is hiring, at minus 19 and the workweek at minus 18. Price readings are steady and mute. And reports from the Dallas Fed have been even worse. The accompanying graph compares Kansas City with Dallas where contraction started to take hold at the beginning of the year and has hardly let up. The Dallas report for July will be posted on Monday's calendar following durable goods orders which, in major national data, have been on their own slide. For Kansas City, deep continuing contraction is the score with the headline index little changed in July at minus 7. Order readings point to more trouble ahead with new orders at minus 6 and backlog orders at minus 14. Weakness in export orders, at minus 10, is a central negative for the report, as is hiring, at minus 19 and the workweek at minus 18. Price readings are steady and mute. And reports from the Dallas Fed have been even worse. The accompanying graph compares Kansas City with Dallas where contraction started to take hold at the beginning of the year and has hardly let up. The Dallas report for July will be posted on Monday's calendar following durable goods orders which, in major national data, have been on their own slide.
 Economic growth this cycle, like job growth, has been very soft — an important point to note when considering that the Fed's target interest rate is still near zero (technically between zero and 0.25 percent). The national activity index, published by the Chicago Fed, is based on a full slate of monthly indicators. This index, as seen on the graph, has been hovering near the zero line for the last four years and has been a little below it most of this year. A reading below zero indicates historically sub-par growth. Yet the index did pop up unexpectedly into the plus column in June, but not by much, to only plus 0.08. And the 3-month average, the dark blue line on the graph, is still in the negative column though just barely at minus 0.01. The improvement in June isn't convincing and reflects, at least in part, what are likely to be one-time spikes for both utility and mining output and the outsized 2 tenth dip in the unemployment rate, a dip that was due not to a rise in employment but to an increase in those dropping out of the workforce. Economic growth this cycle, like job growth, has been very soft — an important point to note when considering that the Fed's target interest rate is still near zero (technically between zero and 0.25 percent). The national activity index, published by the Chicago Fed, is based on a full slate of monthly indicators. This index, as seen on the graph, has been hovering near the zero line for the last four years and has been a little below it most of this year. A reading below zero indicates historically sub-par growth. Yet the index did pop up unexpectedly into the plus column in June, but not by much, to only plus 0.08. And the 3-month average, the dark blue line on the graph, is still in the negative column though just barely at minus 0.01. The improvement in June isn't convincing and reflects, at least in part, what are likely to be one-time spikes for both utility and mining output and the outsized 2 tenth dip in the unemployment rate, a dip that was due not to a rise in employment but to an increase in those dropping out of the workforce.
 Many of us may not be employed as much as we would want, perhaps taking two part-time jobs to get by. But under employment isn't showing up in jobless claims data where the week's most startling results came out. Initial claims plunged 26,000 in the July 18 week to a 42-year low of 255,000. That's right. That's going all the way back to the early '70s. But a look at the 4-week average, which helps smooth out volatility, is less startling, down 4,000 to a 278,500 level that's right in line with the recent trend as tracked by the dark line on the graph. Continuing data, where data lag by a week, also fell, down 9,000 to a new multi-year low of 2.207 million with the 4-week average down 10,000 to a 2.254 million level that is also steady on trend. The unemployment rate for insured workers is steady at a very low 1.6 percent. Many of us may not be employed as much as we would want, perhaps taking two part-time jobs to get by. But under employment isn't showing up in jobless claims data where the week's most startling results came out. Initial claims plunged 26,000 in the July 18 week to a 42-year low of 255,000. That's right. That's going all the way back to the early '70s. But a look at the 4-week average, which helps smooth out volatility, is less startling, down 4,000 to a 278,500 level that's right in line with the recent trend as tracked by the dark line on the graph. Continuing data, where data lag by a week, also fell, down 9,000 to a new multi-year low of 2.207 million with the 4-week average down 10,000 to a 2.254 million level that is also steady on trend. The unemployment rate for insured workers is steady at a very low 1.6 percent.
Claims data during July are often volatile, reflecting statistical adjustments tied to annual retooling in the auto sector and, as the Labor Department is now noting, to retooling in the textile sector as well. Factory retooling leads to temporary layoffs which can have outsized temporary effects on jobless claims. Still, initial claims, even excluding the latest dip, are remarkably low.
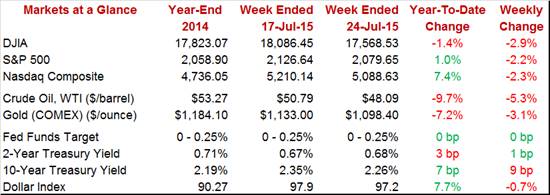
 It wasn't the week's economic data that occupied the stock market but rather corporate earnings and outlooks which are looking soft out of both the technology sector and the industrial sector. The Dow Industrials posted a big loss in the week, falling below 18,000 once again with a 2.9 percent dive to 17,568. The Dow is now in the red this year at minus 1.4 percent. And gold saw a lot of action in the week, actually on Monday when a sudden rush of orders sent the metal down to the $1,100 level where it continues to test support. For gold, lack of inflation and the Fed's pending rate hike haven't been a good mix. For oil, it's the prospect of Iranian exports that's the biggest negative. Oil fell even more sharply than gold during the week and is down under $50 near $48. Showing strength in the week was Treasuries where, despite the pending rate hike and easing of safe-haven demand, the 10-year yield fell a sizable 9 basis points for a second straight week, ending at 2.26 percent. It wasn't the week's economic data that occupied the stock market but rather corporate earnings and outlooks which are looking soft out of both the technology sector and the industrial sector. The Dow Industrials posted a big loss in the week, falling below 18,000 once again with a 2.9 percent dive to 17,568. The Dow is now in the red this year at minus 1.4 percent. And gold saw a lot of action in the week, actually on Monday when a sudden rush of orders sent the metal down to the $1,100 level where it continues to test support. For gold, lack of inflation and the Fed's pending rate hike haven't been a good mix. For oil, it's the prospect of Iranian exports that's the biggest negative. Oil fell even more sharply than gold during the week and is down under $50 near $48. Showing strength in the week was Treasuries where, despite the pending rate hike and easing of safe-haven demand, the 10-year yield fell a sizable 9 basis points for a second straight week, ending at 2.26 percent.
The economy is mostly chugging along, on a slow build boosted perhaps by the housing sector and also perhaps by a mostly healthy labor market. But the latest news isn't roaring and isn't pulling forward expectations for the Fed's rate liftoff which is still between the September and December meetings. The July meeting, coming up on the 28th and 29th, appears certain to be a free pass for no action.
Manufacturing opens the week with durable goods where orders have been struggling. Housing and the consumer, two positives for the economy, are Tuesday's focus with Case-Shiller home price data and the consumer confidence report. Wednesday morning, pending home sales will offer leading indications on housing but attention will be on the mid-afternoon FOMC announcement and updates on the Fed's view of the economy and monetary policy. The first look at second-quarter GDP, seen at a moderate plus 2.9 percent, will dominate Thursday's headlines while the employment cost index, a very closely watched gauge for wage inflation, will be the talk on Friday.
Durables goods orders are expected to be dominated once again by monthly swings in Boeing orders which surged in June. But strength is seen outside of transportation as well with forecasters calling for a second straight 0.5 percent gain for this reading. The durables report has been very weak this year including flat readings for the closely watched capital goods group.
Durable Goods Orders - Consensus Forecast for June: +3.1%
Range: +0.6% to +6.4%
Durable Goods Orders, Ex-Transportation - Consensus Forecast for June: +0.5%
Range: +0.0% to +1.0%
The Case-Shiller home price index is expected to rise a moderate 0.3 percent in May but the year-on-year rate is seen posting a very solid gain to plus 5.6 percent from April's 4.9 percent. This report, as well as the FHFA housing price index, are on steady moderate climbs consistent with underlying strength in existing home sales.
Case-Shiller 20-City Adjusted M/M - Consensus Forecast for May: +0.3%
Range: -0.2% to +0.6%
Case-Shiller 20-City Unadjusted Y/Y - Consensus Forecast for May: +5.6%
Range: +5.2% to +5.8%
No acceleration is expected for the services PMI where, for the July flash, forecasters are calling for no change at 54.8. A rise in new orders was the only positive in the June report when output and hiring both slowed. The flash report for June was one of the first to signal lack of strength for the June economy.
Services PMI, flash - Consensus Forecast for July: 54.8
Range: 54.7 to 55.0
Consumer confidence is expected to ease back slightly to 99.6 in July vs June's 101.4. But levels in this report, especially for the expectations component, have been very strong.
Consumer Confidence - Consensus Forecast for July: 99.6
Range: 97.0 to 102.0
After running in the negative column earlier in the year, the Richmond Fed manufacturing survey has been picking up steam. New orders and backlog orders have been especially solid in prior reports pointing to building strength for future reports.
Richmond Fed - Consensus Forecast for July: 7.5
Range: 5.0 to 12.0
Pending home sales have been sending consistent signals of strength in the existing home sales market. A very solid 1.0 percent gain is expected for June which would follow gains of 0.9 percent in May and 2.7 percent in April.
Pending Home Sales - Consensus Forecast for June: +1.0%
Range: +0.4% to +2.5%
GDP is expected to rise 2.9 percent in the second quarter in what would be only a moderate bounce from the 0.2 percent contraction of the first quarter. Consumer spending is expected to show comparative strength in the second quarter along with residential investment. Exports, however, remain a trouble spot for the economy.
Real GDP, First Estimate - Consensus Forecast for Second Quarter: +2.9%
Range: +1.9% to +3.5%
GDP Price Index, First Estimate - Consensus Forecast for Second Quarter: +1.5%
Range: -0.1% to +2.0%
Jobless claims are at extremely low levels, underscored by the startling 26,000 fall in the July 18 week to a 42-year low at 255,000. Even a sharp reversal in the July 25 week would not change the signals from this report, that the unemployment side of the labor market is very favorable.
Jobless Claims - Consensus Forecast for July 25 week: 272,000
Range: 270,000 to 275,000
The employment cost index has been running hot and a sharp gain of 0.6 percent is expected for the second-quarter. Strong gains in this report would make news at the Fed and would likely be cited in short order by policy makers, especially the hawks.
Employment Cost Index - Consensus Forecast for Second Quarter: +0.6%
Range: +0.5% to +0.9%
The Chicago PMI has been surprisingly depressed in recent months with employment down and, pointing to future trouble for employment, backlog orders also down. Forecasters see no change for July with the consensus at 50 even.
Chicago PMI - Consensus Forecast for July: 50.0
Range: 49.5 to 53.8
The mid-month flash for consumer sentiment fell sharply to 93.3, and an 8 tenth rebound to 94.1 is expected for the final reading. The current conditions component was especially weak in the flash report hinting at month-to-month weakness for consumer spending.
Consumer Sentiment - Consensus Forecast for July, final: 94.1
Range: 93.5 to 97.1
|
