|
The July employment report isn't spectacular but it is strong enough, and if followed by similar strength in the August employment report, then a rate hike at the September FOMC is a lock. Vehicle sales also proved to be a positive for July as were updates out of the nation's services sector.
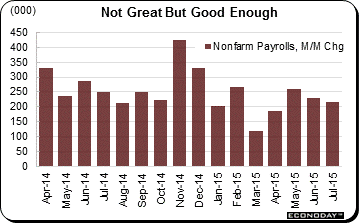 Back in June, a dovish sounding Janet Yellen was stressing that nonfarm payroll growth of 210,000, which was the 3-month average at the time, was well short of the 280,000 average of second-half 2014. But this comparison appears to be ancient history and isn't likely to be repeated anytime soon, by the doves or anyone else at the Fed. Since June, the Fed has been more upbeat about the labor market and less ambitious for payroll growth. In a move to downplay the degree of labor market strength needed to trigger the pending rate hike, the "further improvement" wording for job growth in the June FOMC statement was downgraded to "some further improvement" in the July statement. Against this new backdrop, July's growth of 215,000 together with a similar 200,000-plus outcome in the next jobs report for August are probably all it would take, at least it would seem, to ensure that the Fed will raise its policy rate at the September FOMC. Back in June, a dovish sounding Janet Yellen was stressing that nonfarm payroll growth of 210,000, which was the 3-month average at the time, was well short of the 280,000 average of second-half 2014. But this comparison appears to be ancient history and isn't likely to be repeated anytime soon, by the doves or anyone else at the Fed. Since June, the Fed has been more upbeat about the labor market and less ambitious for payroll growth. In a move to downplay the degree of labor market strength needed to trigger the pending rate hike, the "further improvement" wording for job growth in the June FOMC statement was downgraded to "some further improvement" in the July statement. Against this new backdrop, July's growth of 215,000 together with a similar 200,000-plus outcome in the next jobs report for August are probably all it would take, at least it would seem, to ensure that the Fed will raise its policy rate at the September FOMC.
The jobs numbers for July aren't spectacular but they're respectable and show no major weaknesses. The 215,000 print hit expectations while upward revisions added 14,000 to the two prior months. The industry breakdown is very solid with few declines and led by a 60,000 rise for trade & transportation in a third straight strong gain. Professional & business services rose 40,000 to extend their long healthy run. Retailers continue to add jobs, up 36,000 for their third straight strong gain and with the motor vehicle subset up 13,000 reflecting the strength underway in car sales. Manufacturing, where payrolls are usually weak, rose a solid 15,000 in the month with construction, where lack of skilled labor is being reported, showing only a modest gain of 6,000.
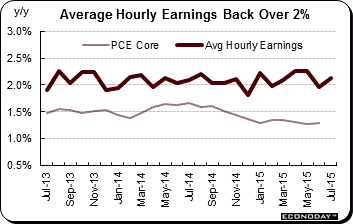 Another sign of strength is traction in average hourly earnings, up 0.2 percent in the month and lifting the year-on-year rate, which had been toying at a recovery high early in the spring, back over 2 percent to 2.1 percent. For the inflation picture, this gain will boost confidence among policy makers that wages should help offset continuing weakness in commodities and help boost core inflation toward the Fed's 2 percent policy goal. But here's where the doves have a chance. As the graph shows, core PCE inflation, the light line at the bottom, is not showing much strength at all and in fact has been sagging in the wrong direction, below the 1.5 year-on-year percent line for most of this year. Another factor for the doves is the recent employment cost index which, in contrast to average hourly earnings, is showing record weakness. Another sign of strength is traction in average hourly earnings, up 0.2 percent in the month and lifting the year-on-year rate, which had been toying at a recovery high early in the spring, back over 2 percent to 2.1 percent. For the inflation picture, this gain will boost confidence among policy makers that wages should help offset continuing weakness in commodities and help boost core inflation toward the Fed's 2 percent policy goal. But here's where the doves have a chance. As the graph shows, core PCE inflation, the light line at the bottom, is not showing much strength at all and in fact has been sagging in the wrong direction, below the 1.5 year-on-year percent line for most of this year. Another factor for the doves is the recent employment cost index which, in contrast to average hourly earnings, is showing record weakness.
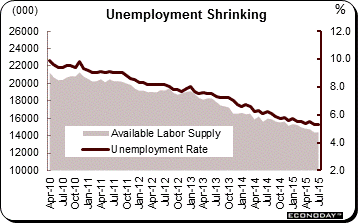 A likely plus for wages, even if it hasn't proven to be so far, is lack of slack in the labor market. The unemployment rate, which fell a sharp 2 tenths in June, held unchanged in July at a recovery low 5.3 percent. The pool of available workers continues to dry up, down an incremental 26,000 to 14.4 million. The graph compares these two measures which have fallen together through the recovery in steady fashion. The further these trends extend, the greater the talk that policy makers may be falling behind the inflation curve. In a further sign of declining labor slack, the U-6 unemployment rate, a broadly defined rate that Yellen refers to often, also declined, down 1 tenth to 10.4 percent. A likely plus for wages, even if it hasn't proven to be so far, is lack of slack in the labor market. The unemployment rate, which fell a sharp 2 tenths in June, held unchanged in July at a recovery low 5.3 percent. The pool of available workers continues to dry up, down an incremental 26,000 to 14.4 million. The graph compares these two measures which have fallen together through the recovery in steady fashion. The further these trends extend, the greater the talk that policy makers may be falling behind the inflation curve. In a further sign of declining labor slack, the U-6 unemployment rate, a broadly defined rate that Yellen refers to often, also declined, down 1 tenth to 10.4 percent.
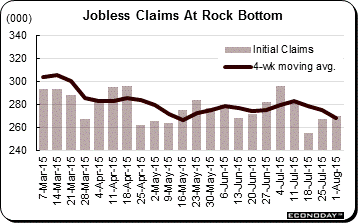 But the doves typically downplay labor market tightness, saying that many workers are still under employed and that businesses are reluctant to hire full time. Payroll growth may be no better than moderate but layoffs are down, as indicated by the unemployment rate and available labor supply and also by jobless claims. As seen in the graph, the latest initial claims level, at 270,000 in the August 1st week, is holding very near the 42-year low hit in the July 15th week at 255,000. All the readings in the claims report, including the unemployment rate for insured workers which is at only 1.7 percent, point to declining slack in the labor market. But the doves typically downplay labor market tightness, saying that many workers are still under employed and that businesses are reluctant to hire full time. Payroll growth may be no better than moderate but layoffs are down, as indicated by the unemployment rate and available labor supply and also by jobless claims. As seen in the graph, the latest initial claims level, at 270,000 in the August 1st week, is holding very near the 42-year low hit in the July 15th week at 255,000. All the readings in the claims report, including the unemployment rate for insured workers which is at only 1.7 percent, point to declining slack in the labor market.
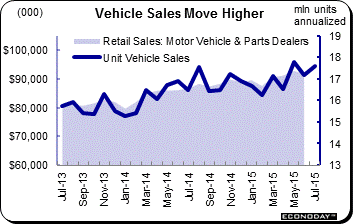 Jobs data aren't the only numbers we have for July so far. Auto manufacturers posted their sales early in the week and, in what proved to be a harbinger of sorts for July's employment report, the results point to consumer strength. Vehicle sales rose 3.2 percent from June to a 17.6 million annual rate that was well above expectations. Vehicle sales have been very strong the last several months, peaking at 17.8 million in May. Looking at the graph, vehicle sales, in the dark blue line, are pointing to a rebound for the motor vehicle component of the retail sales report, the shaded area in the graph. Motor vehicle sales make up about 20 percent of the monthly retail sales report with July's edition to be posted on Thursday, August 13th. Jobs data aren't the only numbers we have for July so far. Auto manufacturers posted their sales early in the week and, in what proved to be a harbinger of sorts for July's employment report, the results point to consumer strength. Vehicle sales rose 3.2 percent from June to a 17.6 million annual rate that was well above expectations. Vehicle sales have been very strong the last several months, peaking at 17.8 million in May. Looking at the graph, vehicle sales, in the dark blue line, are pointing to a rebound for the motor vehicle component of the retail sales report, the shaded area in the graph. Motor vehicle sales make up about 20 percent of the monthly retail sales report with July's edition to be posted on Thursday, August 13th.
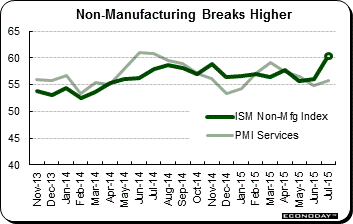 The employment report came in as expected in July, in contrast to the ISM non-manufacturing survey which came in well above expectations. The July index surged an outsized 4.3 points to 60.3 for the highest reading in 10 years. New orders and backlog orders both showed substantial acceleration from June as did new export orders, the latter underscoring the ongoing trade surplus in the nation's services balance which is approaching $20 billion per month. The graph compares the ISM non-manufacturing index with the Services PMI, both trending together in the very solid 55 to 60 range in a reminder that services are the economy's foundation. In a special note, the ISM's employment index jumped to 59.6 for one of the strongest readings on the books and one that correctly guessed the score for July's employment report. ADP, unfortunately adding to its frustratingly spotty record, was the week's big loser, predicting on Wednesday that Friday's employment report would prove a sad flop. The employment report came in as expected in July, in contrast to the ISM non-manufacturing survey which came in well above expectations. The July index surged an outsized 4.3 points to 60.3 for the highest reading in 10 years. New orders and backlog orders both showed substantial acceleration from June as did new export orders, the latter underscoring the ongoing trade surplus in the nation's services balance which is approaching $20 billion per month. The graph compares the ISM non-manufacturing index with the Services PMI, both trending together in the very solid 55 to 60 range in a reminder that services are the economy's foundation. In a special note, the ISM's employment index jumped to 59.6 for one of the strongest readings on the books and one that correctly guessed the score for July's employment report. ADP, unfortunately adding to its frustratingly spotty record, was the week's big loser, predicting on Wednesday that Friday's employment report would prove a sad flop.
 The strength in services has been offsetting weakness all year from manufacturing where, unlike services, exports are down. But, for only the second time in 11 months, factory orders did post a gain, up 1.8 percent in data for June. The strength was tied in part to a routine swing in aircraft orders, this time a swing upwards. But there are solid indications from the report including a respectable gain for capital goods which points to better strength ahead for business investment. The strength in services has been offsetting weakness all year from manufacturing where, unlike services, exports are down. But, for only the second time in 11 months, factory orders did post a gain, up 1.8 percent in data for June. The strength was tied in part to a routine swing in aircraft orders, this time a swing upwards. But there are solid indications from the report including a respectable gain for capital goods which points to better strength ahead for business investment.
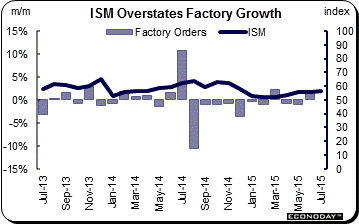
The graph compares factory orders, the light columns, with the dark line of ISM new orders index. This is a closely watched component of the ISM report and is specifically one of 10 components to have the honor of making up the index of leading economic indicators. But the graph shows the limited success of the ISM's measure. ISM's sample of several hundred manufacturers is large for a private survey but is dwarfed by the many thousands in the government's report that together, in any one month, produce 60 percent of total factory shipments. ISM's indexes measure monthly change based on a neutral reading of 50, which is at the center of the graph's right vertical axis. Factory orders measure month-to-month change in percentage terms with zero at the center of the left vertical axis. Note that ISM's new orders, often trending near 60, have never once over the last two years come below 50 to indicate monthly contraction. But monthly contraction is the norm for factory orders which have fallen 14 times in the last two years! The one plus for the ISM report, if not accuracy, is at least timeliness as it comes out, as do many other private surveys, well ahead of the government's report.
Spin doctoring was unusually fierce this week led off by Atlanta Fed president and reformed dove Dennis Lockhart who, now holding a centrist label, told the Wall Street Journal that the economy is fine and September would be perfect for lift off. Fed Governor Jerome Powell then quickly scrambled into play, telling CNBC in an unscheduled interview that it's too early to tell and he's still undecided. The tit-for-tat points to a policy struggle and to deeper jawboning as the September FOMC approaches.
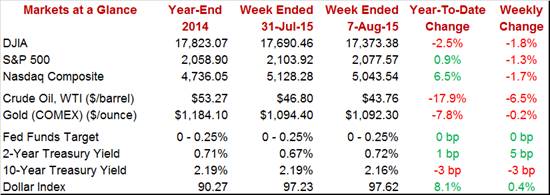
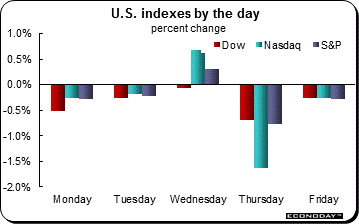 Stocks were down in the week, especially Thursday when questions over the outlook for cable TV sank entertainment stocks. At 17,373, the Dow has lost ground for 8 straight sessions, down 2.5 percent in the week for a year-to-date decline of 1.8 percent. The S&P 500 and the Nasdaq also lost ground in the week but are still up on the year, 0.9 percent for the S&P and 6.5 percent for the Nasdaq. It was another brutal week for oil where WTI fell 6.5 percent to under $44. The year-to-date decline is unexpected and heavy at 18 percent, a factor that will continue to pull down inflation. Of note in the week was a big rise in the usually stable 2-year note yield, to 72 basis points from 67 basis points. The closer we move to lift off, the more pressure is likely to build on short yields. In contrast, the yield on the 10-year note went down in the week, 3 basis points to a very tame 2.16 percent. Stocks were down in the week, especially Thursday when questions over the outlook for cable TV sank entertainment stocks. At 17,373, the Dow has lost ground for 8 straight sessions, down 2.5 percent in the week for a year-to-date decline of 1.8 percent. The S&P 500 and the Nasdaq also lost ground in the week but are still up on the year, 0.9 percent for the S&P and 6.5 percent for the Nasdaq. It was another brutal week for oil where WTI fell 6.5 percent to under $44. The year-to-date decline is unexpected and heavy at 18 percent, a factor that will continue to pull down inflation. Of note in the week was a big rise in the usually stable 2-year note yield, to 72 basis points from 67 basis points. The closer we move to lift off, the more pressure is likely to build on short yields. In contrast, the yield on the 10-year note went down in the week, 3 basis points to a very tame 2.16 percent.
The factory sector has not been a center of strength for the economy which, otherwise, is looking solid. And solid, based on the employment report and vehicle sales, is how July's full slate of economic data will likely unfold. If strengthening data from July does in fact prove to be the theme during August, the bulls should resign themselves to a rate hike in September.
It's a light schedule for data but one that packs a strong one-two punch on Thursday with retail sales and on Friday with industrial production. Retail sales, no matter how they're diced, are expected to show solid gains in July especially for motor vehicles. Industrial production on Friday is also expected show solid gains though not all forecasters agree with some seeing only marginal strength for the manufacturing component. There are also updates on inflation with import & export prices expected to extend their long run of declines while producer prices are expected to show only the most incremental of gains. Inflation may be dormant but gains for retail sales and industrial production would have the doves on the run for the September FOMC.
The labor conditions index is expected to rise but only very slightly, to 1.3 in the June reading vs May's 0.8. This index has been barely over zero and has underscored the still soft rates of employment growth. If based on this index alone, the Fed wouldn't be in any hurry for liftoff.
Labor Market Conditions Index - Consensus Forecast for June: 1.3
Range: 1.0 to 1.5
The small business optimism index is expected to bounce back to 95.0 in July from June's sharp 4.2 point drop to 94.1. June's report was a surprise, signaling weakness for what proved to be a respectable month for the economy. Job openings and expansion plans, two key components, were especially weak in June.
Small Business Optimism Index - Consensus Forecast for July: 95.0
Range: 93.9 to 96.0
Productivity and costs are both expected to posts increases in the second quarter, up 1.6 percent for productivity and reflecting the bounce back for GDP and up 0.5 percent for costs. But Econoday's sample is uncertain for costs with the low estimate at a steep minus 1.2 percent. Should costs cool, it would follow large gains in the prior two quarters.
Nonfarm Productivity Q/Q change- Consensus Forecast for Second Quarter: +1.6%
Range: +0.5% to +2.5%
Unit Labor Costs Q/Q change - Consensus Forecast for Second Quarter: +0.5%
Range: -1.2% to +3.7%
Wholesale inventories are expected to ease to a 0.4 percent gain in data for June vs May's outsized gain of 0.8 percent. Inventories in the wholesale sector had look bloated earlier in the year but have since stabilized, with the stock-to-sales ratio steady in May at 1.29.
Wholesale Inventories - Consensus Forecast for June: +0.4%
Range: +0.1% to +0.6%
Jobless claims are expected to hold at rock bottom levels, at 270,000 for initial claims in the August 8th week. Data throughout this report are at or near historic lows and point to lack of slack in the labor market.
New Claims, Level - Consensus Forecast for August 8 Week: 270,000
Range: 260,000 to 272,000
Retail sales are expected to post a solid 0.5 percent gain in July which, if realized, would turn up talk for a September rate hike. Strength in the July report is expected to be centered in motor vehicles though other components are also expected to have good showings. Both the ex-auto reading and the ex-auto ex-gasoline core reading are expected to rise a very respectable 0.4 percent.
Retail Sales, M/M change - Consensus Forecast for July: +0.5%
Range: +0.2% to +1.0%
Retail Sales Less Autos, M/M change - Consensus Forecast for July: +0.4%
Range: +0.2% to +0.9%
Retail Sales Less Autos & Gas, M/M change - Consensus Forecast For July: +0.4%
Range: +0.2% to +0.5%
Deflationary cross-border price pressures are expected to pull down import and export prices in July. Import prices, in part reflecting the strength of the dollar, are expected to contract for the 11th time in 12 months, down a full 1.0 percent in July. Export prices, reflecting low commodity prices, are expected to fall 0.3 percent which would be the 9th decline in 11 months. This report looks to be a reminder that inflation is not yet picking up steam toward the Fed's 2 percent goal.
Import Prices, M/M change - Consensus Forecast for July: -1.0%
Range: -2.0% to +0.8%
Export Prices M/M change - Consensus Forecast for July: -0.3%
Range: -1.0% to 0.0%
Business inventories are expected to rise 0.3 percent in July in what would be a moderate gain that would not signal unwanted overhang. This report will highlight early calculations for third-quarter inventory growth.
Business Inventories, M/M change - Consensus Forecast for June: +0.3%
Range: +0.2% to +0.5%
The PPI-FD is expected to cool in July, up only 0.1 percent for both the total reading and the ex-food ex-gas core reading. The report in June showed unusual gains but it failed to provide much lift to year-on-year rates where the overall was at minus 0.7 percent and the core at only plus 0.8 percent.
PPI-FD, M/M change - Consensus Forecast for June: +0.1%
Range: -0.2% to +0.3%
PPI-FD Less Food & Energy, M/M change - Consensus Forecast for June: +0.1%
Range: 0.0% to +0.2%
Industrial production is expected to post a solid 0.4 percent gain in July though, in a mixed indication, the capacity utilization rate is expected for slip 3 tenths to 78.1 percent. The manufacturing component is also expected to post a solid 0.4 percent rise, one that would offer an early indication of strength for third-quarter GDP.
Industrial Production, M/M change- Consensus Forecast for July: +0.4%
Range: +0.2% to +0.7%
Capacity Utilization Rate - Consensus Forecast for July: 78.1%
Range: 77.8% to 79.9%
Manufacturing Production, M/M change- Consensus Forecast for July: +0.4%
Range: +0.1% to +0.9%
After easing in July, consumer sentiment is expected to stabilize in the flash August reading, at 93.5 vs July's 93.1. Weakness in July reflected less optimism on the jobs outlook though readings through the report still remained healthy.
Consumer Sentiment Index, Flash - Consensus Forecast for July: 93.5
Range: 92.5 to 97.0
|
