|
The outlook for monetary policy is unusually fluid right now which, if you're in the market, calls for a drink! Labor supply continues to tighten posing a risk of wage inflation where indications, however, remain flat. And job growth itself is flat. The factory sector may or may not be on the rise but construction definitely is, and the consumer is holding steady despite everything.
Something for everyone!
 There are plenty of weak details in the August employment report but the hawks at the FOMC have a major policy point — that the unemployment side of the labor market is getting thinner and thinner. The unemployment rate is down 2 tenths to a recovery low of 5.1 percent and is suddenly right at the 5.0 percent threshold ahead of schedule. Available labor supply, at just under 14 million, fell 440,000 for the steepest monthly decline since December. But judging by the last cycle, there still may be some slack left in the labor market. The unemployment rate held below 5 percent from 2005 to 2007 while labor supply held below 13 million through 2005 and 2006 and moved under 12 million in 2007. Still, full employment, if not already here, is around the corner at the same time that monetary policy remains decidedly stimulative. There are plenty of weak details in the August employment report but the hawks at the FOMC have a major policy point — that the unemployment side of the labor market is getting thinner and thinner. The unemployment rate is down 2 tenths to a recovery low of 5.1 percent and is suddenly right at the 5.0 percent threshold ahead of schedule. Available labor supply, at just under 14 million, fell 440,000 for the steepest monthly decline since December. But judging by the last cycle, there still may be some slack left in the labor market. The unemployment rate held below 5 percent from 2005 to 2007 while labor supply held below 13 million through 2005 and 2006 and moved under 12 million in 2007. Still, full employment, if not already here, is around the corner at the same time that monetary policy remains decidedly stimulative.
 But the doves also have plenty of good points to point to. Nonfarm payroll growth was very low in August, at 173,000 which is the weakest since March and the second weakest since January last year. There were upward revisions to June and July totaling 44,000 but the weakness in the latest month doesn't point to building momentum and doesn't add to any urgency for a rate hike. Private payrolls, excluding government, are even weaker. Private payrolls, as seen in the graph, rose only 140,000 in August for the lowest increase since March and the second lowest since December 2013. Mining and manufacturing both shed jobs in August, a reminder that the price collapse in commodities and oil continues to take a toll on the nation's labor force. But the doves also have plenty of good points to point to. Nonfarm payroll growth was very low in August, at 173,000 which is the weakest since March and the second weakest since January last year. There were upward revisions to June and July totaling 44,000 but the weakness in the latest month doesn't point to building momentum and doesn't add to any urgency for a rate hike. Private payrolls, excluding government, are even weaker. Private payrolls, as seen in the graph, rose only 140,000 in August for the lowest increase since March and the second lowest since December 2013. Mining and manufacturing both shed jobs in August, a reminder that the price collapse in commodities and oil continues to take a toll on the nation's labor force.
 Government payrolls rose a very strong 33,000 in August for a fourth straight gain. But how long will this extend? Growth in this component is typically spotty as seen in the accompanying graph. Still, government jobs are domestic jobs and have a degree of insulation from global slowing. Other domestic industries continue to add jobs including retail, business & professional services, and financial activities. Excluding government, services altogether rose a solid 164,000 which is important to note given the risk, which is certain to be cited by the hawks, of an upward revision to August which is common given adjustment difficulties surrounding the timing of the school year. Government payrolls rose a very strong 33,000 in August for a fourth straight gain. But how long will this extend? Growth in this component is typically spotty as seen in the accompanying graph. Still, government jobs are domestic jobs and have a degree of insulation from global slowing. Other domestic industries continue to add jobs including retail, business & professional services, and financial activities. Excluding government, services altogether rose a solid 164,000 which is important to note given the risk, which is certain to be cited by the hawks, of an upward revision to August which is common given adjustment difficulties surrounding the timing of the school year.
 Besides services, the hawks can also point to steady pressure in wages as average hourly earnings rose an outsized 0.3 percent in August. The year-on-year rate at 2.2 percent doesn't mark an acceleration but is still over the 2 percent line. As seen in the graph, however, the doves have a stronger card to play than average hourly earnings and that of course is the core reading for the PCE price index which, at a year-on-year 1.2 percent, is looking deflationary. Taken together, the unemployment rate may be low and wages may be a risk but job growth isn't trending any higher which makes tightening monetary policy a difficult decision. Besides services, the hawks can also point to steady pressure in wages as average hourly earnings rose an outsized 0.3 percent in August. The year-on-year rate at 2.2 percent doesn't mark an acceleration but is still over the 2 percent line. As seen in the graph, however, the doves have a stronger card to play than average hourly earnings and that of course is the core reading for the PCE price index which, at a year-on-year 1.2 percent, is looking deflationary. Taken together, the unemployment rate may be low and wages may be a risk but job growth isn't trending any higher which makes tightening monetary policy a difficult decision.
 With August employment mixed, China looks to be the deciding factor at the FOMC. China's effect on the domestic economy is likely to unfold slowly compared to the effect on the nation's exports. With China's devaluation hitting at mid-month August, attention has been focused on early anecdotal reports out of the factory sector and whether China is having any immediate impact. The ISM new orders index, which incidentally is one of 10 components of the index of leading economic indicators, slowed noticeably in August, down nearly 5 points to 51.7 to indicate the slowest rate of monthly growth since April 2013. This is an attention grabber for the doves though, as the graph indicates, the ISM's index does not always move in line with actual government data. The ISM index, the dark line, has consistently come in over the breakeven 50 line to indicate month-to-month growth, though factory orders themselves, the columns in the graph, show monthly contraction more times than not. The relationship is far from airtight. With August employment mixed, China looks to be the deciding factor at the FOMC. China's effect on the domestic economy is likely to unfold slowly compared to the effect on the nation's exports. With China's devaluation hitting at mid-month August, attention has been focused on early anecdotal reports out of the factory sector and whether China is having any immediate impact. The ISM new orders index, which incidentally is one of 10 components of the index of leading economic indicators, slowed noticeably in August, down nearly 5 points to 51.7 to indicate the slowest rate of monthly growth since April 2013. This is an attention grabber for the doves though, as the graph indicates, the ISM's index does not always move in line with actual government data. The ISM index, the dark line, has consistently come in over the breakeven 50 line to indicate month-to-month growth, though factory orders themselves, the columns in the graph, show monthly contraction more times than not. The relationship is far from airtight.
 China doesn't appear to have had any immediate effect on consumer buying. Sales of motor vehicles are one of the week's highlights offering the first hard data on the consumer during August. And the news is very good with sales up a surprising 1.5 percent to a 17.8 million annual rate. The gain points to another strong month for retail sales in what would underscore the insulated strength of the domestic economy. Remember it was outsized strength in the auto sector that supported the factory sector in June and July, though August's sales gain was centered in foreign-made vehicles. Still, sales of domestic-made cars and light trucks, which make up 80 percent of all sales, are at very strong levels. China doesn't appear to have had any immediate effect on consumer buying. Sales of motor vehicles are one of the week's highlights offering the first hard data on the consumer during August. And the news is very good with sales up a surprising 1.5 percent to a 17.8 million annual rate. The gain points to another strong month for retail sales in what would underscore the insulated strength of the domestic economy. Remember it was outsized strength in the auto sector that supported the factory sector in June and July, though August's sales gain was centered in foreign-made vehicles. Still, sales of domestic-made cars and light trucks, which make up 80 percent of all sales, are at very strong levels.
 The strength of the economy right now is in the housing and construction sectors, again areas insulated from global factors. Construction spending, next to vehicle sales, is perhaps the week's best surprise, rising 0.7 percent for a second straight month. The graph tracks annualized dollar growth in construction and the slope has steepened nicely in the spring and summer. The latest gain is centered in the most important component of all, single-family homes where construction spending rose 2.1 percent in the month for a year-on-year gain of 15.8 percent. Multi-family homes slowed in the month but the year-on-year rate, reflecting demand tied to high rents, is still outstanding at 21.2 percent. Non-residential components are also showing life with strength in both transportation and power and surprising strength in manufacturing. The strength of the economy right now is in the housing and construction sectors, again areas insulated from global factors. Construction spending, next to vehicle sales, is perhaps the week's best surprise, rising 0.7 percent for a second straight month. The graph tracks annualized dollar growth in construction and the slope has steepened nicely in the spring and summer. The latest gain is centered in the most important component of all, single-family homes where construction spending rose 2.1 percent in the month for a year-on-year gain of 15.8 percent. Multi-family homes slowed in the month but the year-on-year rate, reflecting demand tied to high rents, is still outstanding at 21.2 percent. Non-residential components are also showing life with strength in both transportation and power and surprising strength in manufacturing.
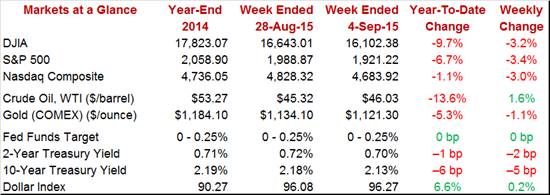
 Though everyone's talking about the 17th, this month's FOMC, like all their scheduled meetings since 2013, is actually a two-day affair, both the 16th and 17th which should give policy makers plenty of time to go through the data and, hopefully, clarify their decision for the rest of us. It was another brutal week in a reminder that it will be the state of the markets going into the FOMC that will likely determine the outcome of the FOMC. Major indexes were down 3 percent in the week with the Dow losing 3.2 percent for a year-to-date loss of 9.7 percent. Oil rallied through much of the week to end with a 1.6 percent gain for WTI at $46.03. And, in a signal of sorts that the Fed is not expected to announce liftoff, rates fell back in the week with the 2-year Treasury down 2 basis points to 0.70 percent and the 10-year down 5 to 2.13 percent. Though everyone's talking about the 17th, this month's FOMC, like all their scheduled meetings since 2013, is actually a two-day affair, both the 16th and 17th which should give policy makers plenty of time to go through the data and, hopefully, clarify their decision for the rest of us. It was another brutal week in a reminder that it will be the state of the markets going into the FOMC that will likely determine the outcome of the FOMC. Major indexes were down 3 percent in the week with the Dow losing 3.2 percent for a year-to-date loss of 9.7 percent. Oil rallied through much of the week to end with a 1.6 percent gain for WTI at $46.03. And, in a signal of sorts that the Fed is not expected to announce liftoff, rates fell back in the week with the 2-year Treasury down 2 basis points to 0.70 percent and the 10-year down 5 to 2.13 percent.
Even without China, a rate hike at this month's FOMC would be no slam dunk. Slack is being absorbed in the labor market but employment growth is soft. And wages may be a risk but commodity prices are very weak and continue to hold down sectors of the economy. With China in play, however, a rate hike may pose more risks than policy makers want, especially of a policy reversal should global turbulence not let up.
For once, it will be a light week on the calendar! The shortened Labor Day week opens with the small business optimism index, which is expected to remain upbeat despite the market sell-off, and the labor market conditions index which is expected to remain flat, the result of weak hiring.
Wednesday will see the JOLTS report where job openings, like most other employment readings on employment, have been soft. Thursday's highlight will be import & export prices which, due to oil and commodity prices, are expected to show deepening rates of contraction. Producer prices close out the week, expected to show contraction at the headline level and moderation for core readings. At least at the data level, the week does not look like it will turn up the heat for an FOMC liftoff.
There may be a lot of turmoil underway in the global markets, but forecasters see the small business optimism index rising 6 tenths in August to 96.0. This report has been mostly positive and has been pointing to second-half strength for the economy. And small businesses have been saying they have job openings that are hard to fill, in line with the shrinkage underway in the available labor force.
NFIB Small Business Optimism Index - Consensus Forecast for August: 96.0
Range: 94.8 to 97.0
The labor market conditions index is expected to inch 2 tenths higher to 1.3 in August. Outside of the unemployment rate and unemployment claims, data on the jobs market have been mostly soft including private payroll growth. This index, which is closely watched by the Fed, has not been signaling any urgency for liftoff.
Labor Market Conditions Index - Consensus Forecast for August: 1.3
Range: 0.5 to 1.6
Consumer credit is expected to pull back from June's outsized rise of $20.7 billion, to a consensus $18.0 billion in July. Revolving credit has been showing some life recently suggesting that consumers are growing less reluctant to run up their credit cards.
Consumer Credit - Consensus Forecast for July: +$18.0 billion
Range: +$17.0 to +$24.0 billion
Initial jobless claims are expected to edge back from the prior week's rise, down 7,000 to a consensus 275,000 for the September 5th week. Weekly data like jobless claims will be getting increasing attention for clues on the effects of market turbulence, which will be a key issue at this month's FOMC.
Initial Jobless Claims - Consensus Forecast for September 5th week: 275,000
Range: 265,000 to 278,000
The drop in oil and commodity prices is expected to pull down import & export prices more steeply than usual, to minus 1.6% from minus 0.9% for import prices and to minus 0.4 percent from minus 0.2% for export prices. Prices in this report have been deep in the minus column, the result of both weak oil and weak commodity prices but also global weakness in final demand.
Import Prices, M/M - Consensus Forecast for August: -1.6%
Range: -3.0% to -0.4%
Export Prices, M/M - Consensus Forecast for August: -0.4%
Range: -1.0% to +0.1%
Concerns of an inventory overhang are centered in wholesale where wholesale inventories are expected to rise 0.3 percent in July following a June surge of 0.9 percent. The stock-to-sales ratio in the wholesale sector has been on a climb, to 1.30 in June from 1.19 in June last year.
Wholesale Inventories - Consensus Forecast for July: +0.3%
Range: +0.1% to +1.3%
Producer prices - final demand is expected to post a 0.2 percent decline in August vs a July rise of 0.2 percent. Negative pull is also expected for the ex-food ex-energy reading, to plus 0.1 percent from plus 0.3 percent, and the ex-food ex-energy ex-services reading, to plus 0.1 percent from plus 0.2 percent. Energy prices fell 0.6 percent in the July report and are certain to post another decline in the August report. Fed policy makers had been waiting for the prior effects of the oil collapse to fade and for price trends to improve, but that talk is long dead.
PPI-FD - Consensus Forecast for August: -0.2%
Range: -0.6% to +0.1%
PPI-FD Less Food & Energy - Consensus Forecast for August: +0.1%
Range: 0.0% to +0.2%
PPI-FD Less Food, Energy & Services - Consensus Forecast for August: +0.1%
Range: +0.0% to +0.2%
The markets may be sliding but forecasters aren't predicting a major impact on consumer sentiment which is expected to edge lower, to 91.0 for the September flash vs 91.9 in August. It was roughly a 91 pace that the index posted in the last two weeks of August, down from a 93 pace in the first half of August and through July. The ongoing decline in sentiment isn't that great, evidence that the U.S. consumer does in fact feel insulated from global events.
Consumer Sentiment - Consensus Forecast for September, Preliminary: 91.0
Range: 86.5 to 96.0
|
