|
"Almost all" FOMC members thought it was a bad idea for a rate hike back in July, which really makes it no surprise at all that the September vote went 9 to 1 to push it back one more time. Will they finally play their card six weeks from now at their October meeting? Or will they hold it for one more round, aiming for December? Or perhaps they will pass instead altogether in 2015, hit by their new pillar of policy: the health of China and the emerging markets. Yet even for the most aggressive of hawks, the latest week of economic data do not point with any urgency to a less accommodative Fed.
 Pressured by gasoline, consumer prices posted a fractional monthly decline in August with the year-on-year rate up only 0.2 percent, as see in the columns of the accompanying graph. The core rate, which excludes both fuel and food, rose only fractionally in August though the year-on-year rate, at plus 1.8 percent as seen in the graph's dark line, continues to hover near the Fed's 2 percent target. But does the 2 percent target actually apply to the CPI core? Or is the Fed's inflation target really meant for the PCE core, a more detailed series that's at plus 1.2 percent and sinking. The PCE core is definitely the answer judging by Janet Yellen's latest press conference where she described inflation in general as "quite low" and "way below target". Pressured by gasoline, consumer prices posted a fractional monthly decline in August with the year-on-year rate up only 0.2 percent, as see in the columns of the accompanying graph. The core rate, which excludes both fuel and food, rose only fractionally in August though the year-on-year rate, at plus 1.8 percent as seen in the graph's dark line, continues to hover near the Fed's 2 percent target. But does the 2 percent target actually apply to the CPI core? Or is the Fed's inflation target really meant for the PCE core, a more detailed series that's at plus 1.2 percent and sinking. The PCE core is definitely the answer judging by Janet Yellen's latest press conference where she described inflation in general as "quite low" and "way below target".
 Details in the consumer price report show surprising weakness for services, a sector which is a central strength of the economy and insulated from global troubles. CPI services posted their weakest result in a year in August, seen in the columns in the lower part of the graph, with the year-on-year rate, tracked by the dark line, steady at only plus 2.2 percent. This is supposed to be a center of price strength for the economy? Owners' equivalent rent, which had been heating up, rose only 0.2 percent in the month with medical care and education at no change and lodging away from home showing a decline. Energy prices are not rebounding to say the least and are certainly not a center of price strength, down 2.0 percent in August alone with the year-on-year rate at minus 15 percent. And the price collapse going on right now at the pump points to an even greater downward pull from gasoline in the September report. And it's not all confined to gasoline as airfares, reflecting lower fuel costs, have been tumbling the last two months. Details in the consumer price report show surprising weakness for services, a sector which is a central strength of the economy and insulated from global troubles. CPI services posted their weakest result in a year in August, seen in the columns in the lower part of the graph, with the year-on-year rate, tracked by the dark line, steady at only plus 2.2 percent. This is supposed to be a center of price strength for the economy? Owners' equivalent rent, which had been heating up, rose only 0.2 percent in the month with medical care and education at no change and lodging away from home showing a decline. Energy prices are not rebounding to say the least and are certainly not a center of price strength, down 2.0 percent in August alone with the year-on-year rate at minus 15 percent. And the price collapse going on right now at the pump points to an even greater downward pull from gasoline in the September report. And it's not all confined to gasoline as airfares, reflecting lower fuel costs, have been tumbling the last two months.
 But the biggest inflation news in the week didn't come from the CPI report but from the FOMC statement. As underscored by Yellen herself in the press conference, wage pressures are now officially described as having "moved" lower. Exact data references weren't cited but presumably a key such indicator must be the employment cost index, released way back in July for the second quarter. The result was a complete shock if you remember, up only 0.2 percent as seen in the graph for the lowest reading in the 33-year history of the report. But the biggest inflation news in the week didn't come from the CPI report but from the FOMC statement. As underscored by Yellen herself in the press conference, wage pressures are now officially described as having "moved" lower. Exact data references weren't cited but presumably a key such indicator must be the employment cost index, released way back in July for the second quarter. The result was a complete shock if you remember, up only 0.2 percent as seen in the graph for the lowest reading in the 33-year history of the report.
 Inflation pressures may not be building in the consumer economy but consumer spending does remain the economy's central support. Retail sales for August came in soft but upward revisions to an already strong July are making for a very solid third quarter so far. When excluding gasoline stations, where sales have been depressed due to falling prices, retail sales look even stronger. The upper graph tracks dollar sales excluding Inflation pressures may not be building in the consumer economy but consumer spending does remain the economy's central support. Retail sales for August came in soft but upward revisions to an already strong July are making for a very solid third quarter so far. When excluding gasoline stations, where sales have been depressed due to falling prices, retail sales look even stronger. The upper graph tracks dollar sales excluding  gasoline stations, showing a very respectable and very steady upward slope from $300 million per month in 2009 to $410 million in the latest month. The second graph breaks the dollar readings into month-to-month percentage change, the light columns, and year-on-year change, the dark line. Monthly gains have been solid, at an average of 0.4 percent so far this year, though the year-on-year rate, last at plus 4.4 percent, isn't all that great. The consumer, not seeing much strength in wages, continues to hold back. Still, there were decidedly strong readings for two discretionary components in the August sales report, another solid gain for vehicles and another solid gain for restaurants. gasoline stations, showing a very respectable and very steady upward slope from $300 million per month in 2009 to $410 million in the latest month. The second graph breaks the dollar readings into month-to-month percentage change, the light columns, and year-on-year change, the dark line. Monthly gains have been solid, at an average of 0.4 percent so far this year, though the year-on-year rate, last at plus 4.4 percent, isn't all that great. The consumer, not seeing much strength in wages, continues to hold back. Still, there were decidedly strong readings for two discretionary components in the August sales report, another solid gain for vehicles and another solid gain for restaurants.
 The week's data on housing show solid gains though overheating isn't in the cards based on Yellen's press conference where she downplayed both the current strength of the sector and its contribution to the nation's overall economy. Still, optimism among homebuilders is the highest it's been this recovery. The graph tracks the report's three components led by nearly 70 readings for future and present sales. These readings are in the very high range. Now in the average range is the traffic component, the dark line in the graph that's finally approaching 50. Traffic has been lagging due in part to lack of interest from potential first-time buyers who have been content to rent but, with home prices stable and mortgage rates low, are now perhaps becoming less content. The week's data on housing show solid gains though overheating isn't in the cards based on Yellen's press conference where she downplayed both the current strength of the sector and its contribution to the nation's overall economy. Still, optimism among homebuilders is the highest it's been this recovery. The graph tracks the report's three components led by nearly 70 readings for future and present sales. These readings are in the very high range. Now in the average range is the traffic component, the dark line in the graph that's finally approaching 50. Traffic has been lagging due in part to lack of interest from potential first-time buyers who have been content to rent but, with home prices stable and mortgage rates low, are now perhaps becoming less content.
 Housing starts and permits also continue to trend higher, at a 1.125 million annual pace for starts in August and permits a little stronger at 1.170 million. Permits for single-family homes, at a 699,000 pace, are the strongest they've been since 2008. Starts and permits have been rising convincingly over the past three years though, when put into perspective against the last cycle that of course was inflated by subprime mortgage debt, levels don't look very strong at all. The peak in the graph is in 2005 at nearly 2.3 million, a little more than double the current rate. Housing starts and permits also continue to trend higher, at a 1.125 million annual pace for starts in August and permits a little stronger at 1.170 million. Permits for single-family homes, at a 699,000 pace, are the strongest they've been since 2008. Starts and permits have been rising convincingly over the past three years though, when put into perspective against the last cycle that of course was inflated by subprime mortgage debt, levels don't look very strong at all. The peak in the graph is in 2005 at nearly 2.3 million, a little more than double the current rate.
 A reversal in the auto sector pulled the manufacturing component of the industrial production 0.5 percent lower in August. Year-on-year, manufacturing production is up only 1.4 percent. Capacity utilization in the sector is flat at 75.8 percent, roughly unchanged from a year ago and a reminder that excess capacity is another factor behind price weakness for goods. Exports are not broken out in this series though related weakness is a central negative for the factory sector. The graph compares the index level of the manufacturing component with dollar sales of exported goods as tracked in the international trade report. The decline in exports over the past year corresponds with a general flattening for total manufacturing production. The fading in August is a reminder of how important the domestic vehicle market is to the domestic economy. And the fading along with the slowing in retail sales are both perhaps early indications of a Chinese effect, that is the dampening of domestic activity tied to slowing in China and to related volatility in the global markets. A reversal in the auto sector pulled the manufacturing component of the industrial production 0.5 percent lower in August. Year-on-year, manufacturing production is up only 1.4 percent. Capacity utilization in the sector is flat at 75.8 percent, roughly unchanged from a year ago and a reminder that excess capacity is another factor behind price weakness for goods. Exports are not broken out in this series though related weakness is a central negative for the factory sector. The graph compares the index level of the manufacturing component with dollar sales of exported goods as tracked in the international trade report. The decline in exports over the past year corresponds with a general flattening for total manufacturing production. The fading in August is a reminder of how important the domestic vehicle market is to the domestic economy. And the fading along with the slowing in retail sales are both perhaps early indications of a Chinese effect, that is the dampening of domestic activity tied to slowing in China and to related volatility in the global markets.
 A deepening of a Chinese effect may be what's behind troubling signals so far this month from the manufacturing sector. Both the Empire State and Philly Fed reports posted glaring declines in September that followed the shock decline for Empire State in August. Empire State is at minus 14.67 with the Philly Fed at minus 6.0, its first negative reading since early last year. Details in the Empire State were negative throughout, in contrast to the Philly Fed report where weakness was confined to the general index. This isolated weakness hints at a sentiment effect more than an actual effect, at least for now. Tangible or not, the signals from these reports, as seen starkly in the graph, pose new questions for the factory outlook. A deepening of a Chinese effect may be what's behind troubling signals so far this month from the manufacturing sector. Both the Empire State and Philly Fed reports posted glaring declines in September that followed the shock decline for Empire State in August. Empire State is at minus 14.67 with the Philly Fed at minus 6.0, its first negative reading since early last year. Details in the Empire State were negative throughout, in contrast to the Philly Fed report where weakness was confined to the general index. This isolated weakness hints at a sentiment effect more than an actual effect, at least for now. Tangible or not, the signals from these reports, as seen starkly in the graph, pose new questions for the factory outlook.
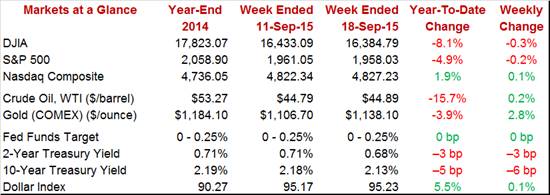
 At the beginning of the week, the strong consensus for Thursday's meeting was for no action. But as Thursday approached, hawks came out in force and uncertainty began to creep in. The result was a surprise reaction to what was really a no-surprise decision. Money immediately flooded into short Treasuries where the 2-year yield fell 8 basis points to 2.22 percent. Stocks would react the next day with the Dow losing 1.7 percent on Friday to 16,384 for a small decline on the week. At the beginning of the week, the strong consensus for Thursday's meeting was for no action. But as Thursday approached, hawks came out in force and uncertainty began to creep in. The result was a surprise reaction to what was really a no-surprise decision. Money immediately flooded into short Treasuries where the 2-year yield fell 8 basis points to 2.22 percent. Stocks would react the next day with the Dow losing 1.7 percent on Friday to 16,384 for a small decline on the week.
China's effects on the domestic economy may or may not be popping up already but the possible risks, especially highlighted by the prior week's collapse in the consumer sentiment index, certainly put the brakes on a September rate hike. Though the economy is chugging along, evaporating slack in the labor market may eventually push the Fed for liftoff. It certainly isn't likely to be inflation where service prices are soft, energy prices are contracting again and wage pressures have moved lower (not to mention import prices which continue to contract). Raising inflation may become an increasing priority for the Fed, one that wouldn't stress the need for less accommodation.
Expectations are not looking for a strong week. Existing home sales start things off on Monday and are expected to post a sizable decline followed, however, by FHFA house prices on Tuesday which are expected to bounce higher. Thursday is the heaviest day on the calendar when a drop is expected for durable goods orders, one tied however to a monthly downswing for aircraft and not to broad-based weakness. New home sales are also out on Thursday and only a small gain is expected. And the week ends with a second look at consumer sentiment where only modest improvement from a dismal flash reading is forecast.
A step back is expected for existing home sales where, after three straight months of gains, the consensus is calling for a 1.7 percent decline in August. Lack of homes on the market is a leading factor holding down sales.
Existing Home Sales, Annual Rate - Consensus Forecast for August: 5.50 million
Range: 5.40 to 5.60 million
Home sales have been respectable but indications on home prices have been soft. Following an undersized 0.2 percent rise in June, forecasters see a respectable 0.4 percent gain in July for the FHFA house price index.
FHFA House Price Index - Consensus Forecast for July: +0.4%
Range: +0.3% to +0.8%
Limited strength is expected for the Richmond Fed manufacturing index where forecasters are calling for a modest improvement to 3 in September from August's zero. September indications from the Empire State and Philly Fed reports were decidedly weak.
Richmond Fed Manufacturing Index - Consensus Forecast for September: 3
Range: 2 to 5
The manufacturing PMI is expected to firm slightly to 53.1 which would indicate an extension of moderate factory growth. Growth indications from this report have slowed through the year with weakness in exports a chief factor.
Manufacturing PMI, Flash - Consensus Forecast for September: 53.1
Range: 50.5 to 53.6
Durable goods orders are expected to fall a sharp 2.0 percent in August due to weakness in aircraft. Excluding transportation, orders are expected to rise 0.3 percent. The auto sector gave a boost to factory data during June and especially July but, in a negative signal for this report, the manufacturing component of the August industrial production report was pulled lower by autos. Still, July was a good month for durable goods orders and general momentum is expected to extend into August.
Durable Goods Orders, M/M Chg - Consensus Forecast for August: -2.0%
Range: -3.3% to +0.4%
Durable Goods Orders Ex-Transportation - Consensus Forecast for August: +0.3%
Range: -1.0% to +1.3%
Jobless claims are expected to rise back to their 275,000 trend line, up from the near record low of 264,000 in the prior week. For the past six months, jobless claims have been signaling tight conditions in the labor market.
Initial Jobless Claims - Consensus Forecast for Sept 19 Week: 275,000
Range: 269,000 to 280,000
A small rise is expected for new home sales where the consensus is calling for a 515,000 rate in August from July's 507,000. Limited supply has been holding back sales and any additional troubles in August could be blamed on stock market losses. Recent sales may be flat but year-on-year growth is very strong, trending at 20 percent.
New Home Sales - Consensus Forecast for August: 515 K
Range: 500 K to 531 K
No revisions are expected in the third estimate of second-quarter GDP with GDP seen holding at a very solid plus 3.7 percent and the GDP price index at plus 2.1 percent. Final demand proved very strong in the second revision, at plus 3.5 percent and underscoring strength for personal consumption expenditures and residential investment.
Read GDP, Third Estimate - Consensus Forecast for Second Quarter: +3.7%
Range: +3.5% to +4.1%
GDP Price Index, Third Estimate - Consensus Forecast for Second Quarter: +2.1%
Range: +2.0% to +2.1%
Strength in the service sector is central to the nation's economic health and another solid reading is expected for the services PMI where, showing strong gains for new orders and employment, global effects have been hard to find. The flash reading for September is expected to edge 3 tenths higher to 55.5 to signal strong monthly growth.
Services PMI - Consensus Forecast for September: 55.5
Range: 55.1 to 56.5
Consumer sentiment shook the outlook at mid-month, falling more than 6 points to 85.7 and highlighting the risk, later echoed by the FOMC, that troubles centered in China may be having early effects in the United States. Only modest recovery is expected for the final sentiment reading, at a consensus 87.1.
Consumer Sentiment, Final - Consensus Forecast for September: 87.1
Range: 85.0 to 92.0
|
