|
You can feel the excitement that's already building — is it the October FOMC or the December FOMC when policy makers announce the big liftoff? Janet Yellen has just completely assured us (more or less) that it absolutely has to be one of the two. And yet, we know of course the Fed is data dependent. Yikes. But dependence in this case is a good thing, a very good thing, giving us all a chance to look at the numbers for ourselves so we all can make our own call. That's seriously the spirit of democracy. So let's get started. And it turns out we're lucky! This last week wasn't bad at all with key updates on the factory and housing sectors not even to mention the Volkswagen effect.
 Janet Yellen, in her policy speech on Thursday, stressed strongly that inflation will likely begin to move its long-term 2 percent trend once the ongoing effects of commodity and import-price deflation fade. And Richmond Fed's Jeffrey Lacker, in his published dissent of September's no-action decision, downplays the effects as "transitory" and no more than a "disinflationary impulse". Part of their confidence that inflation will turn higher is tied to what they believe has been the success of 20 years of inflation-focused Federal Reserve policy, policy that in itself has helped (temporary factors aside) to anchor inflation to 2 percent. Janet Yellen, in her policy speech on Thursday, stressed strongly that inflation will likely begin to move its long-term 2 percent trend once the ongoing effects of commodity and import-price deflation fade. And Richmond Fed's Jeffrey Lacker, in his published dissent of September's no-action decision, downplays the effects as "transitory" and no more than a "disinflationary impulse". Part of their confidence that inflation will turn higher is tied to what they believe has been the success of 20 years of inflation-focused Federal Reserve policy, policy that in itself has helped (temporary factors aside) to anchor inflation to 2 percent.
Temporary or not, a whole new disinflationary wave is underway. Regional and private surveys are almost all picking up contraction in costs of raw materials but, more importantly, also contraction in prices of finished goods. Looking at the Kansas City manufacturing report as an example, the graph compares the dark columns of prices received with the light columns of prices paid. Both jolted into significant contraction back in August with contraction extending to September. Changes in finished goods prices are usually tame and often lag changes in raw materials, but not this time.
 The Kansas City report has been in the serious dumps for the last seven months. The dark columns in this graph track the main index where the sub-zero run reflects the damage from weakened exports (the result of weak foreign demand together with the strength of the dollar) and also the collapse in energy spending. The Richmond Fed's index, the light columns, are also now in contraction. Until September, the Richmond Fed had been posting some of the most consistently solid numbers of any regional report. The Kansas City report has been in the serious dumps for the last seven months. The dark columns in this graph track the main index where the sub-zero run reflects the damage from weakened exports (the result of weak foreign demand together with the strength of the dollar) and also the collapse in energy spending. The Richmond Fed's index, the light columns, are also now in contraction. Until September, the Richmond Fed had been posting some of the most consistently solid numbers of any regional report.
 The Philly Fed had also been reporting consistent strength until falling into the negative column this month as seen in the dark columns of the graph. The Empire State report, tracked in the light column, made headlines back in August when, to everyone's complete shock, it suddenly broke into contraction. Prices received in the Philly report, like the Kansas City report, have been in contraction the last two months. Prices received in Empire State are also now in contraction. Contraction in new orders and the working down of backlogs are other consistent patterns in these reports and, unfortunately, point to an extending downward slope for the factory sector. The Philly Fed had also been reporting consistent strength until falling into the negative column this month as seen in the dark columns of the graph. The Empire State report, tracked in the light column, made headlines back in August when, to everyone's complete shock, it suddenly broke into contraction. Prices received in the Philly report, like the Kansas City report, have been in contraction the last two months. Prices received in Empire State are also now in contraction. Contraction in new orders and the working down of backlogs are other consistent patterns in these reports and, unfortunately, point to an extending downward slope for the factory sector.
 The news looking back isn't much better for the factory sector. The dark line tracks ex-transportation orders in the durable goods report. Its year-long consistent slide from 10 percent growth to slight contraction is the definitive slope for the factory sector. Judging from September's regional reports, this slope will likely continue its slide right into the fourth quarter. (Note that the big swings for total orders, the light line, are tied to the timing of aircraft orders.) The news looking back isn't much better for the factory sector. The dark line tracks ex-transportation orders in the durable goods report. Its year-long consistent slide from 10 percent growth to slight contraction is the definitive slope for the factory sector. Judging from September's regional reports, this slope will likely continue its slide right into the fourth quarter. (Note that the big swings for total orders, the light line, are tied to the timing of aircraft orders.)
 Another area of weakness for August was a give back in orders and shipments for capital goods, both of which fell after two months of core strength. It may be just a fluke, but the decline does coincide with the yuan devaluation and downturn in China's outlook. The August dip in capital goods could prove, at least in theory, to be one of the first tangible indications of China-related weakening. Durable goods for August confirmed the weakness of the prior week's industrial production report where manufacturing came in flat. And let's bring in company news, Caterpillar, which is at the very heart of the capital goods group, just announced a mass layoff in further evidence of a China effect. Another area of weakness for August was a give back in orders and shipments for capital goods, both of which fell after two months of core strength. It may be just a fluke, but the decline does coincide with the yuan devaluation and downturn in China's outlook. The August dip in capital goods could prove, at least in theory, to be one of the first tangible indications of China-related weakening. Durable goods for August confirmed the weakness of the prior week's industrial production report where manufacturing came in flat. And let's bring in company news, Caterpillar, which is at the very heart of the capital goods group, just announced a mass layoff in further evidence of a China effect.
 Housing is a sector very distant from China where related effects, if any from current troubles, will take time to appear. There is very good news out of the sector as new home sales are suddenly coming to life. The dark line hit a peak at the 550,000 line in February this year but then, inexplicably, began to trend lower until big gains reappeared in July and August. In contrast, existing home sales, the shaded area, have climbed steadily all year, that is unfortunately until the August report. But back to new homes. Supply on the market is very tight right now and is reflected in recent gains for permits. Builders are having a hard time keeping up and residential investment is expected to make a sizable contribution to third-quarter GDP. Housing is a sector very distant from China where related effects, if any from current troubles, will take time to appear. There is very good news out of the sector as new home sales are suddenly coming to life. The dark line hit a peak at the 550,000 line in February this year but then, inexplicably, began to trend lower until big gains reappeared in July and August. In contrast, existing home sales, the shaded area, have climbed steadily all year, that is unfortunately until the August report. But back to new homes. Supply on the market is very tight right now and is reflected in recent gains for permits. Builders are having a hard time keeping up and residential investment is expected to make a sizable contribution to third-quarter GDP.
 Turning back to existing home sales, the decline in August to a 5.3 million rate may not be reversed quickly, based on pending home sales. The line in the graph (pending sales) appears to lead the shaded area upward into the spring before tailing off in what points to a flat run ahead for final sales. Despite low mortgage rates and soft prices, the housing sector hasn't exactly been on fire. (Note that pending sales of existing homes are counted at the time of a contract signing while final sales are counted at the close.) Turning back to existing home sales, the decline in August to a 5.3 million rate may not be reversed quickly, based on pending home sales. The line in the graph (pending sales) appears to lead the shaded area upward into the spring before tailing off in what points to a flat run ahead for final sales. Despite low mortgage rates and soft prices, the housing sector hasn't exactly been on fire. (Note that pending sales of existing homes are counted at the time of a contract signing while final sales are counted at the close.)
 FHFA price data were also posted in the week and the result was positive, with a higher-than-expected monthly gain of 0.6 percent and a year-on-year rate at plus 5.8 percent. This is the largest monthly gain since February this year and the best year-on-year rate since April last year. But prices still have a long way to go. Year-on-year gains, for both FHFA and Case-Shiller, have been below 6 percent for nearly a full year as seen in the graph. Home prices right now are another expression of general price weakness. FHFA price data were also posted in the week and the result was positive, with a higher-than-expected monthly gain of 0.6 percent and a year-on-year rate at plus 5.8 percent. This is the largest monthly gain since February this year and the best year-on-year rate since April last year. But prices still have a long way to go. Year-on-year gains, for both FHFA and Case-Shiller, have been below 6 percent for nearly a full year as seen in the graph. Home prices right now are another expression of general price weakness.
 The evil genius of Volkswagen mesmerized everyone during the week including investors. There's certain to become something known as the "Volkswagen Effect" but for now its business and economic ramifications are of course unknown. For Fed policy there was clarity. Yellen's speech on Thursday reassured skeptics that she's no über dove after all and, in classic central bank form, is ready to raise rates and remind everyone that the Fed is centrally committed to keeping inflation in check. One thing she also kept in check during the speech were references to global factors, unlike the September FOMC statement where they were placed at the top. The evil genius of Volkswagen mesmerized everyone during the week including investors. There's certain to become something known as the "Volkswagen Effect" but for now its business and economic ramifications are of course unknown. For Fed policy there was clarity. Yellen's speech on Thursday reassured skeptics that she's no über dove after all and, in classic central bank form, is ready to raise rates and remind everyone that the Fed is centrally committed to keeping inflation in check. One thing she also kept in check during the speech were references to global factors, unlike the September FOMC statement where they were placed at the top.
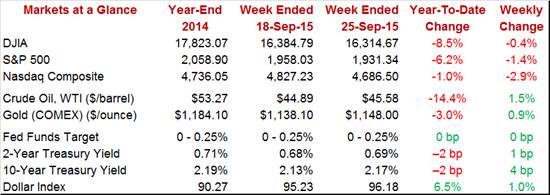
But it was China again, this time weak factory indications, that sank the U.S. stock market at least until Friday when a rally, which followed Yellen's comments, trimmed the week's loss to only 0.4 percent for the Dow. Oil had a good week, ending 1.5 percent higher near $45.50 with gold up 0.9 percent near $1,150. Rates were stable in the week while the dollar index rose 1.0 percent to stretch its year-to-date gain — to the regret of both U.S. exporters and those trying to raise inflation — to 6.5 percent.
Janet Yellen may be ready but economic data will still have to justify the liftoff. Price weakness in the manufacturing sector, though described by policy makers as temporary, may not lift in time for the October FOMC and perhaps not even the December FOMC. Would lack of inflationary pressures keep the Fed back? It's wait and see.
This may be the week that fully shapes expectations for the October FOMC. A weak September employment report on Friday could very well kill expectations for an October rate hike while an especially strong report could seal those expectations. But the week is packed with key data especially Monday's personal income & outlays report where another soft reading for the core PCE price index could be an offset to any subsequent strength in the jobs report. Also keep an eye out for vehicle sales on Thursday which will offer the first indications on September consumer spending.
The core PCE price index — the most closely watched of all inflation indicators right now — is expected to inch only 0.1 percent higher in August which wouldn't be enough to turn up the liftoff heat for the October FOMC. This index has been very soft with the year-on-year moving backwards in July to only plus 1.2 percent. The overall PCE price index, pulled down by energy, has been dormant, barely over zero year-on-year with no change expected for the August reading. Personal income is expected to stay firm, up 0.4 percent after posting a similar gain in July that included a sizable 0.5 percent monthly rise the for wages & salaries component. Consumer spending, which will offer data on service spending, is expected to rise a moderate 0.3 percent.
Personal Income, M/M Chg - Consensus Forecast for August: +0.4%
Range: +0.3% to +0.5%
Consumer Spending, M/M Chg - Consensus Forecast for August: +0.3%
Range: +0.2% to +0.5%
PCE Price Index, M/M Chg - Consensus Forecast for August: +0.0%
Range: -0.1% to +0.1%
Core PCE Price Index, M/M Chg - Consensus Forecast for August: +0.1%
Range: +0.0% to +0.2%
Pending home sales had been on a climb in the first half of the year, correctly signaling a subsequent climb for final sales of existing homes. But the index began to stall going into the summer, this time correctly signaling August's drop in existing home sales. A welcome pop higher of 0.5 percent is expected for the August report, one that would point to a bounce back for existing home sales in September and October
Pending Home Sales, M/M Chg - Consensus Forecast for August: +0.5%
Range: +0.0% to +1.0%
No where are the effects of the oil-patch rout more evident than in the Dallas Fed manufacturing survey where the general activity index has been in contraction since the very beginning of the year. Recent price readings have been very weak. It really doesn't get any worse than this report which has been pointing to increasing drag from the energy sector.
Dallas Fed General Activity Index - Consensus Forecast for September: -9.0
Range: -12.0 to -4.0
Case-Shiller home price data have been flat and, despite a bounce higher for the FHFA house price index in August, are expected to stay flat. The consensus is calling for only a 0.1 percent rise in the 20-city adjusted index for August which, in a plus, would reverse the 0.1 percent decline in July. Home prices, despite respectable strength in home sales, have been flat this year.
Case-Shiller Adj. 20-City Index, M/M Chg - Consensus Forecast for July: +0.1%
Range: -0.2% to +0.6%
Case-Shiller Unadj. 20-City Index, M/M Chg - Consensus Forecast for July: +0.9%
Range: +0.6% to +1.5%
Case-Shiller Unadj. 20-City Index, Y/Y Chg - Consensus Forecast for July: +5.3%
Range: +4.5% to +6.0%
The consumer confidence report showed odd strength in August at 101.5 for a 10.5 point surge, boosted especially by unusual strength in the assessment of current job conditions. Forecasters see the index coming back sharply from August, to a consensus of 96.0. A decline for this index would be seen, at least to a degree, as a correction from the prior month's outsized gain and less perhaps as a material decline in confidence.
Consumer Confidence Index - Consensus Forecast for September: 96.0
Range: 88.5 to 100.0
ADP definitely got one right in August, correctly calling for sub-standard growth in private payrolls. ADP's private payroll count in September is expected to match August, at 190,000.
ADP Private Payrolls - Consensus Forecast for September: 190,000
Range: 180,000 to 220,000
The Chicago PMI is expected to slow to 53.6 in September from 54.4 in August when delays in shipments gave the index a lift. New orders, however, slowed while backlog orders fell into deeper contraction. Production slowed as well.
Chicago PMI - Consensus Forecast for September: 53.6
Range: 49.0 to 55.0
Jobless claims are expected to rise slightly to 272,000 in the September 26 week. For the past six months, jobless claims have been signaling tight conditions in the labor market and have been offering the hawks their strongest arguments at the FOMC.
Initial Jobless Claims - Consensus Forecast for Sept 26 Week: 272,000
Range: 270,000 to 278,000
Growth in the manufacturing PMI is expected to come in just moderately above 50, in line with the flash reading of 53.0 which was right in line with August. Export weakness is holding down order growth and hiring is beginning to slow.
Manufacturing PMI - Consensus Forecast for September, Final: 53.0
Range: 52.6 to 53.0
The ISM manufacturing index has been signaling weakening conditions, the weakest for its sample since mid-2013. New orders have slowed markedly and export orders and backlog orders have been in contraction. Prices paid have been in deep contraction. The index is expected to edge even lower, down 1.0 point to 50.5.
ISM Manufacturing Index - Consensus Forecast for September: 50.5
Range: 50.0 to 51.5
Construction spending in July was very strong and is expected to rise further in August, at a consensus 0.7 percent. July's strength was broad based, including gains for single-family homes and nonresidential construction as well. Housing and construction have been on a moderate rise, but still good enough to contribute to overall economic growth.
Construction Spending, M/M Chg - Consensus Forecast for August: +0.6%
Range: +0.2% to +0.8%
Motor vehicle sales have been perhaps the standout indicator so far this year, showing very strong gains that lifted household spending during the summer. Sales in September are expected to ease back to a 17.5 million annual rate from 17.8 million in August. Such a decline would lower expectations for September retail sales but would still point to a healthy consumer.
Total Vehicle Sales, Annual Rate - Consensus Forecast for September: 17.5 million
Range: 17.0 to 18.1 million
North American-Made Vehicle Sales, Annual Rate - Consensus for Sept: 13.8 million
Range: 13.5 to 14.2 million
Non-farm payrolls are expected to bounce back in September, to a moderate 203,000 from a subpar 173,000 in August. Large upward revisions are common for August, the result of adjustment timing for the beginning of the school year. The unemployment rate is expected to hold at 5.1 percent after dropping sharply in August. Wage pressures are not expected to accelerate with average hourly earnings seen rising only 0.2 percent. If the report comes in as expected, it would likely not build expectations for an October FOMC rate hike.
Nonfarm Payrolls, M/M Chg - Consensus Forecast for September: 203,000
Range: 180,000 to 235,000
Unemployment Rate - Consensus Forecast for September: 5.1%
Range: 5.0% to 5.2%
Private Payrolls, M/M Chg - Consensus Forecast for September: 195,000
Range: 175,000 to 246,000
Average Hourly Earnings, M/M Chg - Consensus Forecast for September: +0.2%
Range: +0.1% to +0.3%
Average Workweek - Consensus Forecast for September: 34.6 hours
Range: 34.5 to 34.6 hours
A monthly downswing in aircraft orders pulled down the durable goods report in August and is expected to pull down factory orders as well, by a consensus 1.3 percent. Factory orders have been struggling all year, pulled down by weak exports and moving steadily into year-on-year contraction.
Factory Orders, M/M Chg - Consensus Forecast for August: -1.3%
Range: -2.4% to +1.0%
|
