|
The week leading up to the U.S. employment report is filled with angst on the part of investors. How strong/weak will employment be' How does it translate into monetary policy' While we all know that the Federal Reserve is data dependent, some data carries more weight than others — and we know that employment is one of them!
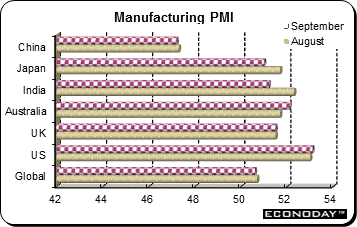 It was a week of weak manufacturing data as reported by the purchasing managers' indexes with most readings clustered just above the breakeven point of 50, between growth and contraction. The disappointing readings spanned the globe as the slowdowns in global growth and international trade are denting goods demand. The UK and U.S. show a growing divergence between weak manufacturing and strength in construction. Both countries are struggling with weak external demand and a strong currency that is hurting the country's competitiveness. Underlining the weakness in the U.S. was factory orders which also disappointed and added to the evidence that global demand is sapping strength from U.S. goods industries. It was a week of weak manufacturing data as reported by the purchasing managers' indexes with most readings clustered just above the breakeven point of 50, between growth and contraction. The disappointing readings spanned the globe as the slowdowns in global growth and international trade are denting goods demand. The UK and U.S. show a growing divergence between weak manufacturing and strength in construction. Both countries are struggling with weak external demand and a strong currency that is hurting the country's competitiveness. Underlining the weakness in the U.S. was factory orders which also disappointed and added to the evidence that global demand is sapping strength from U.S. goods industries.
| |
|
2014 |
2015 |
% Change |
|
Index |
Dec 31 |
Sep 25 |
Oct 2 |
Week |
2015 |
| Asia/Pacific |
|
|
|
|
|
|
| Australia |
All Ordinaries |
5388.6 |
5076.7 |
5089.2 |
0.2% |
-5.6% |
| Japan |
Nikkei 225 |
17450.8 |
17880.5 |
17725.1 |
-0.9% |
1.6% |
| Hong Kong |
Hang Seng |
23605.0 |
21186.3 |
21506.1 |
1.5% |
-8.9% |
| S. Korea |
Kospi |
1915.6 |
1942.9 |
1969.7 |
1.4% |
2.8% |
| Singapore |
STI |
3365.2 |
2832.6 |
2793.2 |
-1.4% |
-17.0% |
| China |
Shanghai Composite |
3234.7 |
3092.4 |
3052.8 |
-1.3% |
-5.6% |
|
|
|
|
|
|
|
| India |
Sensex 30 |
27499.4 |
25863.5 |
26221.0 |
1.4% |
-4.6% |
| Indonesia |
Jakarta Composite |
5227.0 |
4209.4 |
4207.8 |
0.0% |
-19.5% |
| Malaysia |
KLCI |
1761.3 |
1615.0 |
1628.8 |
0.9% |
-7.5% |
| Philippines |
PSEi |
7230.6 |
6917.6 |
6850.61 |
-1.0% |
-5.3% |
| Taiwan |
Taiex |
9307.3 |
8132.4 |
8305.0 |
2.1% |
-10.8% |
| Thailand |
SET |
1497.7 |
1376.8 |
1346.4 |
-2.2% |
-10.1% |
|
|
|
|
|
|
|
| Europe |
|
|
|
|
|
|
| UK |
FTSE 100 |
6566.1 |
6109.0 |
6130.0 |
0.3% |
-6.6% |
| France |
CAC |
4272.8 |
4480.7 |
4458.9 |
-0.5% |
4.4% |
| Germany |
XETRA DAX |
9805.6 |
9688.5 |
9553.1 |
-1.4% |
-2.6% |
| Italy |
FTSE MIB |
19012.0 |
21339.1 |
21395.3 |
0.3% |
12.5% |
| Spain |
IBEX 35 |
10279.5 |
9519.5 |
9603.6 |
0.9% |
-6.6% |
| Sweden |
OMX Stockholm 30 |
1464.6 |
1418.5 |
1412.9 |
-0.4% |
-3.5% |
| Switzerland |
SMI |
8983.4 |
8505.9 |
8515.5 |
0.1% |
-5.2% |
|
|
|
|
|
|
|
| North America |
|
|
|
|
|
|
| United States |
Dow |
17823.1 |
16314.7 |
16472.4 |
1.0% |
-7.6% |
|
NASDAQ |
4736.1 |
4686.5 |
4707.8 |
0.5% |
-0.6% |
|
S&P 500 |
2058.9 |
1931.3 |
1951.4 |
1.0% |
-5.2% |
| Canada |
S&P/TSX Comp. |
14632.4 |
13378.6 |
13339.7 |
-0.3% |
-8.8% |
| Mexico |
Bolsa |
43145.7 |
42435.2 |
42735.2 |
0.7% |
-1.0% |
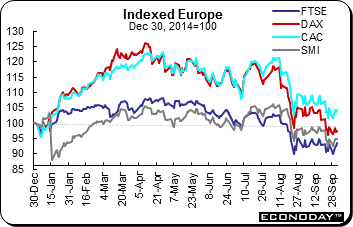 Equities were mixed last week as investors waited for the important U.S. employment report and then were disappointed with the results. The FTSE and SMI were up 0.3 percent and 0.1 percent respectively while the CAC and DAX retreated 0.5 percent and 1.4 percent on the week. After healthy gains in August, all equity indexes retreated with heavy losses of over 3 percent in September. Equities were mixed last week as investors waited for the important U.S. employment report and then were disappointed with the results. The FTSE and SMI were up 0.3 percent and 0.1 percent respectively while the CAC and DAX retreated 0.5 percent and 1.4 percent on the week. After healthy gains in August, all equity indexes retreated with heavy losses of over 3 percent in September.
The weak employment report now has many investors thinking that an interest rate increase by the Federal Reserve later this month or even in December is unlikely. That line of thinking led investors to speculate that the European Central Bank, which is meeting on Thursday, may need to announce further stimulus measures. According to ECB President Mario Draghi, Eurozone growth is returning. He also reiterated his commitment to pursuing full monetary union in the region.
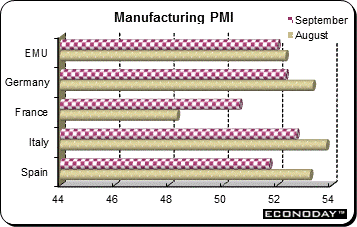 September final manufacturing PMI was 52.0, down slightly from 52.3 in August. Output rose for a 27th successive month reflecting further growth in new business and an additional accumulation of backlogs. New exports orders were again robust. Job creation was positive for a 13th straight month although the addition to the headcount eased to a four month low. Price pressures diminished as input costs fell at the fastest pace in eight months, mainly on the back of weaker oil prices. In turn, factory gate prices decreased for the first time in half a year. Regionally, Ireland (53.8) was the strongest performer ahead of the Netherlands (53.0) and Italy (52.7). Germany (52.3) was in the middle of the pack but France (50.6), despite moving back into positive growth territory, was again well below the Eurozone average. September final manufacturing PMI was 52.0, down slightly from 52.3 in August. Output rose for a 27th successive month reflecting further growth in new business and an additional accumulation of backlogs. New exports orders were again robust. Job creation was positive for a 13th straight month although the addition to the headcount eased to a four month low. Price pressures diminished as input costs fell at the fastest pace in eight months, mainly on the back of weaker oil prices. In turn, factory gate prices decreased for the first time in half a year. Regionally, Ireland (53.8) was the strongest performer ahead of the Netherlands (53.0) and Italy (52.7). Germany (52.3) was in the middle of the pack but France (50.6), despite moving back into positive growth territory, was again well below the Eurozone average.
 Equities were mixed on the week. However, that wasn't the case for September — all indexes covered here retreated on the month and for many, a second consecutive month of decline. Equities were mixed on the week. However, that wasn't the case for September — all indexes covered here retreated on the month and for many, a second consecutive month of decline.
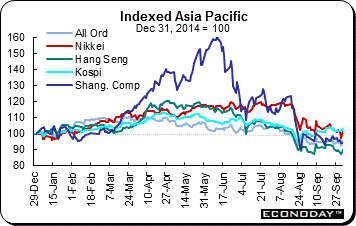
The Nikkei was down for a third consecutive week, this time losing 0.9 percent. The index tumbled 8.2 percent in August and 9.0 percent in September. The economy contracted in the second quarter and recent data indicate that the third quarter may be negative as well, sending the country into another technical recession. In 2014, GDP contracted in the second and third quarters as well, mostly on the heels of an increase in the sales tax that took effect on April 1, 2014. The week's data were lackluster. Business sentiment as reported in the September Tankan weakened from the previous quarter. August industrial production disappointed and retreated on the month. Household spending surprised with a much larger than expected increase after sliding in July while retail sales were up by a timid below consensus 0.8 percent.
Business conditions in Japan worsened during the third quarter, as the closely watched Tankan survey conducted by the Bank of Japan showed. The index for large manufacturers fell to plus 12, missing forecasts, and was down from plus 15 in the previous quarter. The outlook index matched forecasts although it was down sharply from the previous quarter. The Markit/Nikkei Japan manufacturing PMI remained in expansion territory, with a reading of 51.0 in September down from 51.7 in August.
The Hang Seng advanced 1.5 percent in a three day week after sinking 3.4 percent in the prior week. The index now has retreated in three consecutive months and is down 8.9 percent in 2015. The Shanghai Composite, also open for only three days of trading, was down 1.3 percent on the week. Losses eased in September to 4.8 percent after plunges of 14.3 percent in July and 12.5 percent in August. Despite these declines, the Shanghai is only 5.6 percent lower so far this year.
China's manufacturing sector continued to contract in September according to both the 'official' CFLP and Caixin/Markit manufacturing PMIs. The manufacturing output reading as measured by the CFLP was 49.8 compared with 49.7 in August. The results of the survey compiled by Caixin and Markit, however, suggested a worsening picture. The Caixin PMI was 47.2 in September, down slightly from 47.3 in August and the lowest since the depths of the global financial crisis in March 2009. China's economic growth has been battered in recent months by a fall in housing construction. That has led to a huge surplus in materials like steel and cement which has idled plants or caused them to operate at a loss. At the same time, lackluster demand in crucial export markets in Asia and the West, and broader slumps in emerging markets like Brazil, Russia and Turkey, have weighed further on China's economy.
Stocks rebounded Wednesday after the government took measures to support the auto industry and the property market. China cut the purchase tax on vehicles with engines 1.6 liters or smaller by half to 5 percent effective October 1 through the end of next year. The government also announced it had cut the minimum down payment requirement for first time homebuyers. The reduction to 25 percent applies to people buying homes in cities who don't have home-purchase restrictions — the previous down paymentrequirement was 30 percent.
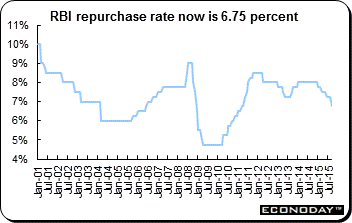 As expected, the Reserve Bank of India opted to lower interest rates at its latest meeting. A 50 basis point reduction in the benchmark repo rate to 6.75 percent was at the more aggressive end of the forecast range although is unlikely to come as any real surprise. Accompanying this move, the RBI announced it was also reducing the reverse repo rate by an equivalent amount to 5.75 percent as well as cutting both the marginal standing facility rate and the Bank Rate by 50 basis points to 7.75 percent. However, the cash reserve ratio (CRR) stayed at 4.0 percent. As expected, the Reserve Bank of India opted to lower interest rates at its latest meeting. A 50 basis point reduction in the benchmark repo rate to 6.75 percent was at the more aggressive end of the forecast range although is unlikely to come as any real surprise. Accompanying this move, the RBI announced it was also reducing the reverse repo rate by an equivalent amount to 5.75 percent as well as cutting both the marginal standing facility rate and the Bank Rate by 50 basis points to 7.75 percent. However, the cash reserve ratio (CRR) stayed at 4.0 percent.
The September ease raises the cumulative reduction in the repo rate so far this calendar year to 1.25 percent. In line with its earlier actions, the latest monetary stimulus reflects the RBI's concerns that domestic growth is still too sluggish to ensure the attainment of its medium term inflation goals (CPI inflation touched a new record low of 3.66 percent in August). In particular, the recovery in manufacturing has been especially patchy and characterized by continued excess capacity, decelerating new orders and a rising inventory/sales ratio. Moreover, the effects of sluggish domestic demand have been compounded in recent months by a significant slowdown in key overseas markets and more general weakness of commodity prices.
Against this backdrop there was always going to be considerable pressure on the RBI from government and industry to cut borrowing costs again today. Another significant contributory factor was the persistent reluctance of banks to pass on in full the previous rate reductions announced since the start of the year. Commercial lending rates had fallen only 30 basis points since January — less than half the 75 basis point reduction in the central bank's repo rate.
Describing the decision as a "front-loaded policy action", RBI Governor Raghuram Rajan said he would work with the government to ensure that impediments to banks passing on the bulk of the cumulative 125 basis points cut in the policy rate this year are removed. With the Indian economy facing multiple headwinds, Rajan said that the central bank will remain accommodative to the extent possible.
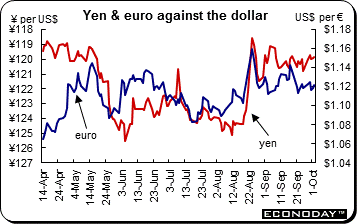 The U.S. dollar gave back some of its recent strength after the U.S. employment report surprised on the downside and traders sold dollars, bought bonds and bailed out of equities. However, as Friday wore on, the currency rebounded, equities recovered all of their losses and then some while bond yields continued to retreat. On the week, the dollar was down against all of its major counterparts with the exception of the pound. The U.S. dollar gave back some of its recent strength after the U.S. employment report surprised on the downside and traders sold dollars, bought bonds and bailed out of equities. However, as Friday wore on, the currency rebounded, equities recovered all of their losses and then some while bond yields continued to retreat. On the week, the dollar was down against all of its major counterparts with the exception of the pound.
Many of the U.S. dollar's woes can be directly linked to soft growth globally. The stronger dollar has made U.S. exports expensive (and imports cheap) which in turn, weakens goods manufacturing. That in turn reduces the need for labor and even leads to cutbacks in personnel. And this offers perhaps a simple explanation for the disappointing employment report on Friday.
|
|
2014 |
2015 |
% Change |
|
|
Dec 31 |
Sep 25 |
Oct 2 |
Week |
2015 |
| U.S. $ per currency |
|
|
|
|
|
|
| Australia |
A$ |
0.8170 |
0.7028 |
0.704 |
0.2% |
-13.8% |
| New Zealand |
NZ$ |
0.7801 |
0.6386 |
0.644 |
0.9% |
-17.4% |
| Canada |
C$ |
0.8614 |
0.7508 |
0.759 |
1.1% |
-11.8% |
| Eurozone |
euro (€) |
1.2098 |
1.1203 |
1.120 |
0.0% |
-7.4% |
| UK |
pound sterling (£) |
1.5585 |
1.5188 |
1.518 |
-0.1% |
-2.6% |
|
|
|
|
|
|
|
| Currency per U.S. $ |
|
|
|
|
|
|
| China |
yuan |
6.2055 |
6.3745 |
6.357 |
0.3% |
-2.4% |
| Hong Kong |
HK$* |
7.7546 |
7.7501 |
7.750 |
0.0% |
0.1% |
| India |
rupee |
63.0437 |
66.1563 |
65.513 |
1.0% |
-3.8% |
| Japan |
yen |
119.8200 |
120.58 |
120.058 |
0.4% |
-0.2% |
| Malaysia |
ringgit |
3.4973 |
4.3863 |
4.415 |
-0.7% |
-20.8% |
| Singapore |
Singapore $ |
1.3246 |
1.4255 |
1.433 |
-0.5% |
-7.6% |
| South Korea |
won |
1090.9800 |
1194.6 |
1180.550 |
1.2% |
-7.6% |
| Taiwan |
Taiwan $ |
31.6560 |
33.013 |
32.964 |
0.1% |
-4.0% |
| Thailand |
baht |
32.8800 |
36.162 |
36.434 |
-0.7% |
-9.8% |
| Switzerland |
Swiss franc |
0.9942 |
0.9799 |
0.9722 |
0.8% |
2.3% |
| *Pegged to U.S. dollar |
|
|
|
|
|
|
| Source: Bloomberg |
|
|
|
|
|
|
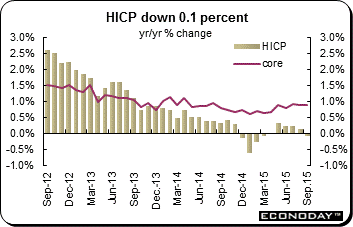 September flash harmonized index of consumer prices was down 0.1 percent on the year and down 0.2 percentage points from its final August print. The new reading also equaled its weakest mark since February and was the first sub-zero result in six months. However, the deceleration in the headline rate was wholly due to the more erratic components and underlying inflation was unchanged at 0.9 percent for both the HICP excluding food, alcohol, tobacco & energy and omitting just unprocessed food & energy. The main downside pressure came, once again, from the energy sector where prices slumped 8.9 percent on the year after a 7.2 percent drop in August. Non-energy industrial goods inflation slipped to 0.3 percent but prices in services accelerated by a 1.3 percent rate. Food, alcohol and tobacco inflation was also just 0.1 percentage points firmer at 1.4 percent. September flash harmonized index of consumer prices was down 0.1 percent on the year and down 0.2 percentage points from its final August print. The new reading also equaled its weakest mark since February and was the first sub-zero result in six months. However, the deceleration in the headline rate was wholly due to the more erratic components and underlying inflation was unchanged at 0.9 percent for both the HICP excluding food, alcohol, tobacco & energy and omitting just unprocessed food & energy. The main downside pressure came, once again, from the energy sector where prices slumped 8.9 percent on the year after a 7.2 percent drop in August. Non-energy industrial goods inflation slipped to 0.3 percent but prices in services accelerated by a 1.3 percent rate. Food, alcohol and tobacco inflation was also just 0.1 percentage points firmer at 1.4 percent.
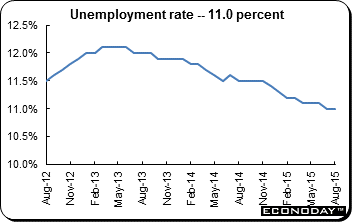 August unemployment declined 10,000 to 17.603 million. The jobless rate was 11.0 percent and in line with its upwardly revised July results. Among the larger four member states, the national unemployment rate was 0.1 percentage points lower at just 4.5 percent in Germany, 22.2 percent in Spain and 11.9 percent in Italy. However, the French rate rose for a third successive month to a new high of 10.8 percent. Top of the jobless ladder was again Greece (25.2 percent in June) while the German rate was comfortably under the second lowest reading, Malta (5.1 percent). August unemployment declined 10,000 to 17.603 million. The jobless rate was 11.0 percent and in line with its upwardly revised July results. Among the larger four member states, the national unemployment rate was 0.1 percentage points lower at just 4.5 percent in Germany, 22.2 percent in Spain and 11.9 percent in Italy. However, the French rate rose for a third successive month to a new high of 10.8 percent. Top of the jobless ladder was again Greece (25.2 percent in June) while the German rate was comfortably under the second lowest reading, Malta (5.1 percent).
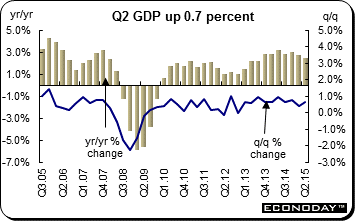 The final revision of second quarter gross domestic product was up an unrevised 0.7 percent on the quarter. However, adjustments to earlier data saw annual growth lowered from the 2.6 percent estimated last time to 2.4 percent. As previously indicated, quarterly growth was heavily weighted towards the external sector, only now even more so. A 1.9 percent increase in exports and a 2.7 percent drop in imports combined to see net exports add 1.4 percentage points to the quarterly change in total output. At 3.6 percent, down from 5.2 percent in the January to March period, the current account deficit as a percentage of GDP was the smallest since the second quarter of 2013. Domestic demand was buoyed mainly by an upwardly revised 0.8 percent increase in household consumption. A 1.6 percent jump in business investment (revised down from 2.9 percent) also provided support. In fact, with government final consumption up 0.4 percent, overall growth would have been significantly higher but for a substantial rundown in stocks (total gross capital formation slumped 7.1 percent). The final revision of second quarter gross domestic product was up an unrevised 0.7 percent on the quarter. However, adjustments to earlier data saw annual growth lowered from the 2.6 percent estimated last time to 2.4 percent. As previously indicated, quarterly growth was heavily weighted towards the external sector, only now even more so. A 1.9 percent increase in exports and a 2.7 percent drop in imports combined to see net exports add 1.4 percentage points to the quarterly change in total output. At 3.6 percent, down from 5.2 percent in the January to March period, the current account deficit as a percentage of GDP was the smallest since the second quarter of 2013. Domestic demand was buoyed mainly by an upwardly revised 0.8 percent increase in household consumption. A 1.6 percent jump in business investment (revised down from 2.9 percent) also provided support. In fact, with government final consumption up 0.4 percent, overall growth would have been significantly higher but for a substantial rundown in stocks (total gross capital formation slumped 7.1 percent).
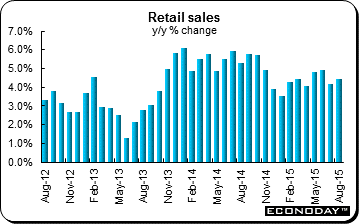
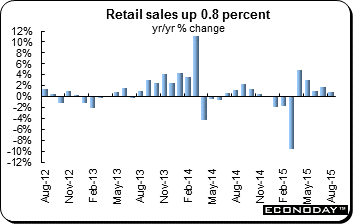 August retail sales were up 0.8 percent on the year, lower than expectations for a 1.1 percent increase. This was the fifth consecutive increase. Among the subcategories, auto sales were up for a fifth month, this time increasing by 3.8 percent on the year after rising 3.7 percent last time. Fuel sales declined for an 11th month. Fuel was 10.6 percent lower than a year ago after declining 9.0 percent in July. Retail machinery sales were up for a second month, this time by 4.8 percent on the year. Food & beverage sales were 3.5 percent higher than August 2014 while apparel sales added 4.5 percent. August's sales increase was the slowest since March when they declined 9.7 percent (a dip explained by the extremely high growth figure for March 2014 when many Japanese 'front loaded' spending before a sales tax increase was implemented in April that year). August retail sales were up 0.8 percent on the year, lower than expectations for a 1.1 percent increase. This was the fifth consecutive increase. Among the subcategories, auto sales were up for a fifth month, this time increasing by 3.8 percent on the year after rising 3.7 percent last time. Fuel sales declined for an 11th month. Fuel was 10.6 percent lower than a year ago after declining 9.0 percent in July. Retail machinery sales were up for a second month, this time by 4.8 percent on the year. Food & beverage sales were 3.5 percent higher than August 2014 while apparel sales added 4.5 percent. August's sales increase was the slowest since March when they declined 9.7 percent (a dip explained by the extremely high growth figure for March 2014 when many Japanese 'front loaded' spending before a sales tax increase was implemented in April that year).
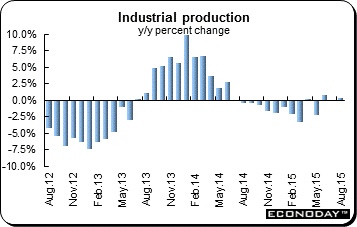 Hopes of a solid rebound in Japanese industrial production fell short in August and underscored the patchy economic picture. August industrial production retreated 0.5 percent on the month after declining 0.8 percent in July. Output was up just 0.3 percent from a year ago after an unchanged reading in July. Among industries that contributed to the decrease were general purpose, production & business oriented machinery (down 3.2 percent), electrical machinery (also down 3.2 percent) and transport equipment (down 0.7 percent). Hopes of a solid rebound in Japanese industrial production fell short in August and underscored the patchy economic picture. August industrial production retreated 0.5 percent on the month after declining 0.8 percent in July. Output was up just 0.3 percent from a year ago after an unchanged reading in July. Among industries that contributed to the decrease were general purpose, production & business oriented machinery (down 3.2 percent), electrical machinery (also down 3.2 percent) and transport equipment (down 0.7 percent).
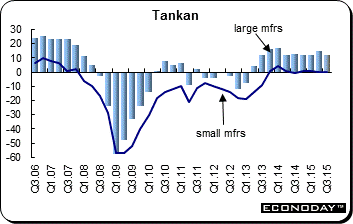 Business conditions in Japan worsened during the third quarter although services companies were in better shape compared to their manufacturing counterparts. Third quarter Tankan readings indicate that major manufacturers CAPEX was hit by the Chinese slowdown while nonmanufacturing benefitted from weak oil prices and is at its highest level since November 1991. Spending by tourists supported major nonmanufacturing firms. A Bank of Japan official noted that the domestic supply and demand balance is improving but the overseas balance is looser on uncertainty. The large manufacturing index slipped to a reading of plus 12 from plus 15 in the June quarter and was slightly below the consensus estimate of plus 13. Small manufacturing was unchanged at zero. Large nonmanufacturing index reading was plus 25, up from June's plus 23 and higher than the median forecast of plus 20. Fiscal year 2015 overall CAPEX forecast indicates an overall increase of 6.4 percent with big firms' plans up 19.0 percent with small firm plans down 6.1 percent. Business conditions in Japan worsened during the third quarter although services companies were in better shape compared to their manufacturing counterparts. Third quarter Tankan readings indicate that major manufacturers CAPEX was hit by the Chinese slowdown while nonmanufacturing benefitted from weak oil prices and is at its highest level since November 1991. Spending by tourists supported major nonmanufacturing firms. A Bank of Japan official noted that the domestic supply and demand balance is improving but the overseas balance is looser on uncertainty. The large manufacturing index slipped to a reading of plus 12 from plus 15 in the June quarter and was slightly below the consensus estimate of plus 13. Small manufacturing was unchanged at zero. Large nonmanufacturing index reading was plus 25, up from June's plus 23 and higher than the median forecast of plus 20. Fiscal year 2015 overall CAPEX forecast indicates an overall increase of 6.4 percent with big firms' plans up 19.0 percent with small firm plans down 6.1 percent.
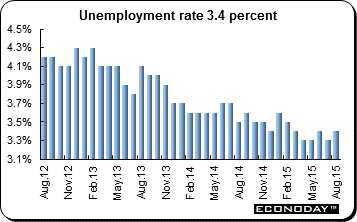 August unemployment rate was 3.4 percent as expected. The rate has wavered between 3.3 percent and 3.4 percent since March. Employment was up 160,000 from a year ago. The labour force participation rate added 0.1 percent 59.6 percent on the year while the employment rate was 0.2 higher at 57.6 percent. Job availability continues to climb. The job to applicants ratio rose to 1.23 in August from 1.21 in July and expectations for it to hold steady at that level. This is the highest level of job availability since January 1992, and suggests the unemployment rate could still decline in coming months. August unemployment rate was 3.4 percent as expected. The rate has wavered between 3.3 percent and 3.4 percent since March. Employment was up 160,000 from a year ago. The labour force participation rate added 0.1 percent 59.6 percent on the year while the employment rate was 0.2 higher at 57.6 percent. Job availability continues to climb. The job to applicants ratio rose to 1.23 in August from 1.21 in July and expectations for it to hold steady at that level. This is the highest level of job availability since January 1992, and suggests the unemployment rate could still decline in coming months.
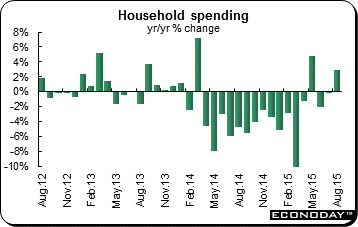 Household spending rebounded in August. Overall household spending jumped 2.9 percent in August from a year earlier after a 0.2 percent decline in July and expectations for a 1.3 percent gain. That is the highest level for household spending since 4.8 percent in May, with that being the only other positive reading this year. The data series have been negative for most of the past year-and-a-half. Household spending has been a weak spot on Japan's economic recovery, and has been sluggish since the increase to the national sales tax in April 2014. While one healthy increase may not be enough to quiet calls for the Bank of Japan to consider expanding its already unprecedented stimulus program in a bid to raise inflation and encourage spending. Household spending rebounded in August. Overall household spending jumped 2.9 percent in August from a year earlier after a 0.2 percent decline in July and expectations for a 1.3 percent gain. That is the highest level for household spending since 4.8 percent in May, with that being the only other positive reading this year. The data series have been negative for most of the past year-and-a-half. Household spending has been a weak spot on Japan's economic recovery, and has been sluggish since the increase to the national sales tax in April 2014. While one healthy increase may not be enough to quiet calls for the Bank of Japan to consider expanding its already unprecedented stimulus program in a bid to raise inflation and encourage spending.
 August retail sales increased a monthly 0.4 percent after slipping 0.1 percent in July. On the year sales were 4.5 percent higher. In seasonally adjusted terms the largest contributor to the increase was food retailing (0.6 percent). Other retailing (1.3 percent), department stores (1.3 percent) and household goods retailing (0.2 percent) also gained. Clothing, footwear & personal accessory retailing was down 1.4 percent and cafes, restaurants & takeaway food services were down 0.3 percent. Sales were up in Victoria (0.9 percent), New South Wales (0.5 per cent), Western Australia (0.2 percent), South Australia (0.3 per cent) and Tasmania (0.4 percent). There were declines in Queensland (down 0.2 percent), the Northern Territory (down 0.9 percent) and the Australian Capital Territory (down 0.4 percent). August retail sales increased a monthly 0.4 percent after slipping 0.1 percent in July. On the year sales were 4.5 percent higher. In seasonally adjusted terms the largest contributor to the increase was food retailing (0.6 percent). Other retailing (1.3 percent), department stores (1.3 percent) and household goods retailing (0.2 percent) also gained. Clothing, footwear & personal accessory retailing was down 1.4 percent and cafes, restaurants & takeaway food services were down 0.3 percent. Sales were up in Victoria (0.9 percent), New South Wales (0.5 per cent), Western Australia (0.2 percent), South Australia (0.3 per cent) and Tasmania (0.4 percent). There were declines in Queensland (down 0.2 percent), the Northern Territory (down 0.9 percent) and the Australian Capital Territory (down 0.4 percent).
Investors were disappointed by the string of mediocre economic data from the U.S. and abroad. In Japan, the data indicate that perhaps there could be a technical recession in its future. In China, the woes continue. In the Eurozone, some stabilization is evident. Equities gyrated and were mixed globally at the end of the week. All indexes declined in September — a month to forget for an equity investor.
Central banks are front and center next week. No policy change is expected from the Reserve Bank of Australia, Bank of England or from the Bank of Japan this week, although analysts expect the BoJ to take action at its meeting at the end of the month.
| Central Bank activities |
|
| October 6,7 |
Japan |
Bank of Japan Monetary Policy Announcement |
| October 6 |
Australia |
Reserve Bank of Australia Monetary Policy Announcement |
| October 8 |
UK |
Bank of England Monetary Policy Announcement & Minutes |
|
United States |
FOMC Minutes Published |
| |
|
|
| The following indicators will be released this week... |
| Europe |
|
|
| October 5 |
Eurozone |
Services & Composite PMI (September) |
|
|
Retail Sales (August) |
|
Germany |
Services & Composite PMI (September) |
|
France |
Services & Composite PMI (September) |
|
UK |
Services PMI (September) |
| October 6 |
Germany |
Manufacturing Orders (August) |
| October 7 |
Germany |
Industrial Production (August) |
|
France |
Merchandise Trade (August) |
|
UK |
Industrial Production (August) |
| October 8 |
Germany |
Merchandise Trade (August) |
| October 9 |
France |
Industrial Production (August) |
|
Italy |
Industrial Production (August) |
|
UK |
Merchandise Trade (August) |
| |
|
|
| Asia/Pacific |
|
|
| October 8 |
Japan |
Private Machinery Orders (August) |
| |
|
|
| Americas |
|
|
| October 6 |
Canada |
International Trade (August) |
| October 8 |
Canada |
Housing Starts (September) |
| October 9 |
Canada |
Labour Force Survey (September) |
Anne D Picker is the author of International Economic Indicators and Central Banks.
|
