|
It's all the mixed data, the mixed messages from the economy that's building the FOMC suspense. The latest has something for everyone but maybe a little bit more for the doves, for those who see more risks in a rate hike than in no rate hike. The Federal Reserve's Beige Book, released during the week for the Fed's month-end FOMC meeting, is sending a very mixed message, one perhaps that's ultimately tilted to a downgrade for the economy. "Moderate" is as bold a description that any regional Fed bank is willing to dare, and only three of 12 venture this assessment of economic growth with the remaining nine somewhere below "moderate". The Beige Book describes total growth in consumer spending as, you guessed it, moderate but with vehicle spending showing special strength. The factory sector is described as mixed and generally lower from the last report with the negative effects of the strong dollar widely cited. Inflation, in part due to the strong dollar, is described as stable and little changed. But labor markets, in what is no surprise and a major arguing point for the hawks, are described as tightening. So, let's see for ourselves.
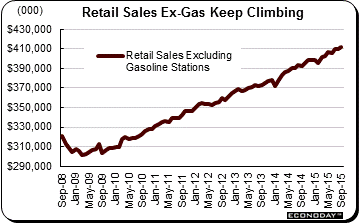 The moderate description for consumer spending seems too generous for the September retail sales report which inched only 0.1 percent higher. But that's just the surface. Underneath, moderate may be too cautious of a description. Gasoline prices have been badly skewing the retail sales report, leading to dismal sales totals at gasoline stations. Retail sales in the U.S. are measured in dollar terms, not volume terms, which means actual demand for gasoline could be rising very sharply at the same time that price declines for gasoline are actually sinking sales. The graph tracks retail dollar sales excluding gasoline and the slope couldn't be more impressive, moving from $300 million per month in 2009 to $412 million in the latest report and really underscoring the solid and dependable nature of U.S. consumer spending. The moderate description for consumer spending seems too generous for the September retail sales report which inched only 0.1 percent higher. But that's just the surface. Underneath, moderate may be too cautious of a description. Gasoline prices have been badly skewing the retail sales report, leading to dismal sales totals at gasoline stations. Retail sales in the U.S. are measured in dollar terms, not volume terms, which means actual demand for gasoline could be rising very sharply at the same time that price declines for gasoline are actually sinking sales. The graph tracks retail dollar sales excluding gasoline and the slope couldn't be more impressive, moving from $300 million per month in 2009 to $412 million in the latest report and really underscoring the solid and dependable nature of U.S. consumer spending.
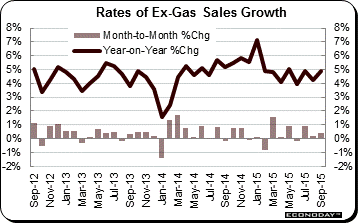 The next graph breaks up the dollar sales into monthly and yearly percentage terms. Month-over-month, retail sales excluding gasoline came in, not at a puny plus 0.1 percent, but at a very solid plus 0.4 percent (column in lower part of graph). Year-on-year, sales excluding gasoline rose to plus 4.9 percent (line in upper part of graph). By comparison, total retail sales, when including gasoline stations, are up at less than half that rate, at only 2.4 percent. Simply, the methodology of retail sales is skewing the view of retail sales. The next graph breaks up the dollar sales into monthly and yearly percentage terms. Month-over-month, retail sales excluding gasoline came in, not at a puny plus 0.1 percent, but at a very solid plus 0.4 percent (column in lower part of graph). Year-on-year, sales excluding gasoline rose to plus 4.9 percent (line in upper part of graph). By comparison, total retail sales, when including gasoline stations, are up at less than half that rate, at only 2.4 percent. Simply, the methodology of retail sales is skewing the view of retail sales.
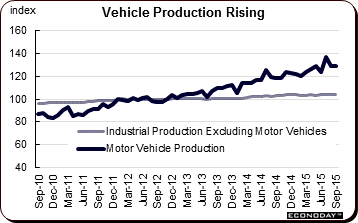 Low gasoline prices may be skewing retail sales lower but they have helped to boost what has been outstanding strength in vehicle sales this year, strength that is one of the lone pluses for an increasingly downbeat factory sector. The manufacturing component of the industrial production report slipped 0.1 percent in September for a second straight decline and the fourth decline in five months. Year-on-year, manufacturing production is up only 1.4 percent which isn't very much growth at all. Vehicle production, which swung up and down through the summer, settled in with a 0.2 percent gain for September. Looking at the long-term trend, vehicle production is at the top of the industrial production report with a year-on-year gain of 9.4 percent in strength that underscores the strength of domestic demand. Vehicles are not big exports for the U.S. which imports more than twice as many cars and trucks as it exports. When turning to market groups that are export dependent, the data take an unwanted turn. Business equipment production, which is closely tied to exports, slipped 1 tenth in September for a year-on-year increase of only 1.8 percent. The above graph tracks the rising slope of vehicle production against a much shallower slope when excluding vehicles. Low gasoline prices may be skewing retail sales lower but they have helped to boost what has been outstanding strength in vehicle sales this year, strength that is one of the lone pluses for an increasingly downbeat factory sector. The manufacturing component of the industrial production report slipped 0.1 percent in September for a second straight decline and the fourth decline in five months. Year-on-year, manufacturing production is up only 1.4 percent which isn't very much growth at all. Vehicle production, which swung up and down through the summer, settled in with a 0.2 percent gain for September. Looking at the long-term trend, vehicle production is at the top of the industrial production report with a year-on-year gain of 9.4 percent in strength that underscores the strength of domestic demand. Vehicles are not big exports for the U.S. which imports more than twice as many cars and trucks as it exports. When turning to market groups that are export dependent, the data take an unwanted turn. Business equipment production, which is closely tied to exports, slipped 1 tenth in September for a year-on-year increase of only 1.8 percent. The above graph tracks the rising slope of vehicle production against a much shallower slope when excluding vehicles.
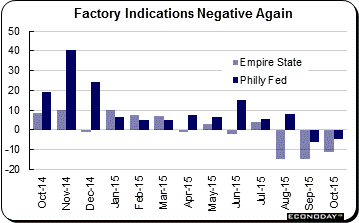 The industrial production report offers the first look at definitive factory data from September. A look at the first anecdotal data for October points to continued pressures. Minus signs continue to sweep the Empire State report with October's headline at minus 11.36. New orders were very weak at minus 18.92 for a fifth straight month of contraction. With unfilled orders also in deep contraction, manufacturers in the New York region will have an increasingly hard time keeping up shipments which have already been in contraction for the last three months. Similar results were posted by the closely watched Philly Fed's index, at minus 4.5 for October. New orders in this report, at minus 10.6, fell a very serious 20 points from September. The industrial production report offers the first look at definitive factory data from September. A look at the first anecdotal data for October points to continued pressures. Minus signs continue to sweep the Empire State report with October's headline at minus 11.36. New orders were very weak at minus 18.92 for a fifth straight month of contraction. With unfilled orders also in deep contraction, manufacturers in the New York region will have an increasingly hard time keeping up shipments which have already been in contraction for the last three months. Similar results were posted by the closely watched Philly Fed's index, at minus 4.5 for October. New orders in this report, at minus 10.6, fell a very serious 20 points from September.
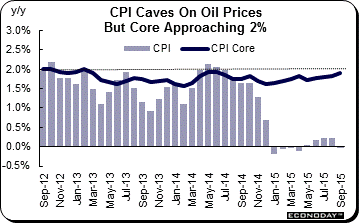 Even with slight contraction underway in the factory sector, the demand side of the economy still looks respectable which probably tilts the balancing point for Fed policy toward inflation and whether it's beginning to pick up toward their 2 percent goal. Total inflation, when including oil-related prices, remains very weak, actually in contraction for the consumer price index which fell 0.2 percent in September. But when stripping out food, which moved higher, and energy, which of course moved lower, the core CPI rose a promising 0.2 percent. Year-on-year, the core is moving higher, up 1 tenth and closer to the 2 percent line at 1.9 percent. Making the difference for the core rate are housing costs including rents which continue to rise. Even with slight contraction underway in the factory sector, the demand side of the economy still looks respectable which probably tilts the balancing point for Fed policy toward inflation and whether it's beginning to pick up toward their 2 percent goal. Total inflation, when including oil-related prices, remains very weak, actually in contraction for the consumer price index which fell 0.2 percent in September. But when stripping out food, which moved higher, and energy, which of course moved lower, the core CPI rose a promising 0.2 percent. Year-on-year, the core is moving higher, up 1 tenth and closer to the 2 percent line at 1.9 percent. Making the difference for the core rate are housing costs including rents which continue to rise.
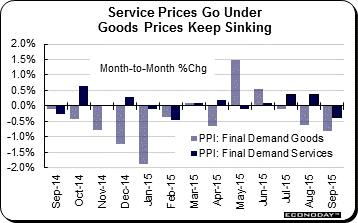 But other consumer price readings, at least if you're a Fed policy maker, are less encouraging including fundamental costs like education & communication, up only 0.4 percent year-on-year, or even medical care where year-on-year inflation is at an historically weak 2.4 percent. Producer prices were also released in the week and here there was a nasty surprise for policy makers, and that's a 0.4 percent decline in services as seen in the dark column on the very right of the graph. Service prices have an element of insulation from weakness in global demand, at least relative to goods prices which, as seen in the light column of the graph, have been in the negative column more times than not this year. Other readings included a 1.3 percent decline for finished goods where the year-on-year rate, following a long string of monthly declines, is down 4.1 percent. This is an important reading that points to pass through of low raw material prices. Hawks at the Fed are saying that the negative price effects from oil and low import prices will prove temporary. That may be, but the depth of ongoing price contraction in many readings continues to sink. But other consumer price readings, at least if you're a Fed policy maker, are less encouraging including fundamental costs like education & communication, up only 0.4 percent year-on-year, or even medical care where year-on-year inflation is at an historically weak 2.4 percent. Producer prices were also released in the week and here there was a nasty surprise for policy makers, and that's a 0.4 percent decline in services as seen in the dark column on the very right of the graph. Service prices have an element of insulation from weakness in global demand, at least relative to goods prices which, as seen in the light column of the graph, have been in the negative column more times than not this year. Other readings included a 1.3 percent decline for finished goods where the year-on-year rate, following a long string of monthly declines, is down 4.1 percent. This is an important reading that points to pass through of low raw material prices. Hawks at the Fed are saying that the negative price effects from oil and low import prices will prove temporary. That may be, but the depth of ongoing price contraction in many readings continues to sink.
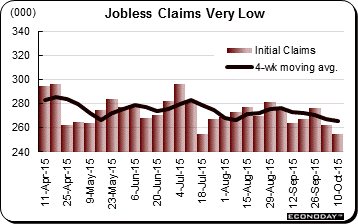 But the hawks do have a special card, and that's the amazing shrinkage underway in the unemployment side of the labor market. Initial jobless have settled in at historic lows, falling 7,000 in the October 10 week to 255,000 which matches the 42-year low posted in July. As a share of an increasingly larger labor market, the recent run in claims may be the lowest ever. The hawks can turn to this as a primary signal that wage pressures may be around the corner. But the hawks do have a special card, and that's the amazing shrinkage underway in the unemployment side of the labor market. Initial jobless have settled in at historic lows, falling 7,000 in the October 10 week to 255,000 which matches the 42-year low posted in July. As a share of an increasingly larger labor market, the recent run in claims may be the lowest ever. The hawks can turn to this as a primary signal that wage pressures may be around the corner.
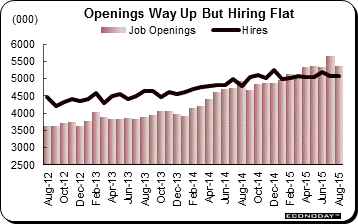 But there is less encouraging news from the JOLTS report where job openings fell back, to 5.370 million in August from, however, an unusually strong 5.668 million in July. As seen in the columns of the graph, the latest dip in openings follows a convincing 2-year build in openings and may well prove to be an outlier. Even if it's not an outlier and proves the beginning of a flattening trend, openings relative to hiring remains low. Hirings, the line on the graph, were unchanged in the latest report at 3.6 percent to extend a flat trend that belies actual employer demand for labor. This is strong evidence that employers are having a hard time finding people to fill jobs, a precursor perhaps to wage inflation. But there is less encouraging news from the JOLTS report where job openings fell back, to 5.370 million in August from, however, an unusually strong 5.668 million in July. As seen in the columns of the graph, the latest dip in openings follows a convincing 2-year build in openings and may well prove to be an outlier. Even if it's not an outlier and proves the beginning of a flattening trend, openings relative to hiring remains low. Hirings, the line on the graph, were unchanged in the latest report at 3.6 percent to extend a flat trend that belies actual employer demand for labor. This is strong evidence that employers are having a hard time finding people to fill jobs, a precursor perhaps to wage inflation.
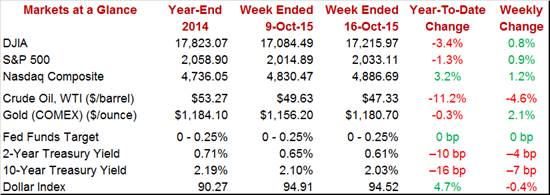
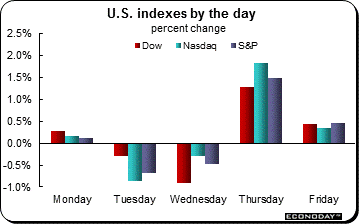 Risk vs Safety? The rebound for the stock market has not been coming at the expense of the bond market where money continues to flow in and where fear of a rate hike seems pretty low. But if the Fed suddenly turns hawkish, where will all this money go? Into the stock market perhaps? Perhaps not if a rate hike would lower growth expectations for the economy. The 2-year yield posted a weekly decline of 4 basis points to a very thin 0.61 percent with the 10-year down 7 basis points to 2.03 percent. The Dow had a good week, up 0.9 percent to 17,215 with the S&P 500 and Nasdaq posting similar gains. Oil swung lower, ending the week near $47.25, with gold moving about $25 higher to $1,180. Risk vs Safety? The rebound for the stock market has not been coming at the expense of the bond market where money continues to flow in and where fear of a rate hike seems pretty low. But if the Fed suddenly turns hawkish, where will all this money go? Into the stock market perhaps? Perhaps not if a rate hike would lower growth expectations for the economy. The 2-year yield posted a weekly decline of 4 basis points to a very thin 0.61 percent with the 10-year down 7 basis points to 2.03 percent. The Dow had a good week, up 0.9 percent to 17,215 with the S&P 500 and Nasdaq posting similar gains. Oil swung lower, ending the week near $47.25, with gold moving about $25 higher to $1,180.
The lack of jobless claims is a reminder that a major turn higher for the employment report, whether for October or November, could outright seal a rate hike. Without, however, increasing strength in payroll growth or an unexpected uptick in the PCE core rate, the arguments to begin withdrawing stimulus may not be persuasive enough for an FOMC whose only play since the June meeting has been to punt downfield.
Housing is the theme! The new home sector opens the week Monday with the housing market index for October followed on Tuesday by September housing starts & permits. Strength is expected for both these reports which would underscore the health of the new home market. The existing home market has been less strong though a respectable gain is expected for September's report on Thursday. Strength in house prices has been limited this year but is still a positive for homeowners and Thursday's FHFA data will offer the latest. Also out in the week will be jobless claims on Thursday, where the sample week matches the sample week for the monthly employment report, and the manufacturing PMI on Friday which will offer a flash October reading from the struggling sector.
The housing market index has been running at 10-year highs and steady news is expected for the October reading, at a consensus 62 for no change. The only lagging component has been traffic but this has been on the climb in recent reports. Supply of new homes on the market is low and interest rates are low, two central positives to motivate builders.
Housing Market Index - Consensus Forecast for October: 62.0
Range: 60.0 to 63.0
Housing starts are expected to rise 2.0 percent in September to a 1.149 million annual rate after falling back a sharp 3.0 percent in August. Housing permits, in contrast, jumped 3.5 percent in August and for September are expected to come in unchanged. Permits for single-family homes, a leading indicator for the new home sector, are at their best levels since 2008. For starts, the key will be whether construction is picking up for multi-family homes where permits jumped during the spring.
Housing Starts, Level, Adj. Annual Rate - Consensus Forecast for September: 1.147 mln
Range: 1.100 to 1.205 mln
Housing Permits, Level, Adj. Annual Rate - Consensus Forecast for September: 1.170 mln
Range: 1.150 to 1.211 mln
Jobless claims are expected to rise slightly to 265,000 in the October 10 week, near its run of lows that include the prior week's 42-year low of 255,000. For the last six months, claims have been signaling very tight conditions in the labor market and have lately been signaling even tighter conditions.
Initial Jobless Claims - Consensus Forecast for October 10 Week: 265,000
Range: 245,000 to 270,000
September wasn't a great month for the economy, at least not for employment or for the factory sector. The national activity index is expected to slip but only fractionally, at a consensus minus 0.05 which would point to only slightly below average growth in the month.
National Activity Index - Consensus Forecast for September: -0.05
Range: -0.45 to +0.25
House prices have been on the climb, boosted by limited homes on the market and a lower share of distressed homes. The FHFA house price index, after jumping 0.6 percent in the prior report, is expected to post another very solid gain of 0.5 percent in data for August. Year-on-year, price growth in this report is approaching 6.0 percent.
FHFA House Price Index - Consensus Forecast for August: +0.5%
Range: +0.4% to +0.9%
Existing home sales are expected to bounce back 0.8 percent to a 5.35 million annual rate in September following a sharp 4.8 percent drop in August to 5.31 million. But the drop followed a run of prior strength and did little to slow what has been this year's solid upward trend for existing home sales. Still, the August report was weak and included the lowest median price, at $228,700, since August last year.
Existing Home Sales, Level, Adj. Annual Rate - Consensus for September: 5.35 mln
Range: 5.25 to 5.50 mln
Held down by factory components and lower stock prices, the index of leading economic indicators has been flat the past two reports and isn't expected to bounce back at all in September, at a consensus of no change.
Index of Leading Economic Indicators - Consensus for September: +0.0%
Range: -0.2% to +0.2%
The manufacturing PMI flash has been holding safely above the breakeven level of 50 but has nevertheless been inching to 2-year lows, the result of weak foreign demand and general caution among customers. Orders, production, and employment have all been slowing while price readings have been sliding. Forecasters see the October flash coming in little changed at 53.0. Though levels in this report have been holding in the plus column, actual factory orders and shipments as tracked by the government have been edging into contraction over the past year.
Manufacturing PMI, Flash - Consensus for October: 53.0
Range: 51.5 to 54.3
|
