|
Housing took the week's headlines and the results are mostly strong but not exactly robust. There is also a run of updates out of the factory sector though these are a little hard to read. Not hard to read is the latest on the unemployment side of the jobs market, a side that increasingly points to labor market strength.
 About the only place you can find any inflation at all anymore is in home prices, and there's not a lot of it any case. Home-price appreciation slowed in August, to plus 0.3 percent for FHFA's house price index from 0.5 percent in July. Year-on-year appreciation, which had been edging up toward 6 percent in this report, moved down to 5.5 percent as seen in the dark line of the graph. FHFA prices may be falling back to Case-Shiller prices, the light line in the graph which has been fighting to keep at a 5.0 percent pace. Other price data haven't been very hot either, with prices for new homes barely changed and with prices for existing home prices up in the 6 percent range. Modest rates of home-price appreciation are not much of a positive for household wealth but they haven't been hurting consumer confidence which, thanks to low unemployment, remains solid. About the only place you can find any inflation at all anymore is in home prices, and there's not a lot of it any case. Home-price appreciation slowed in August, to plus 0.3 percent for FHFA's house price index from 0.5 percent in July. Year-on-year appreciation, which had been edging up toward 6 percent in this report, moved down to 5.5 percent as seen in the dark line of the graph. FHFA prices may be falling back to Case-Shiller prices, the light line in the graph which has been fighting to keep at a 5.0 percent pace. Other price data haven't been very hot either, with prices for new homes barely changed and with prices for existing home prices up in the 6 percent range. Modest rates of home-price appreciation are not much of a positive for household wealth but they haven't been hurting consumer confidence which, thanks to low unemployment, remains solid.
 Confidence among homebuilders is more than solid. The homebuilder's housing market index is at 10 year highs. The composite for October gained 3 points to 64 and beat out top estimates with strength in the current sales component, at 70 for another 3 point gain, pointing to further strength for new home sales. But it's the six-month sales index, the dark line in the graph, that's showing the most strength, jumping 7 points to 75. All along the course of the graph, the six-month component leads the present sales component higher — and with more to go! By region, strength is centered in both the West, which is a key area of growth for new homes, and the South which is by far the largest region for new homes. Confidence among homebuilders is more than solid. The homebuilder's housing market index is at 10 year highs. The composite for October gained 3 points to 64 and beat out top estimates with strength in the current sales component, at 70 for another 3 point gain, pointing to further strength for new home sales. But it's the six-month sales index, the dark line in the graph, that's showing the most strength, jumping 7 points to 75. All along the course of the graph, the six-month component leads the present sales component higher — and with more to go! By region, strength is centered in both the West, which is a key area of growth for new homes, and the South which is by far the largest region for new homes.
 Sales of new homes will be posted this Monday, October 26th, but existing home sales were posted during the last week. And they bounced back very strongly in September, up 4.7 percent to nearly reverse the prior month's 5.0 percent decline. The columns in the graph to the right track the annual sales rate of existing homes. Those for September, at 5.55 million, and for July, at 5.58 million, are the two best rates of the recovery, and they make August's big dip look like at outlier. The strength in sales, boosted by soft prices, has come in a very thin market where supply is at 4.8 months vs 5.4 months a year ago and vs 6.0 months which is considered the balancing point for supply and demand. Prices will have to pick up, however, to bring more homes into the market. Sales of new homes will be posted this Monday, October 26th, but existing home sales were posted during the last week. And they bounced back very strongly in September, up 4.7 percent to nearly reverse the prior month's 5.0 percent decline. The columns in the graph to the right track the annual sales rate of existing homes. Those for September, at 5.55 million, and for July, at 5.58 million, are the two best rates of the recovery, and they make August's big dip look like at outlier. The strength in sales, boosted by soft prices, has come in a very thin market where supply is at 4.8 months vs 5.4 months a year ago and vs 6.0 months which is considered the balancing point for supply and demand. Prices will have to pick up, however, to bring more homes into the market.
 There wasn't really any bad news in the week on housing but the permits half of the housing starts & permits report wasn't exactly on fire. Starts, driven by a spike in multi-family units, came in much stronger than expected in September, but permits fell 5.0 percent to a 1.103 million annual rate that came in much weaker than expected. As the graph shows, permits for single-family homes have been leveling off at the 700,000 line at the same time that permits for multi-family homes have been coming down from a May and June surge. It was this surge in permits that, several months later, translated into an 18.3 percent jump for multi-family starts in the September report. Total starts jumped 6.5 percent in the month to a 1.206 million annual rate which was well beyond expectations and the second best of the recovery. Year-on-year, starts are up 17.5 percent. But those, however, are only starts. Permits, which are the leading indicator, are telling a different story, up only 4.7 percent year-on-year. There wasn't really any bad news in the week on housing but the permits half of the housing starts & permits report wasn't exactly on fire. Starts, driven by a spike in multi-family units, came in much stronger than expected in September, but permits fell 5.0 percent to a 1.103 million annual rate that came in much weaker than expected. As the graph shows, permits for single-family homes have been leveling off at the 700,000 line at the same time that permits for multi-family homes have been coming down from a May and June surge. It was this surge in permits that, several months later, translated into an 18.3 percent jump for multi-family starts in the September report. Total starts jumped 6.5 percent in the month to a 1.206 million annual rate which was well beyond expectations and the second best of the recovery. Year-on-year, starts are up 17.5 percent. But those, however, are only starts. Permits, which are the leading indicator, are telling a different story, up only 4.7 percent year-on-year.
 It's sometimes difficult to get a handle on differing manufacturing data, specifically the comparison between the heavy run of diffusion-based reports, which are based on questionnaires in a small sample, and government data which are based on actual output from a very large sample. The former, of course, are handy as they are quickly compiled and are released well in advance of the government data. But the message doesn't always fit. As seen on the graph, the factory sector itself has been in contraction for the last year. New orders have fallen steadily from the $505 billion per month level to just over $470 billion in the latest available data which are for August. The decline in new orders has set off similar declines in other factory measures, whether production or employment. It's sometimes difficult to get a handle on differing manufacturing data, specifically the comparison between the heavy run of diffusion-based reports, which are based on questionnaires in a small sample, and government data which are based on actual output from a very large sample. The former, of course, are handy as they are quickly compiled and are released well in advance of the government data. But the message doesn't always fit. As seen on the graph, the factory sector itself has been in contraction for the last year. New orders have fallen steadily from the $505 billion per month level to just over $470 billion in the latest available data which are for August. The decline in new orders has set off similar declines in other factory measures, whether production or employment.
 Not showing a long run of contraction, however, have been the diffusion composites from both the ISM and Markit Economics (the latter tracked in the line on the graph). Over the past year, this line has held well above the breakeven 50 point as measured by the right axis. The left axis tracks the percentage change of actual monthly factory orders where zero of course is the breakeven point. Not once has Markit's manufacturing PMI broken below to 50 to indicate monthly contraction. Not even close! But monthly contraction is the name of the game, hitting factory orders 9 times in 12 months. To read these indexes can be touchy! Note that the September and October columns have yet to be posted in what does illustrate, however, the main advantage of diffusion reports — timeliness. Not showing a long run of contraction, however, have been the diffusion composites from both the ISM and Markit Economics (the latter tracked in the line on the graph). Over the past year, this line has held well above the breakeven 50 point as measured by the right axis. The left axis tracks the percentage change of actual monthly factory orders where zero of course is the breakeven point. Not once has Markit's manufacturing PMI broken below to 50 to indicate monthly contraction. Not even close! But monthly contraction is the name of the game, hitting factory orders 9 times in 12 months. To read these indexes can be touchy! Note that the September and October columns have yet to be posted in what does illustrate, however, the main advantage of diffusion reports — timeliness.
 But there are diffusion reports which have been signaling contraction. This graph tracks this year's Empire State, Philly Fed, and Kansas City reports. Here, unlike 50 for the ISM and Markit readings, the breakeven is zero, but the methodology is the same. These indexes appear to be more accurate as a gauge for the national factory sector, which actually should be worrisome! The factory sector is getting hit by weak exports and by contraction in the energy sector. And in another thing to worry about, price readings in all the reports have been very weak including those for finished goods where many are in contraction. Watch for the Dallas and Richmond Fed reports early this week to see if all the contraction continues. But there are diffusion reports which have been signaling contraction. This graph tracks this year's Empire State, Philly Fed, and Kansas City reports. Here, unlike 50 for the ISM and Markit readings, the breakeven is zero, but the methodology is the same. These indexes appear to be more accurate as a gauge for the national factory sector, which actually should be worrisome! The factory sector is getting hit by weak exports and by contraction in the energy sector. And in another thing to worry about, price readings in all the reports have been very weak including those for finished goods where many are in contraction. Watch for the Dallas and Richmond Fed reports early this week to see if all the contraction continues.
 One thing that is definitely continuing, and which is a real puzzle, is the exceptionally low level of initial jobless claims. Initial claims came in at a lower-than-expected 259,000 in the October 17 week, just up from the prior week's near 42-year low of 256,000. The 4-week average, the line in the graph, is at a new 42-year low, down 2,000 to 265,250. The October 17 week was also the sample week for the October employment report and a comparison with the sample week of the September employment report shows improvement, down 5,000 with the 4-week average down a more tangible 9,250. This report may not be pointing to rising job growth but it is pointing to continued decline in the employment rate. As a share of the total labor market, jobless claims may have never been so low. One thing that is definitely continuing, and which is a real puzzle, is the exceptionally low level of initial jobless claims. Initial claims came in at a lower-than-expected 259,000 in the October 17 week, just up from the prior week's near 42-year low of 256,000. The 4-week average, the line in the graph, is at a new 42-year low, down 2,000 to 265,250. The October 17 week was also the sample week for the October employment report and a comparison with the sample week of the September employment report shows improvement, down 5,000 with the 4-week average down a more tangible 9,250. This report may not be pointing to rising job growth but it is pointing to continued decline in the employment rate. As a share of the total labor market, jobless claims may have never been so low.
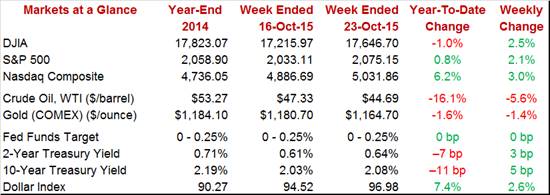
 Thursday's big surprise was the cancelling of the monthly 2-year note auction. The Treasury is very busy right now, not only calling on law makers to come to their senses but technically busy also, that is trying to stay within their existing borrowing limit while not running out of money at the same time. Demand for the 2-year note surged on the announcement with the yield jolting 5 basis points lower to 0.58 percent before backing out on Friday. Demand along the whole curve is very strong with the 10-year at a very low 2.08 percent. Judging by Treasuries, there doesn't seem to be any fear at all of a rate hike any time soon. The dollar had a strong week or rather the euro had a soft week on expectations that the ECB, in an effort to fight off deflation, is about to expand its quantitative easing program. The dollar index jumped 2.6 percent in the week. Stocks also had a good week with indexes up in the 2 to 3 percent range and with the S&P 500 back on the plus side for the year. WTI no longer seems to be testing $50, moving below $45 as crude inventories continue to swell. Thursday's big surprise was the cancelling of the monthly 2-year note auction. The Treasury is very busy right now, not only calling on law makers to come to their senses but technically busy also, that is trying to stay within their existing borrowing limit while not running out of money at the same time. Demand for the 2-year note surged on the announcement with the yield jolting 5 basis points lower to 0.58 percent before backing out on Friday. Demand along the whole curve is very strong with the 10-year at a very low 2.08 percent. Judging by Treasuries, there doesn't seem to be any fear at all of a rate hike any time soon. The dollar had a strong week or rather the euro had a soft week on expectations that the ECB, in an effort to fight off deflation, is about to expand its quantitative easing program. The dollar index jumped 2.6 percent in the week. Stocks also had a good week with indexes up in the 2 to 3 percent range and with the S&P 500 back on the plus side for the year. WTI no longer seems to be testing $50, moving below $45 as crude inventories continue to swell.
Strength in housing will definitely help offset weakness in the factory sector but probably not much more than that. And the strength that there is in housing, given the softness in prices, isn't likely to fire up the hawks much at the FOMC. The economy's strength lies in the consumer who's getting a lift, if not from wages, than at least by having a job.
There may be virtually no expectations for a rate hike, but Wednesday's FOMC statement still headlines the week's news. Focus will be on any wording changes, whether on inflation or on China for instance, that could raise the chances or further lower the chances for a December liftoff. There is a run of market-moving indicators leading off Monday with new home sales where a gain, against a tough comparison, isn't expected. The factory sector has been moving down all year and more of the same is expected for durable goods orders on Tuesday. The first estimate for third-quarter GDP will be posted on Thursday and soft growth, at only 1.7 percent, is the call. And Friday is also an important day with two Fed favorites — the core PCE price index which has been running cold and the employment cost index where a prior collapsed pushed back the liftoff outlook.
Samples are small and new home sales can move wildly, as they did in August and July with gains of 5.7 percent and 12.0 percent. Against these tough comparisons, a 0.6 percent dip is expected for September, one that wouldn't lower the outlook for what is — the new home sector — one of the strengths of the 2016 economy. Supply has been very low, at 4.7 months in September, but prices have been showing very little life with the median up only in the mid single digits.
New Home Sales, Annual Rate - Consensus Forecast for September: 549,000
Range: 535,000 to 560,000
The Dallas Fed manufacturing index has been posting deeply negative readings, at minus 9.5 in September with October expected to come in at minus 6.0. One plus for the Dallas report is the Kansas City report which came in at only minus 1 in October. Like Dallas, the Kansas City report has been badly depressed by weakness in the energy sector and the solid bounce in October could mean the worst is over for both.
Dallas Fed Manufacturing Index - Consensus Forecast for October: -6.0
Range: -7.0 to -5.0
Durable goods orders are expected to dip 1.0 percent in September with the ex-transportation reading, where aircraft are stripped out, showing only marginal weakness at minus 0.1 percent. This report, together with the manufacturing component of the industrial production report, are definitive indicators for the factory sector, and both have been showing significant weakness over the last year. Softness in exports, the result of the strong dollar and weak foreign demand, has been tipping the factory sector into the contractionary column.
Durable Goods Orders, M/M Chg - Consensus Forecast for September: -1.0%
Range: -4.0% to +0.2%
Durable Goods Orders, Ex-Transportation - Consensus Forecast for September: -0.1%
Range: -0.6% to +1.2%
S&P Case Shiller data have been soft and more of the same is expected for August, with the Econoday consensus calling for only a 0.1 percent gain for the adjusted 20-city index. Prices for existing homes haven't shown much reaction to the very low levels of supply on the market, as sellers, despite the strength in sales, are still giving concessions. But even at mid-single digit year-on-year growth, home prices are at least one source of inflation in what has become, at least for now, a disinflationary economy.
S&P Case-Shiller 20-City Adj. Index, M/M Chg - Consensus Forecast for August: +0.1%
Range: -0.1% to +0.6%
S&P Case-Shiller 20-City Unadj. Index, M/M Chg - Consensus Forecast for August: +0.6%
Range: +0.3% to +0.9%
S&P Case-Shiller 20-City Unadj. Index, Y/Y Chg - Consensus Forecast for August: +5.1%
Range: +4.9% to +5.7%
The services PMI flash has been holding solidly above 50 as domestic demand has yet to show any significant slowing from weakness in global demand. Employment, repeatedly described as robust in this report, has been an upside outlier. Not an outlier are final prices which in the September report posted their first back-to-back contraction in the six-year history of the report. A small 3 tenths decline to 55.3 is expected for the October flash.
Services PMI - Consensus Forecast for October, Flash: 55.3
Range: 54.8 to 55.6
Despite expectations for a pull back, the consumer confidence index has been posting a series of very strong readings that have been immune to troubles in foreign demand or global financial markets. Job readings have been unusually strong in this report but have yet to be confirmed by strength in government job data. The Econoday consensus for October is calling for only a 1/2 point decline to a still very positive 102.5.
Consumer Confidence Index - Consensus Forecast for October: 102.5
Range: 100.0 to 106.0
Richmond Fed's manufacturing index had held out as one of the strongest of the regional Fed surveys, but that was before September when it too dipped into the negative column at minus 5. Order readings were deeply negative in September with price readings, like in other reports, pointing south. The Econoday consensus is calling for minus 2 in October.
Richmond Fed Manufacturing Index - Consensus Forecast for October: -2
Range: -4 to 0
Real GDP, after rising 3.9 percent in the second quarter, is expected to slow to a modest plus 1.7 percent in the first estimate for the third quarter. Wide slowing is expected though residential investment, in a reflection of housing strength, is expected to be a plus. Net exports and nonresidential fixed investment are expected to be negatives, as are inventories as businesses grew cautious over the outlook.
Real GDP, 1st Estimate, Adj. Annual Rate - Consensus Forecast for 3rd Quarter: +1.7%
Range: +1.0% to +2.3%
GDP Price Index, 1st Estimate - Consensus Forecast for 3rd Quarter: +1.4%
Range: +0.8% to +2.0%
Jobless claims are expected to rise slightly to 265,000 in the October 17 week, holding near a very impressive run of deep lows. For the last six months, claims have been signaling very tight conditions in the labor market and have been signaling even tighter conditions of late.
Initial Jobless Claims - Consensus Forecast for October 17 Week: 265,000
Range: 254,000 to 270,000
Pending home sales are expected to bounce back from August's 1.4 percent decline with a 1.0 percent gain in September. Sales of existing homes, boosted by low mortgage rates and moderate prices, have been strong this year though they did slow during the summer.
Pending Home Sales, M/M Chg. - Consensus for September: +1.0%
Range: -1.0% to +2.5%
The core PCE price index is the last major hurdle before the October FOMC and not much pressure is expected with the Econoday consensus at plus 0.2 percent, a monthly gain that does not point to a spike for the year-on-year rate which was far below the Fed's 2 percent target at only plus 1.3 percent in August. Personal income and personal spending have been running at respectable rates of growth but are expected to slow to 0.2 percent gains.
Personal Income, M/M Chg. - Consensus for September: +0.2%
Range: 0.0% to +0.4%
Personal Spending, M/M Chg. - Consensus for September: +0.2%
Range: +0.1% to +0.4%
PCE Price Index, M/M Chg. - Consensus for September: -0.1%
Range: -0.3% to +0.2%
Core PCE Price Index M/M Chg. - Consensus for September: +0.2%
Range: +0.1% to +0.2%
The employment cost index is perhaps the single most underrated report on the calendar. It's importance among policy makers, who repeatedly cite its results, is not easily exaggerated. The second-quarter result of only plus 0.2 percent stands as the lowest in the 33-year history of the report, though a strong bounce back of 0.6 percent is expected for the third quarter. An unusually high reading, such as the top end estimate for plus 0.9 percent, could very well point to a December rate hike.
Employment Cost Index, Q/Q Chg. - Consensus for 3rd Quarter: +0.6%
Range: +0.5% to +0.9%
The Chicago PMI is a one of a kind, a regional report that tracks the whole scope of the economy, at least for Chicago. Big swings are the norm for this closely watched report but one isn't expected for October with the consensus calling for marginal monthly contraction, at 49.2 for what would be a small 1/2 point gain.
Chicago PMI - Consensus for Third Quarter: 49.2
Range: 48.0 to 51.5
Consumer sentiment rose sharply in the flash report for October, up nearly 5 points from September but no give back is expected for the final reading with the Econoday consensus at 92.5 for a 4 tenths gain. Gains in this report would not only give a boost to expectations for holiday sales but also perhaps, for a December rate hike.
Consumer Sentiment - Consensus for October, Final: 92.5
Range: 90.0 to 93.5
|
