|
One thing that is certain is that the outcome of the December FOMC is yes, absolutely not certain. Fed futures have the odds right now at 50/50 whether the Fed immortalizes the December meeting with the long anticipated 25-basis-point liftoff. The odds going into the October FOMC were 2 to 1 against a December rate hike. It wasn't the statement's description of the U.S. economy that was behind the expectations move, but the shock proclamation that liftoff next December will definitely be front and center. Yet really, all the sensation aside, it's probably going to take an upturn in economic strength, at least a little, to trigger the liftoff and this week's data, on net, doesn't quite fit the bill, especially for a Fed that has voted 9 to 1 to keep policy unchanged the last two meetings.
 It certainly wasn't the FOMC's updates on inflation, which were just about unchanged, that shook up the outlook for the December FOMC. The core PCE price index, which is the Fed's favorite inflation gauge and the dark line in the graph, held unchanged from a year ago at plus 1.3 percent in September, holding well under the 2 percent line which is the Fed's definitive policy goal for this reading. But the light line, which is the core CPI, is now right at the 2 percent line, moving up 1 tenth to 1.9 percent. Note a more robust methodology is what makes the PCE more closely watched. Unlike the CPI, the PCE allows for product substitutions to lower priced goods when prices of preferred goods move higher, a factor which explains why, as seen in the graph, it tracks below the CPI. It certainly wasn't the FOMC's updates on inflation, which were just about unchanged, that shook up the outlook for the December FOMC. The core PCE price index, which is the Fed's favorite inflation gauge and the dark line in the graph, held unchanged from a year ago at plus 1.3 percent in September, holding well under the 2 percent line which is the Fed's definitive policy goal for this reading. But the light line, which is the core CPI, is now right at the 2 percent line, moving up 1 tenth to 1.9 percent. Note a more robust methodology is what makes the PCE more closely watched. Unlike the CPI, the PCE allows for product substitutions to lower priced goods when prices of preferred goods move higher, a factor which explains why, as seen in the graph, it tracks below the CPI.
 Core inflation readings aren't really pointing to any urgency for a rate hike and neither, perhaps, is the employment cost index whose importance to FOMC policy makers, who cite it frequently, is hard to exaggerate. The year-on-year rate of change for this index is right at the 2 percent line and has been trending lower this year, down from the mid 2 percent range. But quarter-to-quarter readings are perhaps showing some pressure as seen in the graph. Quarter-to-quarter, the ECI rose 0.6 percent in the third quarter for the fourth high-side reading in the last six quarters. Yes, the second quarter came in at a record low of plus 0.2 percent but, even including this, the index has averaged a not-so-quiet 0.6 percent rise over the last six quarters. This is the strongest run of the recovery. Core inflation readings aren't really pointing to any urgency for a rate hike and neither, perhaps, is the employment cost index whose importance to FOMC policy makers, who cite it frequently, is hard to exaggerate. The year-on-year rate of change for this index is right at the 2 percent line and has been trending lower this year, down from the mid 2 percent range. But quarter-to-quarter readings are perhaps showing some pressure as seen in the graph. Quarter-to-quarter, the ECI rose 0.6 percent in the third quarter for the fourth high-side reading in the last six quarters. Yes, the second quarter came in at a record low of plus 0.2 percent but, even including this, the index has averaged a not-so-quiet 0.6 percent rise over the last six quarters. This is the strongest run of the recovery.
 The FOMC continues to characterize U.S. economic growth as moderate, and moderate the third-quarter report was with a 1.5 percent headline annualized rate, only 2 tenths lower than the average of the prior four quarters. And the rate would have been close to 3.0 percent if it wasn't for a slowing build in inventories, one tied to business caution over the business outlook. This nuance won't get past the hawks on the FOMC who will be warning that the current downturn may really just be no more than an inventory downturn. Outside of inventories, the demand nuts and bolts are very solid. Final sales rose a very respectable 3.0 percent in the quarter in a gain that points to underlying momentum for the fourth quarter. The FOMC continues to characterize U.S. economic growth as moderate, and moderate the third-quarter report was with a 1.5 percent headline annualized rate, only 2 tenths lower than the average of the prior four quarters. And the rate would have been close to 3.0 percent if it wasn't for a slowing build in inventories, one tied to business caution over the business outlook. This nuance won't get past the hawks on the FOMC who will be warning that the current downturn may really just be no more than an inventory downturn. Outside of inventories, the demand nuts and bolts are very solid. Final sales rose a very respectable 3.0 percent in the quarter in a gain that points to underlying momentum for the fourth quarter.
 This graph tracks the personal consumption expenditures component of the GDP report. Household consumption has been very resilient the last two years, coming in at a very welcome plus 3.2 percent rate in the third quarter. Service spending, an area insulated from global factors, continues to show solid resilience. But it was spending on durables, including vehicles, that was the strongest consumer category in the quarter. Household spending in fact got an upgrade by the FOMC in the week to solid from moderate. Housing, however, didn't get an upgrade. This graph tracks the personal consumption expenditures component of the GDP report. Household consumption has been very resilient the last two years, coming in at a very welcome plus 3.2 percent rate in the third quarter. Service spending, an area insulated from global factors, continues to show solid resilience. But it was spending on durables, including vehicles, that was the strongest consumer category in the quarter. Household spending in fact got an upgrade by the FOMC in the week to solid from moderate. Housing, however, didn't get an upgrade.
 The big surprises in the week were two housing reports both of which, to put it less than sensitively, more or less collapsed. The pending home sales index, the line on the graph, fell 2.3 percent to 106.8 for the largest drop in nearly 2 years and the weakest index level since January. The drop changes the outlook for final sales of existing home sales, the shaded area in the graph. Final sales had been climbing nicely through July and a rebound in September had made the unfortunate drop in August look like an outlier. But now, the pending sales index is making August look more like a pivot point downward. The report cited a lack of low priced homes on the market as a key negative, one that's pulling down total sales and keeping first-time buyers out. Uncertainty in the financial markets was also cited, perhaps making buyers take a wait-and-see approach. Year-on-year, pending sales are up only 3.0 percent which is very weak and far below, what had been at least, the nearly double-digit pace for final sales of existing homes. The big surprises in the week were two housing reports both of which, to put it less than sensitively, more or less collapsed. The pending home sales index, the line on the graph, fell 2.3 percent to 106.8 for the largest drop in nearly 2 years and the weakest index level since January. The drop changes the outlook for final sales of existing home sales, the shaded area in the graph. Final sales had been climbing nicely through July and a rebound in September had made the unfortunate drop in August look like an outlier. But now, the pending sales index is making August look more like a pivot point downward. The report cited a lack of low priced homes on the market as a key negative, one that's pulling down total sales and keeping first-time buyers out. Uncertainty in the financial markets was also cited, perhaps making buyers take a wait-and-see approach. Year-on-year, pending sales are up only 3.0 percent which is very weak and far below, what had been at least, the nearly double-digit pace for final sales of existing homes.
 New home sales are even uglier, falling to an annualized rate of 468,000 in September which is an astonishing 67,000 below Econoday's lowest estimate. Making matters worse was a steep 33,000 downward revision to August. This is not good news for builders as the drop in sales together with a rise in homes on the market are making for a big surge in relative supply, to 5.8 months from 4.9 months in August and 5.5 months from September last year. This turns around what had been a market of very thin supply to one of nearly balanced supply (which is generally judged at 6.0 months). One likely factor holding down sales is a rise in prices where the median rose 2.7 percent in the month to $296,900 for a 13.5 percent increase from a year ago. And price appreciation is now way out in front of actual year-on-year sales growth which is now only 2.0 percent for new homes. Though the data are appallingly weak, small samples can make for severe volatility and nowhere is this more apparent than in the new home sales report. New home sales are even uglier, falling to an annualized rate of 468,000 in September which is an astonishing 67,000 below Econoday's lowest estimate. Making matters worse was a steep 33,000 downward revision to August. This is not good news for builders as the drop in sales together with a rise in homes on the market are making for a big surge in relative supply, to 5.8 months from 4.9 months in August and 5.5 months from September last year. This turns around what had been a market of very thin supply to one of nearly balanced supply (which is generally judged at 6.0 months). One likely factor holding down sales is a rise in prices where the median rose 2.7 percent in the month to $296,900 for a 13.5 percent increase from a year ago. And price appreciation is now way out in front of actual year-on-year sales growth which is now only 2.0 percent for new homes. Though the data are appallingly weak, small samples can make for severe volatility and nowhere is this more apparent than in the new home sales report.
 It hasn't been since way back when, back in April in fact, that the FOMC statement included a reference to consumer sentiment, which in that statement cited its strength. Since then, however, consumer sentiment readings haven't in general been trending any higher and are now showing less strength — and especially lately. One reading, the weekly Bloomberg consumer comfort index, is showing weakness through the last half of October, falling noticeably to 42.8 from a mid-month 45.2. The consumer sentiment index, released every other week, slowed to an 88 pace in the last half of the month vs a 92 pace in the first half. And it was a not-so-encouraging decline in the assessment of the current jobs market that pulled down the monthly consumer confidence index to 97.6 in October, well below Econoday's lowest forecast and 5.0 points below September. And buying plans for vehicles in the consumer confidence report are especially weak, perhaps hinting at shopping exhaustion after a year of heavy buying. Jobs are what make the consumer happy and these reports do not point to improved payroll growth nor to acceleration for household spending. The graph tracks the consumer sentiment index against the consumer confidence index. Note that both posted recovery peaks in January this year and haven't done any better since. It hasn't been since way back when, back in April in fact, that the FOMC statement included a reference to consumer sentiment, which in that statement cited its strength. Since then, however, consumer sentiment readings haven't in general been trending any higher and are now showing less strength — and especially lately. One reading, the weekly Bloomberg consumer comfort index, is showing weakness through the last half of October, falling noticeably to 42.8 from a mid-month 45.2. The consumer sentiment index, released every other week, slowed to an 88 pace in the last half of the month vs a 92 pace in the first half. And it was a not-so-encouraging decline in the assessment of the current jobs market that pulled down the monthly consumer confidence index to 97.6 in October, well below Econoday's lowest forecast and 5.0 points below September. And buying plans for vehicles in the consumer confidence report are especially weak, perhaps hinting at shopping exhaustion after a year of heavy buying. Jobs are what make the consumer happy and these reports do not point to improved payroll growth nor to acceleration for household spending. The graph tracks the consumer sentiment index against the consumer confidence index. Note that both posted recovery peaks in January this year and haven't done any better since.
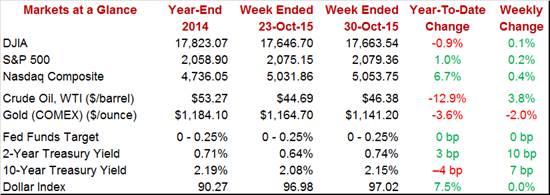
 Jobless claims are incredibly low and the unemployment rate has been coming down. But when will we hit the full employment threshold? The point when we risk entering the dark and hopeless land of wage inflation? Moderate job growth the next two months, all by itself and without inflation pressure, could be enough to trigger the liftoff. And that's what the 2-year Treasury yield could be warning, up a huge 10 basis points in the week to 0.74 percent. Stocks were little changed in a steady week with the Dow up 0.1 percent to 17,663. Turning to foreign exchange, dollar bulls are getting excited about the divergent paths that global central banks are taking, that is the Fed wanting to withdraw stimulus while China and the ECB and Bank of Japan want to add stimulus. The dollar didn't have much of a week though, showing no change on the dollar index which, however, is up 7.5 percent so far this year which is a plus for all Americans — except of course exporters. Jobless claims are incredibly low and the unemployment rate has been coming down. But when will we hit the full employment threshold? The point when we risk entering the dark and hopeless land of wage inflation? Moderate job growth the next two months, all by itself and without inflation pressure, could be enough to trigger the liftoff. And that's what the 2-year Treasury yield could be warning, up a huge 10 basis points in the week to 0.74 percent. Stocks were little changed in a steady week with the Dow up 0.1 percent to 17,663. Turning to foreign exchange, dollar bulls are getting excited about the divergent paths that global central banks are taking, that is the Fed wanting to withdraw stimulus while China and the ECB and Bank of Japan want to add stimulus. The dollar didn't have much of a week though, showing no change on the dollar index which, however, is up 7.5 percent so far this year which is a plus for all Americans — except of course exporters.
The consumer and housing are two sectors that are protected to a degree from global effects. One of these sectors, by far the most important, is doing fine though housing may be suddenly stalling. The economy is generally moving along and price readings, though generally flat or contracting, may be showing isolated and early pressure, at least perhaps for wage costs. There are two employment reports to go until the December meeting and the outlook for October nonfarm payrolls, at an Econoday consensus of 190,000, would be a roughly 50,000 increase from September and definitely enough to keep a December liftoff alive.
A dead even 50.0 reading is expected for Monday's ISM index which, unlike actual government data on the factory sector, has so far been holding above contraction. A sub-50 reading for the ISM could open the week on a rough note. The housing outlook has been upended following the latest new home sales and pending home sales reports which puts added focus on construction spending, also released on Monday. Motor vehicle sales will offer the first definitive data on consumer activity in October and expectations, at least compared to September, are negative. The week will then move toward Friday's employment where, unlike expectations for other data, solid growth is expected, at 190,000 for nonfarm payrolls.
The manufacturing PMI stands in direct contrast with the sweep of Federal Reserve regional surveys. At 54.0, the manufacturing PMI flash for October posted its best reading since May. New orders were at a 7-month high as was production. Regional Fed surveys have instead been showing wide contraction. Little change is expected for the final PMI, at 54.1.
Manufacturing PMI, Final - Consensus Forecast for October: 54.1
Range: 53.0 to 54.5
A sub-50 reading for the ISM manufacturing index could be a jolting wake-up call that the export-hit manufacturing sector is in contraction. The ISM is closely watched not only in the markets but within the factory sector itself where company forecasts are often based on the results. This report, unlike actual government data, hasn't yet pointed to outright contraction for the sector. The Econoday consensus is calling for a 50.0 reading in October, one that would point to no change in activity from September.
ISM Manufacturing Index - Consensus Forecast for October: 50.0
Range: 48.9 to 51.5
Construction spending, expected to rise 0.4 percent in September, may be ramping up but sales of new homes, at least, are moving lower. The residential component of this report has been a center of strength, up 1.3 percent in August for a year-on-year rate of plus 16 percent. But new homes of this component, unlike multi-family homes, have been lagging.
Construction Spending, M/M Chg - Consensus Forecast for September: +0.4%
Range: -0.1% to +1.0%
Factory orders have been on a long string of declines and another is expected for September, and at a steep minus 0.9 percent. The forecast is based on an already released 1.2 percent decline in orders for durable goods where core readings all showed weakness. Weakness in exports has been tilting the factory sector into contraction.
Factory Orders, M/M Chg. - Consensus Forecast for September: -0.9%
Range: -2.0% to 0.0%
Vehicle sales have proven to be one of the year's biggest positives for the economy, lifting retail sales and helping the factory sector offset a decline in exports. But sales are expected to slow in October, to a 17.7 million annualized rate from September's 10-year high of 18.2 million. A decrease for sales, despite the prior strength, would lower estimates for household spending and in turn lower the chances of a December FOMC rate hike.
Total Motor Vehicle Sales, Annualized Rate - Consensus Forecast for October: 17.7 mln
Range: 17.2 to 18.1 mln
Domestic-Made Motor Vehicle Sales, Ann. Rate - Consensus Forecast for Oct.: 14.1 mln
Range: 13.8 to 14.4 mln
ADP's employment report is expected to call for a 185,000 rise in private payrolls for October which would be far above the government's 118,000 total in September. But ADP, as it sometimes does, missed the mark last month calling, not for decreasing growth, but increasing growth to 190,000 which made for a big 72,000 miss. This report gets a lot of attention but is rarely market moving.
ADP, Private Payrolls - Consensus Forecast for October: +185,000
Range: +140,000 to +230,000
The nation's trade deficit is expected to narrow substantially in September, to $41.1 billion from August's unusually wide $48.3 billion. Preliminary data in September showed wide gains for exports, including for consumer goods, and wide declines for imports led by industrial supplies. Any surprise in this report, whether up or down, would jostle GDP revision estimates.
International Trade Balance - Consensus Forecast for September: -$41.1 billion
Range: -$47.2 to -$40.2 billion
The services PMI has been solid but slowing, coming in at 54.4 for the flash reading with a slight bounce higher expected for the final reading to 54.8. New business growth eased to the slowest rate of the year in the flash reading for October, raising questions over how long the service sector can resist global slowing.
Services PMI, Final - Consensus Forecast for October: 54.8
Range: 54.4. to 55.3
The ISM non-manufacturing index has been running at strong rates of growth, strength that's impressive but which stands in contrast to general slowing for the economy. The Econoday consensus for October is a very strong 56.7 which would be very little changed from September's 56.9. Backlog orders, in complete contrast to most reports, have been building in this report as have export orders which have been climbing for five straight months in a reminder that demand for the nation's technical and managerial services, unlike demand for its goods, has shown resistance to the negative effects of the strong dollar.
ISM Non-Manufacturing Index - Consensus Forecast for October: 56.7
Range: 55.0 to 57.5
Jobless claims are expected to hold near a long run of deep and impressive lows, at a consensus 262,000 in the October 24 week. Claims have been signaling very tight conditions in the labor market for the last six months and are now signaling even tighter conditions still.
Initial Jobless Claims - Consensus Forecast for October 24 Week: 262,000
Range: 256,000 to 270,000
Non-farm productivity is expected to show little change in the third quarter, at a consensus plus 0.1 percent. In contrast, unit labor costs are expected to show pressure, up 2.2 percent and reflecting the third-quarter's moderate growth rate. Soft growth, higher labor costs together with tight labor supply is an inflationary combination for policy makers.
Non-Farm Productivity, 1st Estimate - Consensus for Third Quarter: +0.1%
Range: -1.0% to +2.8%
Unit Labor Costs, 1st Estimate - Consensus for Third Quarter: +2.2%
Range: +0.5% to +3.5%
Nonfarm payrolls are expected to rise 190,000 in October which would be a nearly 50,000 increase from September and strong enough to keep expectations alive for a December rate hike. The unemployment rate is expected to slip 1 tenth to 5.0 percent, in what would be another positive for a rate hike. And average hourly earnings are expected to show some pressure, up 0.2 percent vs no change in September.
Nonfarm Payrolls - Consensus for October: +190,000
Range: +150,000 to +240,000
Private Payrolls - Consensus for October: +174,000
Range: +140,000 to +230,000
Unemployment Rate - Consensus for October: +5.0%
Range: +4.9% to +5.1%
Average Hourly Earnings - Consensus for October: +0.2%
Range: +0.1% to +0.4%
Average Workweek - Consensus for October: 34.5 hours
Range: 34.5 to 34.6 hours
Consumer credit is expected to rise a strong $18.0 billion in September. The revolving credit component of this report, which is where credit-card debt is tracked, has been showing life and hinting, perhaps, at consumer willingness to take on debt and to greater strength for holiday sales.
Consumer Credit - Consensus for September: +$18.0 billion
Range: +$15.0 to +$21.2 billion
|
