|
The employment report for October has all but sealed up a rate hike at the December FOMC, at least from this distance in early November. Janet Yellen put out the warning early in the week that a rate hike will definitely be a "live" topic at the December meeting, and that was before the jobs numbers. Strength in the economy is centered squarely on the domestic side, specifically the service sector and including construction. But for the struggling manufacturing sector, which is directly exposed to weakness in foreign demand, a rate hike may not be so welcomed.
 October's surge in nonfarm payrolls, at 271,000, is the strongest since December and helps make us forget about the disappointments in September and August and puts job growth, as seen in the graph, back in line with its positive mid-year trajectory. Payrolls in professional & business services surged 78,000 in the month for the largest increase since November with the subcomponent of temporary help services — considered a leading indicator for future hiring — up a very strong 25,000, also the strongest increase since November. Trade & transportation rose 51,000 while retail trade, which is gearing up for the holidays, rose 44,000. Construction spending is strong and payrolls show it, up 31,000 in the month. But the tide failed to lift the export-hit manufacturing sector where payrolls were unable to rise, unchanged in the month following two prior declines. October's surge in nonfarm payrolls, at 271,000, is the strongest since December and helps make us forget about the disappointments in September and August and puts job growth, as seen in the graph, back in line with its positive mid-year trajectory. Payrolls in professional & business services surged 78,000 in the month for the largest increase since November with the subcomponent of temporary help services — considered a leading indicator for future hiring — up a very strong 25,000, also the strongest increase since November. Trade & transportation rose 51,000 while retail trade, which is gearing up for the holidays, rose 44,000. Construction spending is strong and payrolls show it, up 31,000 in the month. But the tide failed to lift the export-hit manufacturing sector where payrolls were unable to rise, unchanged in the month following two prior declines.
 There is also lots of news on the unemployment side of the labor market. The unemployment rate fell 1 tenth and has hit the 5.0 percent threshold ahead of next year's schedule. For you historians, the unemployment rate hit a cycle high of 10 percent in October 2009 which is where the graph starts. The graph ends of course at October's 5.0 percent which is the lowest rate since April 2008. It was in February that year that the rate was last under 5 percent. The rate bottomed out in the mid 4 percent range in the last cycle and even dipped below 4 percent during the dotcom boom of the prior cycle. The available labor supply, the shaded area of the graph, has been falling as slack has been absorbed. How much more slack remains will be a central topic of the December meeting but, judging by record lows for both initial and continuing jobless claims, not much is the obvious answer. Also note that the broadly defined U-6 unemployment rate, a favorite of Janet Yellen's, is also down, 2 tenths lower to 9.8 percent for the lowest reading since May 2008. There is also lots of news on the unemployment side of the labor market. The unemployment rate fell 1 tenth and has hit the 5.0 percent threshold ahead of next year's schedule. For you historians, the unemployment rate hit a cycle high of 10 percent in October 2009 which is where the graph starts. The graph ends of course at October's 5.0 percent which is the lowest rate since April 2008. It was in February that year that the rate was last under 5 percent. The rate bottomed out in the mid 4 percent range in the last cycle and even dipped below 4 percent during the dotcom boom of the prior cycle. The available labor supply, the shaded area of the graph, has been falling as slack has been absorbed. How much more slack remains will be a central topic of the December meeting but, judging by record lows for both initial and continuing jobless claims, not much is the obvious answer. Also note that the broadly defined U-6 unemployment rate, a favorite of Janet Yellen's, is also down, 2 tenths lower to 9.8 percent for the lowest reading since May 2008.
 But a real punch in the report is from wages as average hourly earnings jumped a very strong 0.4 percent in the month with the year-on-year rate, as seen in the dark line of the graph, jumping to the 2.5 percent line for the highest reading since July 2009. But the gain here will have to be confirmed in future reports as other wage readings, including the wages & salaries component of the personal income report, have not been showing much strength. The light line in the graph is the Fed's central price target, the core PCE rate which has been struggling all year to make the 1.5 percent line. Yes, the jobs report is strong but there are still areas of the economy that aren't pointing to strength. But a real punch in the report is from wages as average hourly earnings jumped a very strong 0.4 percent in the month with the year-on-year rate, as seen in the dark line of the graph, jumping to the 2.5 percent line for the highest reading since July 2009. But the gain here will have to be confirmed in future reports as other wage readings, including the wages & salaries component of the personal income report, have not been showing much strength. The light line in the graph is the Fed's central price target, the core PCE rate which has been struggling all year to make the 1.5 percent line. Yes, the jobs report is strong but there are still areas of the economy that aren't pointing to strength.
 Make no mistake about it. The factory sector is in contraction — and has been for quite a long time. The dark line in the graph is the government's reading on factory orders which fell into year-on-year contraction in late 2014 and has been sinking deeper into contraction since, down more than 5 percent in the latest data. As orders go so do shipments, which is the light line in the graph and which isn't doing any better. Some data, like the manufacturing PMI from Markit Economics which publishes a huge body of global indexes based on their private samples, say the U.S. factory sector continues to expand and that production here remains "robust". Well, just look at the data from the U.S. government! What is a fact is that new orders for the factory sector, turning now to month-on-month terms in the government's data, fell 1.0 percent in September for the 11th decline in 14 months. Make no mistake about it. The factory sector is in contraction — and has been for quite a long time. The dark line in the graph is the government's reading on factory orders which fell into year-on-year contraction in late 2014 and has been sinking deeper into contraction since, down more than 5 percent in the latest data. As orders go so do shipments, which is the light line in the graph and which isn't doing any better. Some data, like the manufacturing PMI from Markit Economics which publishes a huge body of global indexes based on their private samples, say the U.S. factory sector continues to expand and that production here remains "robust". Well, just look at the data from the U.S. government! What is a fact is that new orders for the factory sector, turning now to month-on-month terms in the government's data, fell 1.0 percent in September for the 11th decline in 14 months.
 Data from the Institute For Supply Management have, like Markit's data, also missed the contraction, though in ISM's relative favor their data from their private sample base has been flat, at least not "robust". And the backlog orders index from ISM has been correctly signaling contraction, meaning that manufacturers, lacking new orders, have been working down their backlogs as they patiently wait for new orders to pick up. The columns in the graph track unfilled orders as measured by the government while the light line is the ISM index which has clearly broken down. Note that 50 on the right axis corresponds with zero on the left index, the former is the breakeven point for month-to-month change for ISM's measure while the latter is the month-to-month breakeven point for the government's numbers. Data from the Institute For Supply Management have, like Markit's data, also missed the contraction, though in ISM's relative favor their data from their private sample base has been flat, at least not "robust". And the backlog orders index from ISM has been correctly signaling contraction, meaning that manufacturers, lacking new orders, have been working down their backlogs as they patiently wait for new orders to pick up. The columns in the graph track unfilled orders as measured by the government while the light line is the ISM index which has clearly broken down. Note that 50 on the right axis corresponds with zero on the left index, the former is the breakeven point for month-to-month change for ISM's measure while the latter is the month-to-month breakeven point for the government's numbers.
 And we know where the blame lies and that's in exports, the result of weakness in foreign demand compounded, for domestic manufacturers, by strength in the dollar. The dark line in the graph tracks exports of goods as measured by the government which broke down from a peak of $138.4 billion in the month of July last year to $127.3 billion for September. The word for this is contraction. Here the comparative ISM index is doing very well, at least "well" in the sense of a leading indicator, signaling in advance the decline of the whole curve. Lack of exports has been the difference this year for the factory sector and new export orders in the ISM report, at 47.5, came in below breakeven 50 for the fifth straight month. And there's more trouble for the factory sector and that is inventory which ISM respondents say is too high. The factory sector is struggling and is chief on the list of 2015 disappointments. And we know where the blame lies and that's in exports, the result of weakness in foreign demand compounded, for domestic manufacturers, by strength in the dollar. The dark line in the graph tracks exports of goods as measured by the government which broke down from a peak of $138.4 billion in the month of July last year to $127.3 billion for September. The word for this is contraction. Here the comparative ISM index is doing very well, at least "well" in the sense of a leading indicator, signaling in advance the decline of the whole curve. Lack of exports has been the difference this year for the factory sector and new export orders in the ISM report, at 47.5, came in below breakeven 50 for the fifth straight month. And there's more trouble for the factory sector and that is inventory which ISM respondents say is too high. The factory sector is struggling and is chief on the list of 2015 disappointments.
 The factory sector is often considered a bellwether for the economy but the economy itself, as seen in the October jobs report, is doing just fine. Payroll growth in construction is strong and looking at construction spending, as seen in the graph, the news is also very good. Total spending, at an annualized $1.1 trillion, is up 14 percent year-on-year with residential spending up 17 percent. New multi-family units continue to lead the residential component, up 27 percent year-on-year and reflecting price strength for rents. But nonresidential construction has also been strong this year, up 15 percent and belying complaints that capital investment is weak. Yet all is not strong. Permits, which spiked in the spring, have not been showing great strength in recent months, in turn pointing to moderation for what still looks to be, however, a solid construction sector. The factory sector is often considered a bellwether for the economy but the economy itself, as seen in the October jobs report, is doing just fine. Payroll growth in construction is strong and looking at construction spending, as seen in the graph, the news is also very good. Total spending, at an annualized $1.1 trillion, is up 14 percent year-on-year with residential spending up 17 percent. New multi-family units continue to lead the residential component, up 27 percent year-on-year and reflecting price strength for rents. But nonresidential construction has also been strong this year, up 15 percent and belying complaints that capital investment is weak. Yet all is not strong. Permits, which spiked in the spring, have not been showing great strength in recent months, in turn pointing to moderation for what still looks to be, however, a solid construction sector.
 An even more clear source of domestic strength is rising demand for vehicles which, as seen in the line of the graph, is at an 18.2 million annualized rate for a 12-year high. These data offer convincing evidence of domestic-based consumer strength though, because October isn't that much higher than September, they don't quite point to a third straight gain for the motor vehicle component of the October retail sales report, a report that will top the coming week's economic calendar. Another signal of consumer strength came in late in the week with a 7th straight gain, and a very strong one, for the revolving component of the consumer credit report. This suggests that consumers are now less reluctant to run up their credit cards which, for retailers certainly, is a good omen for the holidays. But how long will the domestic economy withstand and offset the weakness in foreign demand? Ask the FOMC which, in a sign of confidence, cut back references to global troubles in their October statement. And some are now pointing to what may be a snapback in China's economy, if not also for Europe's economy as well. An even more clear source of domestic strength is rising demand for vehicles which, as seen in the line of the graph, is at an 18.2 million annualized rate for a 12-year high. These data offer convincing evidence of domestic-based consumer strength though, because October isn't that much higher than September, they don't quite point to a third straight gain for the motor vehicle component of the October retail sales report, a report that will top the coming week's economic calendar. Another signal of consumer strength came in late in the week with a 7th straight gain, and a very strong one, for the revolving component of the consumer credit report. This suggests that consumers are now less reluctant to run up their credit cards which, for retailers certainly, is a good omen for the holidays. But how long will the domestic economy withstand and offset the weakness in foreign demand? Ask the FOMC which, in a sign of confidence, cut back references to global troubles in their October statement. And some are now pointing to what may be a snapback in China's economy, if not also for Europe's economy as well.
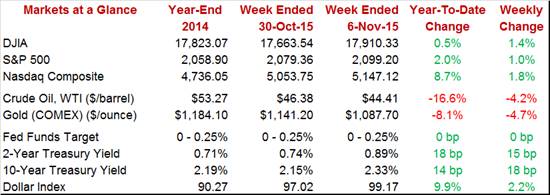
 For those who have remained bullish on Treasuries, last week, which was topped off by the October employment report, was not good news. The 2-year yield spiked a giant 15 basis points in the week to 0.89 percent while the 10-year yield surged 18 basis points to 2.33 percent. If a December rate hike is now more or less priced in, then these yields may not move much more assuming, of course, that coming economic data, especially the November employment report, keep pointing to strength. Volatility is also hitting foreign exchange as the dollar index surged 2.2 percent in the week to 99.17. The stock market, however, appears to be calm, perhaps reflecting a balance between positive confidence in the economy and the perhaps not-so-positive prospect of higher interest rates. Friday's reaction in the stock market was mixed but it was a still good week with the major indexes showing 1 to 2 percent gains including a 1.4 percent rise for the Dow which ended the week within shot of 18,000, at 17,910. Higher rates are a negative for gold which, of course, doesn't pay a yield. Gold fell 4.7 percent in the week to $1,087 while oil fell 4.2 percent to $44.41. For those who have remained bullish on Treasuries, last week, which was topped off by the October employment report, was not good news. The 2-year yield spiked a giant 15 basis points in the week to 0.89 percent while the 10-year yield surged 18 basis points to 2.33 percent. If a December rate hike is now more or less priced in, then these yields may not move much more assuming, of course, that coming economic data, especially the November employment report, keep pointing to strength. Volatility is also hitting foreign exchange as the dollar index surged 2.2 percent in the week to 99.17. The stock market, however, appears to be calm, perhaps reflecting a balance between positive confidence in the economy and the perhaps not-so-positive prospect of higher interest rates. Friday's reaction in the stock market was mixed but it was a still good week with the major indexes showing 1 to 2 percent gains including a 1.4 percent rise for the Dow which ended the week within shot of 18,000, at 17,910. Higher rates are a negative for gold which, of course, doesn't pay a yield. Gold fell 4.7 percent in the week to $1,087 while oil fell 4.2 percent to $44.41.
There may be a sense of relief among FOMC policy makers following the October report, that they can now fulfill their own expectations and announce liftoff before year-end. But there's still the November employment report to go before the December FOMC, not to mention the risks, however moderating, of new troubles in the global markets. The road to normalization, if and when it does in fact begin, is promised to be a long slow road.
The employment report may have come and gone but the coming week will be packed with new data. Prices are a feature of the week starting Tuesday with the import & export price report followed on Friday with producer prices. The former has been in deep contraction while the latter, hit by a reversal in service prices, moved lower in the last report. There will also be important jobs data in the week including initial jobless claims, which inexplicably jumped higher in the prior report, and JOLTS where job openings inexplicably fell back. But the week's one report that, by itself, is capable of upsetting FOMC expectations is Friday's retail sales where, however, moderate strength is expected.
The labor market conditions index is expected to rise from zero to 0.6 in October, reflecting the strength of last week's employment report. Before last week's report, this index had been very soft and not showing much reaction to low levels of unemployment.
Labor Market Conditions Index - Consensus Forecast for October: +0.6
Range: 0.0 to +1.1
The small business optimism index has been very solid, especially employment where hiring plans have been at their best levels of the year. And in a hint of wage pressures to come, small businesses have been reporting the most difficulty of the recovery in finding qualified employees. Capital outlays in this report have also been positive.
Small Business Optimism Index - Consensus Forecast for October: 96.4
Range: 96.0 to 97.2
Import & export prices have been in deep contraction and further contraction is expected. The Econoday consensus is calling for a 0.1 percent decline for import prices and a 0.3 percent decline for export prices. And it isn't all about oil, as non-petroleum import prices have also been in clear contraction. Year-on-year rates in this report have been deeply negative, just over double digits for import prices and just under double digits for export prices. Contraction in import prices reflects the strength of the dollar which has been giving U.S. buyers more for their dollars, while contraction in export prices reflects deflationary trends in the global price environment.
Import Prices, M/M Chg - Consensus Forecast for October: -0.1%
Range: -0.4% to +0.2%
Export Prices, M/M Chg - Consensus Forecast for October: -0.3%
Range: -0.5% to +0.1%
Wholesale inventories have been heavy with the stock-to-sales ratio for the sector on the rise. But businesses, including wholesalers, have been working hard to keep their inventories in check as sales have been soft. The Econoday forecast for wholesale inventories is calling for a small 0.1 percent rise.
Wholesale Inventories, M/M Chg. - Consensus Forecast for September: +0.1%
Range: 0.0% to +0.3%
Though popping higher in the October 31 week, initial jobless claims have been trending at 42-year lows and, as a share of the whole labor market, are likely at record lows. Econoday forecasters see initial claims dipping back 10,000 in the November 7 week to 266,000. Continuing claims, where data only goes back only 14 years, have also been at record lows.
Initial Jobless Claims - Consensus Forecast for November 7 Week: 266,000
Range: 260,000 to 280,000
Producer prices - final demand are expected to bounce higher in October, up 0.2 percent for the headline and up a consensus 0.1 percent for the core. The gains would follow wide weakness in September as the services component, which makes up about 60 percent of the report, reversed two prior months of strong gains with a sizable 0.4 percent decline. Year-on-year rates have been falling deeper into negative territory, to minus 1.1 percent for the headline reading in September.
PPI-FD - Consensus for October: +0.2%
Range: -0.1% to +0.3%
PPI-FD Less Food & Energy - Consensus for October: +0.1%
Range: 0.0% to +0.3%
Retail sales are expected to accelerate in October, to a 0.3 percent gain from September's disappointing 0.1 percent gain. Unit auto sales were surprisingly strong and resilient in October, edging up fractionally to a 12-year high but not quite showing enough strength from September to guarantee monthly growth. Gas prices firmed in October which should help gas stations where sales have been very weak and have been skewing total sales lower. Excluding autos and gas, core retail sales, which are on a 5-month winning streak, are expected to rise a respectable 0.3 percent. But a risk to the expected gain is October's weather which was unusually warm and may have hurt sales of seasonal goods.
Retail Sales - Consensus for October: +0.3%
Range: +0.1% to +0.5%
Retail Sales Ex-Autos - Consensus for October: +0.4%
Range: -0.2% to +0.6%
Retail Sales Ex-Autos Ex-Gas - Consensus for October: +0.3%
Range: +0.1% to +0.7%
Business inventories are expected to come in unchanged in September after showing no change in August. But relative to sales, which fell 0.6 percent, inventories in August turned higher with the inventory-to-sales ratio at 1.37 from 1.36 in July and compared with 1.30 in August last year. Inventories, though showing little absolute change, are nevertheless heavy and risk slowing production and employment growth.
Business Inventories - Consensus for September: 0.0%
Range: 0.0% to +0.3%
Consumer sentiment has been solid this year but has been trending lower from a January peak near 100. But the Econoday consensus for the preliminary November reading is 92.0 for what would be a solid 2.0 point gain from October. Gains in this report would underscore the strength of the jobs market.
Consumer Sentiment, Preliminary - Consensus for November: 92.0
Range: 89.0 to 94.0
|
