|
The Federal Reserve has set about a long gradual path of rate hikes, withdrawing stimulus to understandably avoid overheating the economy and having to raise rates abruptly and thereby risk recession. The move comes in response to strength in the labor market and the diminishing availability of labor, a scarcity that risks a run of wage inflation. But there's one area of inflation where the Fed is less in control. Oil has upset everybody's plans before, like during the Carter administration when it started out at $15 per barrel in 1978 before moving to nearly $40 by 1980 on deliberate Middle East supply constraints. Now on deliberate Middle East over supply, oil this time around is going the other way, moving from over $100 to well under $40 in less than a year's time. The ongoing contraction, let alone any future contraction, would not be constructive for the Fed's 2 percent inflation target.
 Turning to the mid-80s, the price of oil suffered a similar contraction as it is now, moving from the low $30s in late 1985 to not quite $10 by July the next year. And it wasn't until late 1990, a very long four years if you were in the oil business, that oil finally moved back over $30. In recent weeks, the price of oil has fallen sharply to lows under $35, a price last seen back in early 2004. The drop is the result of an extending supply glut as seen in the dark line of the graph. Commercial oil inventories in the latest reporting week, which was December 11, jumped nearly 5 million barrels to hit a post-war high at just over 490 million barrels. As the graph shows, higher inventories make for lower prices. Turning to the mid-80s, the price of oil suffered a similar contraction as it is now, moving from the low $30s in late 1985 to not quite $10 by July the next year. And it wasn't until late 1990, a very long four years if you were in the oil business, that oil finally moved back over $30. In recent weeks, the price of oil has fallen sharply to lows under $35, a price last seen back in early 2004. The drop is the result of an extending supply glut as seen in the dark line of the graph. Commercial oil inventories in the latest reporting week, which was December 11, jumped nearly 5 million barrels to hit a post-war high at just over 490 million barrels. As the graph shows, higher inventories make for lower prices.
 Demand for fuel hasn't been going up much during this recovery, at only a year-on-year plus 0.7 percent for gasoline in the latest data with distillates, due to the warm weather, in deep contraction at minus 8.2 percent. But supply, in response to lower demand, hasn't been showing much elasticity, that is holding steady or going down. Saudi Arabian efforts to over supply the market and run U.S. producers out business has yet to completely take hold. The dark line in the graph is U.S. output of crude oil which, though coming down from the 9.5 million barrel per day range at mid-year, is still holding firmly above 9.0 million. The light line is imported oil which, despite soft demand, has held more or less steady all year and is now spiking above 8.0 million barrels per day going into year end. Flat demand and heavy supply is not the recipe for stable prices, stability which Federal Reserve policy makers are counting on. How low will the price go? Janet Yellen at the FOMC press conference mentioned, without going into detail, the possibility that there may be a natural floor to the price of oil. For the Fed's inflation target to work, they should hope so. Demand for fuel hasn't been going up much during this recovery, at only a year-on-year plus 0.7 percent for gasoline in the latest data with distillates, due to the warm weather, in deep contraction at minus 8.2 percent. But supply, in response to lower demand, hasn't been showing much elasticity, that is holding steady or going down. Saudi Arabian efforts to over supply the market and run U.S. producers out business has yet to completely take hold. The dark line in the graph is U.S. output of crude oil which, though coming down from the 9.5 million barrel per day range at mid-year, is still holding firmly above 9.0 million. The light line is imported oil which, despite soft demand, has held more or less steady all year and is now spiking above 8.0 million barrels per day going into year end. Flat demand and heavy supply is not the recipe for stable prices, stability which Federal Reserve policy makers are counting on. How low will the price go? Janet Yellen at the FOMC press conference mentioned, without going into detail, the possibility that there may be a natural floor to the price of oil. For the Fed's inflation target to work, they should hope so.
 The Federal Reserve's big policy announcement overshadowed the week's economic data that, besides the record for oil inventories, also included the consumer price report where the core rate, due to strength in service prices including for medical care, finally hit the Fed's 2 percent target. But the core rate excludes both food and of course oil, two very important things in life that should not always be excluded. When including both, as seen in the light line of the graph, the CPI is nowhere near the Fed's 2 percent target. The dark line is energy prices where contraction may be easing but not by much, still at minus 15 percent. These were data for November. Data for December, given the ongoing decline in oil, are not likely to look much different. The Federal Reserve's big policy announcement overshadowed the week's economic data that, besides the record for oil inventories, also included the consumer price report where the core rate, due to strength in service prices including for medical care, finally hit the Fed's 2 percent target. But the core rate excludes both food and of course oil, two very important things in life that should not always be excluded. When including both, as seen in the light line of the graph, the CPI is nowhere near the Fed's 2 percent target. The dark line is energy prices where contraction may be easing but not by much, still at minus 15 percent. These were data for November. Data for December, given the ongoing decline in oil, are not likely to look much different.
 Turning back to the core, prices have been increasing — at least they have for the CPI. But this is much less true for the Fed's central price measure which is the PCE core as seen in the dark line of the graph. This measure has not been moving higher, stuck at 1.3 percent for nearly the whole year with forecasters seeing little change for the coming November report. The PCE is the Fed's favored price measure as it tracks, not a fixed group of prices as the CPI, but a flexible group that allows for consumers to substitute lower priced goods and services when preferred goods and services rise in price. Even though the core rate excludes the direct effects of energy prices, the secondary effects, that are passed through on cost savings for raw materials and transportation, are not excluded. The Fed, however, is counting on year-on-year base effects to ease the downward pull from low oil prices. But oil this time last year was at about $60 which isn't that far from double the current price. Oil held in the $50s through the first-quarter of 2015 before moving back up to $60 again in the second quarter. These are comparisons that, for policy makers, may have seemed easy at the time but now don't look so easy at all and do not point to much price relief, at least for the first half of 2016. Still falling fuel prices are definitely a live risk to the Fed's inflation hopes. Turning back to the core, prices have been increasing — at least they have for the CPI. But this is much less true for the Fed's central price measure which is the PCE core as seen in the dark line of the graph. This measure has not been moving higher, stuck at 1.3 percent for nearly the whole year with forecasters seeing little change for the coming November report. The PCE is the Fed's favored price measure as it tracks, not a fixed group of prices as the CPI, but a flexible group that allows for consumers to substitute lower priced goods and services when preferred goods and services rise in price. Even though the core rate excludes the direct effects of energy prices, the secondary effects, that are passed through on cost savings for raw materials and transportation, are not excluded. The Fed, however, is counting on year-on-year base effects to ease the downward pull from low oil prices. But oil this time last year was at about $60 which isn't that far from double the current price. Oil held in the $50s through the first-quarter of 2015 before moving back up to $60 again in the second quarter. These are comparisons that, for policy makers, may have seemed easy at the time but now don't look so easy at all and do not point to much price relief, at least for the first half of 2016. Still falling fuel prices are definitely a live risk to the Fed's inflation hopes.
 Another risk to the Fed's price outlook is industrial demand for energy. The nation's domestic economy is very sound and, as Janet Yellen stressed at her press conference, is the center of the nation's strength. But the factory sector, through exports, is directly exposed to the global economy which, right now, is not a positive. Another important release during the week was the Federal Reserve's industrial production report where the manufacturing component fizzled out once again, coming in unchanged for a year-on-year gain of only 0.9 percent. The dark line of the graph tracks the index level of this component which sloped nicely higher in 2014 before flattening out this year. The flattening corresponds with contraction in exports, the light line of the graph which began moving lower late last year. A flat factory sector isn't well positioned to absorb ever rising supplies of fuel, which is a price risk from the demand side. Another risk to the Fed's price outlook is industrial demand for energy. The nation's domestic economy is very sound and, as Janet Yellen stressed at her press conference, is the center of the nation's strength. But the factory sector, through exports, is directly exposed to the global economy which, right now, is not a positive. Another important release during the week was the Federal Reserve's industrial production report where the manufacturing component fizzled out once again, coming in unchanged for a year-on-year gain of only 0.9 percent. The dark line of the graph tracks the index level of this component which sloped nicely higher in 2014 before flattening out this year. The flattening corresponds with contraction in exports, the light line of the graph which began moving lower late last year. A flat factory sector isn't well positioned to absorb ever rising supplies of fuel, which is a price risk from the demand side.
 Other data in the week included two very closely watched regional reports from Federal Reserve district banks. The Empire State report, posted by the New York Fed, is the first out of the block each month and the results, the light columns in the graph, are definitely not that great. This index has been in contraction for five straight months and six out of the last seven. The Philly Fed is the grand daddy of the various regional reports and the results for December were also not especially good. The index fell back into contraction, as seen in the dark columns, after popping up briefly in November. Manufacturers in the Philly region worked down their backlogs to keep up shipments, but without new orders coming in, shipments and employment are bound to fall. And there were two especially unwanted developments in the report as the 6-month outlook, weighed down no doubt by the outlook for exports, is now showing significantly less optimism then before while prices, including prices for finished goods, are turning deeper into contraction (policy makers take note!). Other data in the week included two very closely watched regional reports from Federal Reserve district banks. The Empire State report, posted by the New York Fed, is the first out of the block each month and the results, the light columns in the graph, are definitely not that great. This index has been in contraction for five straight months and six out of the last seven. The Philly Fed is the grand daddy of the various regional reports and the results for December were also not especially good. The index fell back into contraction, as seen in the dark columns, after popping up briefly in November. Manufacturers in the Philly region worked down their backlogs to keep up shipments, but without new orders coming in, shipments and employment are bound to fall. And there were two especially unwanted developments in the report as the 6-month outlook, weighed down no doubt by the outlook for exports, is now showing significantly less optimism then before while prices, including prices for finished goods, are turning deeper into contraction (policy makers take note!).
 Another manufacturing report posted in the week was from the hard-hit Kansas City Fed. Like the Philly Fed, this index popped higher in November in what also proved to be a one-month wonder. The December index came in at minus 8 for the eighth contraction in nine months. Here, not only orders and production are in contraction but also employment, and deeply in contraction at minus 17. Price data are also in contraction. Dallas, the dark column in the graph, is another report showing severe energy effects. Dallas will post its December results later in the month but given the ongoing weakness in oil, the first positive reading this year doesn't seem that likely. Kansas City and Dallas are getting hit by a double effect, not only from energy but also from weak foreign demand. Janet Yellen expressed cautious optimism at her conference that the worst for the global economy may be over. But the strength of the dollar, outside of weak demand, has been a separate factor hitting exports. Withdrawal of stimulus in the U.S., however gradual, combined with rising stimulus abroad does not point to a lower dollar, a divergence that the nation's exporters are no doubt taking note of. Another manufacturing report posted in the week was from the hard-hit Kansas City Fed. Like the Philly Fed, this index popped higher in November in what also proved to be a one-month wonder. The December index came in at minus 8 for the eighth contraction in nine months. Here, not only orders and production are in contraction but also employment, and deeply in contraction at minus 17. Price data are also in contraction. Dallas, the dark column in the graph, is another report showing severe energy effects. Dallas will post its December results later in the month but given the ongoing weakness in oil, the first positive reading this year doesn't seem that likely. Kansas City and Dallas are getting hit by a double effect, not only from energy but also from weak foreign demand. Janet Yellen expressed cautious optimism at her conference that the worst for the global economy may be over. But the strength of the dollar, outside of weak demand, has been a separate factor hitting exports. Withdrawal of stimulus in the U.S., however gradual, combined with rising stimulus abroad does not point to a lower dollar, a divergence that the nation's exporters are no doubt taking note of.
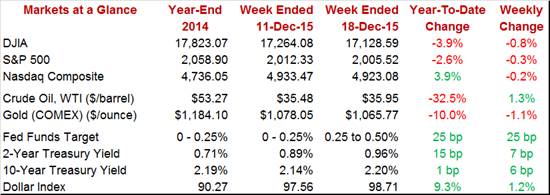
 The Fed decision was well signaled and done decisively in a 10-0 vote that included the assents of two well known doves, Governor Lael Brainard and also the outspoken Charles Evans from the Chicago Fed. Bond holders were jittery early in the week, making for an odd selloff on Monday. But rates then held stable, showing an unsurprising rise in the 2-year yield, up 12 basis points to 1.01 percent, and only modest movement for the 10-year, up a scant 5 basis points to 2.19 percent. The stock market rallied into the liftoff then, on the buy the rumor sell the fact principle, fell back after the liftoff. On the week, the major indexes posted modest losses. And where did oil end? Under $36 for a not-so-awesome weekly rebound of less than 50 cents. Whether investment funds move into oil is uncertain, but there's a general assumption in the markets that sidelined money, that is cash held back pending the uncertainty of liftoff, will now be begin to flow into markets. The Fed decision was well signaled and done decisively in a 10-0 vote that included the assents of two well known doves, Governor Lael Brainard and also the outspoken Charles Evans from the Chicago Fed. Bond holders were jittery early in the week, making for an odd selloff on Monday. But rates then held stable, showing an unsurprising rise in the 2-year yield, up 12 basis points to 1.01 percent, and only modest movement for the 10-year, up a scant 5 basis points to 2.19 percent. The stock market rallied into the liftoff then, on the buy the rumor sell the fact principle, fell back after the liftoff. On the week, the major indexes posted modest losses. And where did oil end? Under $36 for a not-so-awesome weekly rebound of less than 50 cents. Whether investment funds move into oil is uncertain, but there's a general assumption in the markets that sidelined money, that is cash held back pending the uncertainty of liftoff, will now be begin to flow into markets.
The Fed is expected to do three or four more rate hikes in 2016 followed perhaps by as many in the following year. But lack of progress on inflation and continuing weakness for exports are risks to this outlook. The Fed, however, is confident in the strength of the economy which, if this strength builds, could boost U.S. demand for foreign goods and, in theory, give a lift to the global economy -- a lift that would help boost global prices.
Housing will be front and center heading into Friday's Christmas. Tuesday will see the release of existing home sales where growth, held down by lack of homes on the market, has been soft. Data on home prices have been mixed but the FHFA report, also released on Tuesday, has been showing life with a year-on-year rate over 6 percent. New home sales, where sales have been very choppy and modest overall, will be posted on Wednesday with the Econoday consensus calling for a respectable 1.6 percent rise. Personal income and outlays will also be posted Wednesday in a report that is expected to show only modest gains and only a 0.1 percent rise for the core PCE price index which is the Fed's most important inflation reading. Durable goods orders, held down by weak foreign demand and weakness in energy equipment, are not expected to show strength in data also released on Wednesday. Jobless claims, where data can be very choppy during the holidays, will round out the shortened week out on Thursday.
November was a solid month for employment and housing but factory data proved weak and consumer spending uneven. Still, forecasters see the national activity index coming in the plus column, at 0.15 to signal an above average monthly performance.
National Activity Index - Consensus Forecast for November: 0.15
Range: -0.20 to 0.25
The Econoday consensus is calling for a 1 tenth dip in the third estimate for third-quarter GDP to plus 2.0 percent. Apart from inventories where change is sometimes hard to interpret, demand indications in the second estimate were very solid with final sales up 2.7 percent.
Real GDP, 3rd Quarter, 3rd Estimate, Annualized Rate - Consensus Forecast: +2.0%
Range: +1.7% to +2.2%
GDP Price Index, 3rd Quarter, 3rd Estimate - Consensus Forecast: +1.3%
Range: +1.3% to +1.3%
Home-price appreciation, as measured by the FHFA house price index, is expected to ease in October, to a consensus plus 0.4 percent vs an outsized plus 0.8 percent in September. Home price appreciation has been soft but is still a positive factor for household wealth.
FHFA House Price Index - Consensus Forecast for October: +0.4%
Range: +0.3% to +0.8%
Existing home sales dipped back in October with the year-on-year gain at only 3.9 percent. Weakness was split roughly evenly between single-family homes, down 3.7 percent in the month to a 4.75 million rate, and condos, down 1.6 percent to a 610,000 rate. Lack of supply on the market, at only 4.8 months, has been holding down sales but hasn't yet been giving prices a major boost, up only 5.8 percent year-on-year. For November, the Econoday consensus is calling for a 5.32 million annualized rate, down what would be 0.8 percent in the month. The consensus estimate, based on weakness in pending home sales data, does not point to a rising sales trend nor to greater home-price appreciation.
Existing Home Sales, Annualized Rate - Consensus Forecast for November: 5.32 million
Range: 5.10 to 5.50 million
The factory sector bounced back strongly in October with durable goods orders jumping 3.0 percent and up a solid 0.5 percent excluding transportation. Capital goods highlighted the report with core orders up 1.3 percent and a decline in the prior month revised away to a 0.4 percent gain. But forecasters don't see another month of strength for November with the Econoday consensus calling for a 0.5 percent decline in headline orders with ex-transportation orders no better than unchanged.
Durable Goods Orders, M/M Chg - Consensus Forecast for November: -0.5%
Range: -1.7% to +1.1%
Durable Goods Orders, Ex-Transportation, M/M Chg - Consensus for November: 0.0%
Range: -0.3% to +0.8%
The core PCE price index is the Fed's favorite inflation reading and Econoday expectations are not looking for much increase, calling for a 0.1 percent gain in November. Readings on personal income and personal spending are expected to rise but only modestly, at plus 0.2 percent for income, reflecting soft wage and workweek data in the November employment report, and at plus 0.3 percent for spending reflecting what is expected to be incremental gains for service spending and in line with a moderate gain for core retail sales in November.
Personal Income, M/M Chg - Consensus for November: +0.2%
Range: +0.1% to +0.4%
Personal Spending, M/M Chg - Consensus for November: +0.3%
Range: +0.2% to +0.4%
PCE Price Index, M/M Chg - Consensus for November: 0.0%
Range: 0.0% to +0.1%
Core PCE Price Index M/M Chg - Consensus for November: 0.1%
Range: +0.1% to +0.2%
Samples are small and monthly data often swing wildly as new home sales soared 10.7 percent in October to nearly reverse a giant 12.9 percent plunge in September. At a consensus 503,000 annualized rate, Econoday forecasters see a comparatively tame 1.6 percent gain for sales in November. Supply of new homes has been tight but hasn't been helping prices which, in this report, were down a year-on-year 6.0 percent in October. Permits for single-family homes have been on the climb which does point to less tightness in supply ahead.
New Home Sales, Annualized Rate - Consensus Forecast for November: 503,000
Range: 479,000 to 531,000
Consumer sentiment bounced back in the December flash report, to 91.8 for a 5 tenths gain over the final November reading. Another 2 tenths gain to 92.0 is expected for the final December reading. Strength has been in the current conditions component which is good news for the holiday shopping outlook, offsetting weakness in the expectations component where optimism on the jobs outlook, despite ongoing strength in the labor market, has been softening. Inflation expectations have been very subdued.
Consumer Sentiment, Preliminary - Consensus for December, Final: 92.0
Range: 90.5 to 93.4
Initial jobless claims moved lower in the December 12 week, to 271,000 and down 11,000 from the prior week's 282,000 which was the highest since July. Forecasters see initial claims holding steady in the December 19 week, at a consensus 270,000. Note that readings in this report are often volatile during the holiday weeks.
Initial Jobless Claims - Consensus Forecast for December 19 week: 270,000
Range: 267,000 to 275,000
|
