|
International Perspective will be taking off for the holidays.
IP will return on Friday, January 8, 2016.
Happy holidays from all of us at Econoday!
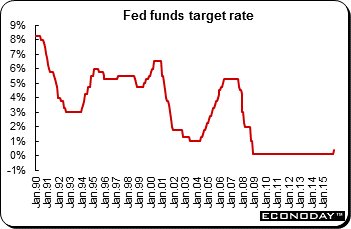 The event global markets had been waiting for finally occurred. The Federal Reserve increased its fed funds interest rate range to 0.25 percent to 0.50 percent from zero to 0.25 percent. The discount rate was also raised by 25 basis points to 1.00 percent. The Fed also said that both the pace and magnitude of future rate increases will be data dependent — no change there. 'Gradual' became the new key word. The FOMC said that further increases would be gradual. The responses of the stock and bond markets to the Fed rate liftoff were entirely typical for the start of a rising interest rate cycle. The event global markets had been waiting for finally occurred. The Federal Reserve increased its fed funds interest rate range to 0.25 percent to 0.50 percent from zero to 0.25 percent. The discount rate was also raised by 25 basis points to 1.00 percent. The Fed also said that both the pace and magnitude of future rate increases will be data dependent — no change there. 'Gradual' became the new key word. The FOMC said that further increases would be gradual. The responses of the stock and bond markets to the Fed rate liftoff were entirely typical for the start of a rising interest rate cycle.
Equities rallied on the news as the Fed reinforced the view that the U.S. economy was growing. The U.S. dollar however was mixed and bond yields were up. The rate increase 'celebration' lasted one day, then investors were back to worrying about global growth and ever sinking commodity prices. Equities retreated giving back all or most of their Fed inspired gains.
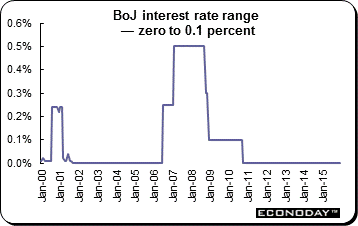 As anticipated, the Bank of Japan decided to leave its monetary policy unchanged. The BoJ left its key interest rate range at zero to 0.10 percent. It also said it would continue to buy JGBs at an annual pace of ¥80 trillion. The vote to maintain its policy was 8 to 1. Once again, Takahide Kiuchi voted against the decision arguing that a reduced pace of purchases (¥45 trillion) was appropriate. As anticipated, the Bank of Japan decided to leave its monetary policy unchanged. The BoJ left its key interest rate range at zero to 0.10 percent. It also said it would continue to buy JGBs at an annual pace of ¥80 trillion. The vote to maintain its policy was 8 to 1. Once again, Takahide Kiuchi voted against the decision arguing that a reduced pace of purchases (¥45 trillion) was appropriate.
The BoJ however, decided to extend JGB duration to 7 to 12 years next year from 7 to 10 years currently. The Bank also said it will buy exchange traded funds (ETFs) and Japan real estate investment trusts (J-REITs) so that their amounts outstanding will increase at annual paces of about ¥3 trillion and about ¥90 trillion respectively. The vote on these changes was 6 to 3.
BoJ said once again that the economy "has continued to recover moderately, although exports and production have been affected by the slowdown in emerging economies." The MPB said that the core CPI was likely to continue to be about zero for now due to the decline in energy prices. The BoJ said that output remains flat but CAPEX is on a moderate rising trend. It noted that private consumption has been resilient.
In 2016 the BoJ will meet only eight times a year, down from 14 currently.
| |
|
2014 |
2015 |
% Change |
|
Index |
Dec 31 |
Dec 11 |
Dec 18 |
Week |
2015 |
| Asia/Pacific |
|
|
|
|
|
|
| Australia |
All Ordinaries |
5388.6 |
5078.6 |
5156.50 |
1.5% |
-4.3% |
| Japan |
Nikkei 225 |
17450.8 |
19230.5 |
18986.80 |
-1.3% |
8.8% |
| Hong Kong |
Hang Seng |
23605.0 |
21464.1 |
21755.56 |
1.4% |
-7.8% |
| S. Korea |
Kospi |
1915.6 |
1948.6 |
1975.32 |
1.4% |
3.1% |
| Singapore |
STI |
3365.2 |
2834.6 |
2852.84 |
0.6% |
-15.2% |
| China |
Shanghai Composite |
3234.7 |
3434.6 |
3578.96 |
4.2% |
10.6% |
|
|
|
|
|
|
|
| India |
Sensex 30 |
27499.4 |
25044.4 |
25519.22 |
1.9% |
-7.2% |
| Indonesia |
Jakarta Composite |
5227.0 |
4393.5 |
4468.65 |
1.7% |
-14.5% |
| Malaysia |
KLCI |
1761.3 |
1640.1 |
1643.90 |
0.2% |
-6.7% |
| Philippines |
PSEi |
7230.6 |
6735.0 |
6867.07 |
2.0% |
-5.0% |
| Taiwan |
Taiex |
9307.3 |
8115.9 |
8257.32 |
1.7% |
-11.3% |
| Thailand |
SET |
1497.7 |
1280.9 |
1284.92 |
0.3% |
-14.2% |
|
|
|
|
|
|
|
| Europe |
|
|
|
|
|
|
| UK |
FTSE 100 |
6566.1 |
5952.8 |
6052.42 |
1.7% |
-7.8% |
| France |
CAC |
4272.8 |
4549.6 |
4625.26 |
1.7% |
8.3% |
| Germany |
XETRA DAX |
9805.6 |
10340.1 |
10608.19 |
2.6% |
8.2% |
| Italy |
FTSE MIB |
19012.0 |
21015.3 |
21241.93 |
1.1% |
11.7% |
| Spain |
IBEX 35 |
10279.5 |
9630.7 |
9717.10 |
0.9% |
-5.5% |
| Sweden |
OMX Stockholm 30 |
1464.6 |
1401.1 |
1422.63 |
1.5% |
-2.9% |
| Switzerland |
SMI |
8983.4 |
8502.1 |
8608.91 |
1.3% |
-4.2% |
|
|
|
|
|
|
|
| North America |
|
|
|
|
|
|
| United States |
Dow |
17823.1 |
17265.2 |
17128.45 |
-0.8% |
-3.9% |
|
NASDAQ |
4736.1 |
4933.5 |
4923.08 |
-0.2% |
3.9% |
|
S&P 500 |
2058.9 |
2012.4 |
2005.52 |
-0.3% |
-2.6% |
| Canada |
S&P/TSX Comp. |
14632.4 |
12790.0 |
13024.04 |
1.8% |
-11.0% |
| Mexico |
Bolsa |
43145.7 |
42000.6 |
42936.630 |
2.2% |
-0.5% |
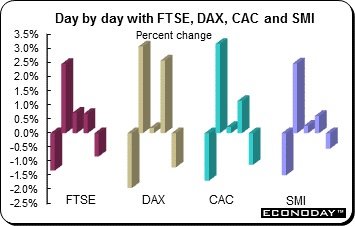 Despite losses on Monday and Friday, equities ended the week with healthy gains. Friday's declines were attributed to profit taking after the mid-week rally and renewed concerns regarding global growth. Markets around the world were under pressure at the end of the trading week as investors remained focused on crude oil prices and the underlying weaknesses in the global economy. The FTSE and CAC were up 1.7 percent, the DAX gained 2.6 percent and the SMI added 1.3 percent. Any ideas of a Santa Claus rally quickly dissipated. Despite losses on Monday and Friday, equities ended the week with healthy gains. Friday's declines were attributed to profit taking after the mid-week rally and renewed concerns regarding global growth. Markets around the world were under pressure at the end of the trading week as investors remained focused on crude oil prices and the underlying weaknesses in the global economy. The FTSE and CAC were up 1.7 percent, the DAX gained 2.6 percent and the SMI added 1.3 percent. Any ideas of a Santa Claus rally quickly dissipated.
On Thursday, investors had their first opportunity to react to Wednesday's interest rate increase by the Federal Reserve. U.S. markets already had positively reacted mainly on Wednesday and Asian markets followed early in Thursday's global market day. However, weakness in commodity prices and especially crude saw equity gains erode in late trading. An analyst noted that the Fed increased rates and the markets survived.
Two key business surveys were released for Germany during the week. Both indicated some weakness in sentiment. The UK posted three key reports for November — consumer prices, labour force data and retail sales. Consumer prices continued to display weakness while both the labour force and retail sales indicated strength.
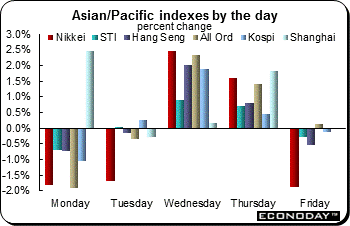 Even though the week ended on a down note Friday, all indexes in Asia Pacific were up on the week with the exception of the Nikkei. Although investors were diverted by the Fed action, continuing pressures from commodities reasserted themselves sending stocks lower. Gains ranged from 0.2 percent (KLCI) to 4.2 percent (Shanghai Composite) on the week. The Nikkei lost 1.3 percent. Even though the week ended on a down note Friday, all indexes in Asia Pacific were up on the week with the exception of the Nikkei. Although investors were diverted by the Fed action, continuing pressures from commodities reasserted themselves sending stocks lower. Gains ranged from 0.2 percent (KLCI) to 4.2 percent (Shanghai Composite) on the week. The Nikkei lost 1.3 percent.
Japanese equities dropped Friday after the Bank of Japan tweaked its bond buying program and in the process confused investors. While keeping its main target for monetary stimulus unchanged at an annual pace of about ¥80 trillion, the BoJ altered its composition slightly. The Nikkei climbed as much as 2.7 percent before reversing direction to end the session down 1.9 percent. The BoJ's surprise measures — albeit modest — to boost its economy jolted markets, ultimately sending shares lower, bonds higher and pushing the yen marginally stronger. The BoJ's measures come on the heels of the Federal Reserve's decision to lift its fed funds rate and highlight the divergent monetary policies of global central banks. Such a split risks triggering outflows from developing economies and exchange rate fluctuations. Still the new measures do not amount to extra easing by any significant degree. The BoJ will accelerate government bond purchases slightly, but only to replace maturing bonds.
The Shanghai Composite climbed 4.2 percent on the week. The index has rebounded about 22 percent from an August low after the government took unprecedented measures to prop up equities and speculation grows policymakers will take more measures to bolster the economy. The Hang Seng was up a more modest 1.4 percent for the week. Official data showed China's home price recovery has spread to smaller cities after authorities rolled out easing measures targeting regions with a surplus of unsold homes.
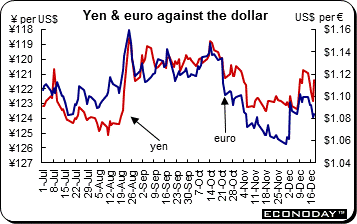 The U.S. dollar was up against all of its major counterparts including the euro, yen, pound sterling, Swiss franc and the Canadian and Australian dollars even though it eased on Friday. The currency was already higher merely on the prospect that the Fed would be the first central bank among the developed economies to raise interest rates. While Fed Chair Janet Yellen acknowledged that a rising dollar will prove both a headwind for growth and a constraint on inflation, she voiced confidence in the U.S. economy that it will overcome any hurdles neat year. The U.S. dollar was up against all of its major counterparts including the euro, yen, pound sterling, Swiss franc and the Canadian and Australian dollars even though it eased on Friday. The currency was already higher merely on the prospect that the Fed would be the first central bank among the developed economies to raise interest rates. While Fed Chair Janet Yellen acknowledged that a rising dollar will prove both a headwind for growth and a constraint on inflation, she voiced confidence in the U.S. economy that it will overcome any hurdles neat year.
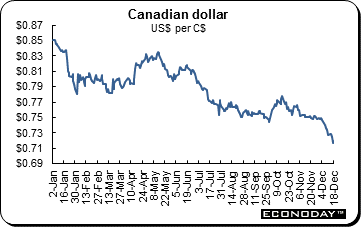 The Canadian dollar continues to retreat against its U.S. counterpart. While the U.S. dollar has discovered fresh vim following the Federal Reserve's much anticipated rate rise, the Canadian dollar is struggling as falling oil prices cloud the outlook for the economy. The country's oil sands industry, which requires a higher oil price for producers to break even, has been a source of significant investment in recent years. The Canadian currency is down almost 17 percent so far this year marking its second worst year on record, trailing only the 18.6 percent plunge during the 2008 financial crisis. The heaviest weights on the Canadian currency have been plummeting oil prices, the divergence between U.S. and Canadian monetary policies and the underlying strength in the U.S. dollar. The Canadian dollar continues to retreat against its U.S. counterpart. While the U.S. dollar has discovered fresh vim following the Federal Reserve's much anticipated rate rise, the Canadian dollar is struggling as falling oil prices cloud the outlook for the economy. The country's oil sands industry, which requires a higher oil price for producers to break even, has been a source of significant investment in recent years. The Canadian currency is down almost 17 percent so far this year marking its second worst year on record, trailing only the 18.6 percent plunge during the 2008 financial crisis. The heaviest weights on the Canadian currency have been plummeting oil prices, the divergence between U.S. and Canadian monetary policies and the underlying strength in the U.S. dollar.
All 10 major Asian currencies are forecast by strategists to fall against the dollar for a third year. They blame China. China's slowdown is hurting Asian nations with strong trade linkages to it and the August 11 devaluation of the yuan has clouded the outlook for a currency that had been a source of stability in Asia during past crises. According to analysts, the Chinese yuan trumps the U.S. dollar so far in terms of its impact on Asian currencies. Asia has a heightened sensitivity to the yuan, which represents the hub of the region's supply chain to the rest of the world.
|
|
2014 |
2015 |
% Change |
|
|
Dec 31 |
Dec 11 |
Dec 18 |
Week |
2015 |
| U.S. $ per currency |
|
|
|
|
|
|
| Australia |
A$ |
0.8170 |
0.719 |
0.718 |
-0.1% |
-12.1% |
| New Zealand |
NZ$ |
0.7801 |
0.6712 |
0.674 |
0.4% |
-13.6% |
| Canada |
C$ |
0.8614 |
0.7279 |
0.717 |
-1.4% |
-16.7% |
| Eurozone |
euro (€) |
1.2098 |
1.0993 |
1.087 |
-1.1% |
-10.2% |
| UK |
pound sterling (£) |
1.5585 |
1.5221 |
1.492 |
-2.0% |
-4.3% |
|
|
|
|
|
|
|
| Currency per U.S. $ |
|
|
|
|
|
|
| China |
yuan |
6.2055 |
6.4552 |
6.481 |
-0.4% |
-4.3% |
| Hong Kong |
HK$* |
7.7546 |
7.7506 |
7.753 |
0.0% |
0.0% |
| India |
rupee |
63.0437 |
66.895 |
66.404 |
0.7% |
-5.1% |
| Japan |
yen |
119.8200 |
120.8313 |
121.300 |
-0.4% |
-1.2% |
| Malaysia |
ringgit |
3.4973 |
4.2965 |
4.286 |
0.3% |
-18.4% |
| Singapore |
Singapore $ |
1.3246 |
1.4128 |
1.413 |
0.0% |
-6.2% |
| South Korea |
won |
1090.9800 |
1179.55 |
1183.100 |
-0.3% |
-7.8% |
| Taiwan |
Taiwan $ |
31.6560 |
32.82 |
32.938 |
-0.4% |
-3.9% |
| Thailand |
baht |
32.8800 |
36.16 |
36.137 |
0.1% |
-9.0% |
| Switzerland |
Swiss franc |
0.9942 |
0.9828 |
0.9923 |
-1.0% |
0.2% |
| *Pegged to U.S. dollar |
|
|
|
|
|
|
| Source: Bloomberg |
|
|
|
|
|
|
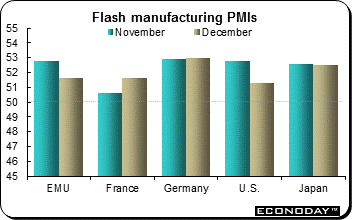 December flash PMI report suggested that Eurozone economic activity expanded at much the same rate as it did in November. A flash composite output reading of 54.0 was down slightly from the final November report. It reflected a modest improvement in manufacturing that was just more than offset by a minor deterioration in services. The flash manufacturing PMI was 53.1 while the comparable service sector measure was 53.9. Inflation pressures remained modest. Regionally within the core, the performance gap between France, where the composite output index dipped to just 50.3 while Germany was off 0.3 points but at a respectable 54.9, widened again. December flash PMI report suggested that Eurozone economic activity expanded at much the same rate as it did in November. A flash composite output reading of 54.0 was down slightly from the final November report. It reflected a modest improvement in manufacturing that was just more than offset by a minor deterioration in services. The flash manufacturing PMI was 53.1 while the comparable service sector measure was 53.9. Inflation pressures remained modest. Regionally within the core, the performance gap between France, where the composite output index dipped to just 50.3 while Germany was off 0.3 points but at a respectable 54.9, widened again.
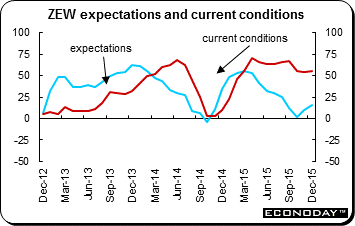 The December ZEW survey current conditions index was 55.0, up 0.6 points from November. Expectations showed a rather larger bounce, gaining nearly 6 points to 16.1 to reach their highest reading since August. ZEW described the German economy as robust enough to withstand the knock-on effects of slowing global demand but acknowledged that increasing weakness in the emerging markets had hit domestic exporters. However, the main issue was still seen to be the influx of migrants who need to be accommodated in the local labour market. The December ZEW survey current conditions index was 55.0, up 0.6 points from November. Expectations showed a rather larger bounce, gaining nearly 6 points to 16.1 to reach their highest reading since August. ZEW described the German economy as robust enough to withstand the knock-on effects of slowing global demand but acknowledged that increasing weakness in the emerging markets had hit domestic exporters. However, the main issue was still seen to be the influx of migrants who need to be accommodated in the local labour market.
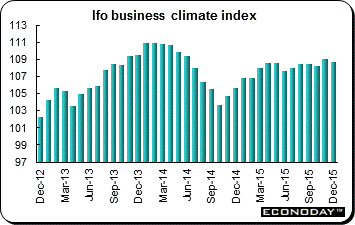 December's Ifo business climate indicator slipped 0.3 point to 108.7 reflecting a modest deterioration in current conditions. The current conditions index was down 0.6 points on the month at 112.8 and so reversed nearly its entire November rise. Expectations on the other hand were unchanged at 104.7 and matched their highest reading since May 2014. Among the major production sectors, manufacturing morale edged up 0.2 points to 12.3, its best level since May, and services saw a 0.1 point gain to 33.7. However, retail was down 0.9 points at a 5-month low of 7.9, wholesale dropped 3.3 points to 11.8 and construction was off 0.6 points at 1.8. December's Ifo business climate indicator slipped 0.3 point to 108.7 reflecting a modest deterioration in current conditions. The current conditions index was down 0.6 points on the month at 112.8 and so reversed nearly its entire November rise. Expectations on the other hand were unchanged at 104.7 and matched their highest reading since May 2014. Among the major production sectors, manufacturing morale edged up 0.2 points to 12.3, its best level since May, and services saw a 0.1 point gain to 33.7. However, retail was down 0.9 points at a 5-month low of 7.9, wholesale dropped 3.3 points to 11.8 and construction was off 0.6 points at 1.8.
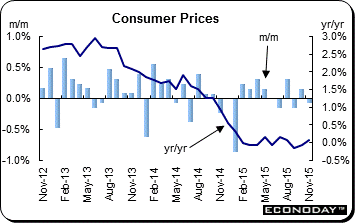 November consumer prices were unchanged on the month and up 0.1 percent from a year ago. The main upward contribution to the change in the yearly rate came from transport where charges fell 0.7 percent on the month compared with a 1.2 percent drop a year ago. Within this, petrol prices had a significant impact, dipping 1.5 pence per litre this year or only half the decline seen in 2014. Elsewhere, alcoholic beverages & tobacco (down 0.1 percent after down 1.2 percent) also had a positive effect as did miscellaneous goods & services (0.3 percent after a decline of 0.1 percent). The largest downward contribution was made by clothing & footwear where a 0.1 percent monthly drop compared with an increase of 0.7 percent in November last year. This was the first decline in prices between October and November since official records began in 1996 but followed the steepest ever September-to-October rise. As a result, core consumer prices were also flat on the month which saw their annual rate edge up from 1.1 percent to 1.2 percent. November consumer prices were unchanged on the month and up 0.1 percent from a year ago. The main upward contribution to the change in the yearly rate came from transport where charges fell 0.7 percent on the month compared with a 1.2 percent drop a year ago. Within this, petrol prices had a significant impact, dipping 1.5 pence per litre this year or only half the decline seen in 2014. Elsewhere, alcoholic beverages & tobacco (down 0.1 percent after down 1.2 percent) also had a positive effect as did miscellaneous goods & services (0.3 percent after a decline of 0.1 percent). The largest downward contribution was made by clothing & footwear where a 0.1 percent monthly drop compared with an increase of 0.7 percent in November last year. This was the first decline in prices between October and November since official records began in 1996 but followed the steepest ever September-to-October rise. As a result, core consumer prices were also flat on the month which saw their annual rate edge up from 1.1 percent to 1.2 percent.
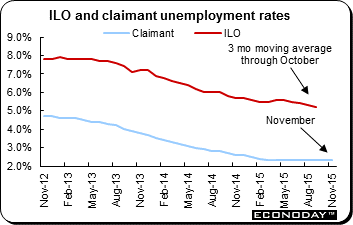 November claimant count unemployment was up 3,900 after a smaller revised 200 increase in October. This was the fourth consecutive month in which joblessness on this measure has risen. However, the cumulative gain has still not been sufficient to raise the unemployment rate from the 2.3 percent mark at which it has been stuck since March. The ILO data were more upbeat, showing an 110,000 drop in the number of people out of work in the three months to October. This saw the jobless rate decline to 5.2 percent from 5.3 percent. However, wage growth remains very subdued. In the three months to October the annual increase in average earnings was just 2.4 percent, down 0.6 percentage points from last time, its weakest print since March. Moreover, in October alone the yearly rise slowed still further to only 1.9 percent, the smallest gain since February. Excluding bonuses, annual growth in the latest three months was 2.0 percent, a significant decline from the 2.4 percent rate seen in the third quarter. November claimant count unemployment was up 3,900 after a smaller revised 200 increase in October. This was the fourth consecutive month in which joblessness on this measure has risen. However, the cumulative gain has still not been sufficient to raise the unemployment rate from the 2.3 percent mark at which it has been stuck since March. The ILO data were more upbeat, showing an 110,000 drop in the number of people out of work in the three months to October. This saw the jobless rate decline to 5.2 percent from 5.3 percent. However, wage growth remains very subdued. In the three months to October the annual increase in average earnings was just 2.4 percent, down 0.6 percentage points from last time, its weakest print since March. Moreover, in October alone the yearly rise slowed still further to only 1.9 percent, the smallest gain since February. Excluding bonuses, annual growth in the latest three months was 2.0 percent, a significant decline from the 2.4 percent rate seen in the third quarter.
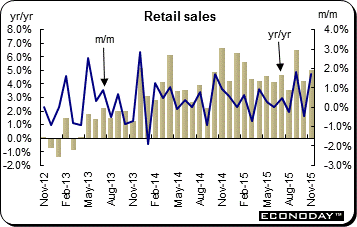 November retail sales jumped 1.7 percent and were up 5.0 percent on the year. Excluding auto fuel the picture was similarly robust with purchases also 1.7 percent higher than at the start of the quarter and 3.9 percent above their level in November 2014. November's buoyancy was broad-based but a 4.9 percent jump in the value of online sales was particularly important. The survey period included 'Black Friday' but the effects of 'Cyber Monday' will appear in the December report. The data put overall volume sales in the three months to November up a healthy 2.1 percent from the previous period. November retail sales jumped 1.7 percent and were up 5.0 percent on the year. Excluding auto fuel the picture was similarly robust with purchases also 1.7 percent higher than at the start of the quarter and 3.9 percent above their level in November 2014. November's buoyancy was broad-based but a 4.9 percent jump in the value of online sales was particularly important. The survey period included 'Black Friday' but the effects of 'Cyber Monday' will appear in the December report. The data put overall volume sales in the three months to November up a healthy 2.1 percent from the previous period.
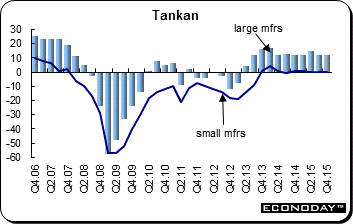 Fourth quarter Tankan large manufacturers' index reading was plus 12, unchanged from the third quarter. Expectations were for the reading to slip to plus 10. According to the Bank of Japan, all firms' sentiment outlook was weaker than usual. The BoJ noted that major firms were supported by the drop in crude oil prices. The Bank also noted that domestic supply/demand conditions lacked recovery momentum. However, output and input conditions have improved slightly. Small manufacturers' index was unchanged at zero, slightly under forecasts. Small enterprises CAPEX was down 0.2 percent, an improvement from September's minus 6.1 percent reading. Large enterprises' CAPEX was up 10.8 percent in December. Overall CAPEX was up 7.8 percent. Fourth quarter Tankan large manufacturers' index reading was plus 12, unchanged from the third quarter. Expectations were for the reading to slip to plus 10. According to the Bank of Japan, all firms' sentiment outlook was weaker than usual. The BoJ noted that major firms were supported by the drop in crude oil prices. The Bank also noted that domestic supply/demand conditions lacked recovery momentum. However, output and input conditions have improved slightly. Small manufacturers' index was unchanged at zero, slightly under forecasts. Small enterprises CAPEX was down 0.2 percent, an improvement from September's minus 6.1 percent reading. Large enterprises' CAPEX was up 10.8 percent in December. Overall CAPEX was up 7.8 percent.
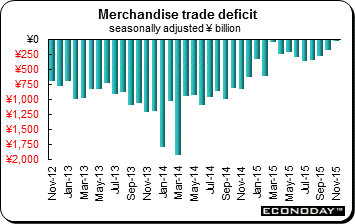 November merchandise trade balance swung back into deficit as exports faltered. The deficit was narrower as the pace of imports was much slower than anticipated. The trade gap was ¥379.7 billion, against expectations for a ¥446.2 billion deficit. This comes after a ¥108.3 billion surplus in October, which broke a six-month streak of deficits. Exports dropped 3.3 percent while imports retreated by 10.2 percent but was a slight improvement from the drop of 13.4 percent in October. While the deficit is smaller than anticipated, the details aren't encouraging. Imports have now been contracting at more than 10 percent for three straight months and they have been down in every month of 2015. The drop in exports confirms that Japan is struggling despite a wide array of policy support measures and a weaker yen. On a seasonally adjusted basis (see graph) the trade deficit was ¥3.3 billion after October's ¥173 billion deficit. November merchandise trade balance swung back into deficit as exports faltered. The deficit was narrower as the pace of imports was much slower than anticipated. The trade gap was ¥379.7 billion, against expectations for a ¥446.2 billion deficit. This comes after a ¥108.3 billion surplus in October, which broke a six-month streak of deficits. Exports dropped 3.3 percent while imports retreated by 10.2 percent but was a slight improvement from the drop of 13.4 percent in October. While the deficit is smaller than anticipated, the details aren't encouraging. Imports have now been contracting at more than 10 percent for three straight months and they have been down in every month of 2015. The drop in exports confirms that Japan is struggling despite a wide array of policy support measures and a weaker yen. On a seasonally adjusted basis (see graph) the trade deficit was ¥3.3 billion after October's ¥173 billion deficit.
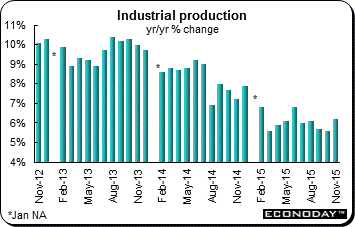 November industrial production improved to an increase of 6.2 percent from a year ago from 5.6 percent in October. On the month, output was up 0.58 percent after 0.48 percent the month before. For the year to date, output was up an unchanged 6.1 percent. Among the subcategories, only cement output was down on the year, falling 6.6 percent. However, auto production was up for a second consecutive month, this time by 16.0 percent after 4.9 percent on the year in October. Textiles improved to an increase of 6.4 percent after 5.6 percent. However, chemicals eased to 8.5 percent from 9.5 percent. Machinery eased as well, to 6.4 percent from 7.3 percent. November industrial production improved to an increase of 6.2 percent from a year ago from 5.6 percent in October. On the month, output was up 0.58 percent after 0.48 percent the month before. For the year to date, output was up an unchanged 6.1 percent. Among the subcategories, only cement output was down on the year, falling 6.6 percent. However, auto production was up for a second consecutive month, this time by 16.0 percent after 4.9 percent on the year in October. Textiles improved to an increase of 6.4 percent after 5.6 percent. However, chemicals eased to 8.5 percent from 9.5 percent. Machinery eased as well, to 6.4 percent from 7.3 percent.
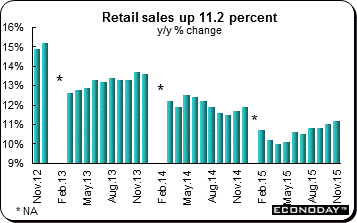 November retail sales improved to an increase of 11.2 percent from 11.0 percent on the year. Sales increased 0.86 percent on the month, up from 0.81 percent last time. For the year to date, sales were up 10.6 percent for a second month. Urban sales were up 11.0 percent on the year while rural sales increased 12.2 percent for a second month. Auto sales were up 9.0 percent after increasing 7.1 percent in October. Communication equipment was up 12.2 percent after soaring 36.6 percent in October. Household nondurables were up 14.1 percent, improving from 10.1 percent. Furniture improved to an increase of 14.5 percent after 12.4 percent. November retail sales improved to an increase of 11.2 percent from 11.0 percent on the year. Sales increased 0.86 percent on the month, up from 0.81 percent last time. For the year to date, sales were up 10.6 percent for a second month. Urban sales were up 11.0 percent on the year while rural sales increased 12.2 percent for a second month. Auto sales were up 9.0 percent after increasing 7.1 percent in October. Communication equipment was up 12.2 percent after soaring 36.6 percent in October. Household nondurables were up 14.1 percent, improving from 10.1 percent. Furniture improved to an increase of 14.5 percent after 12.4 percent.
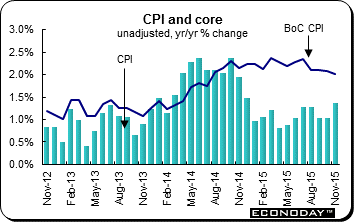 November consumer prices fell 0.1 percent on the month. However, the decline still saw the annual inflation rate jump fully 0.4 percentage points to 1.4 percent as the effects of last year's slump in energy prices ensured significantly positive base effects. Underlying prices were weaker still. The CPI excluding food and energy was 0.2 percent lower than in October although, at 1.8 percent, its annual rate was a tick up on last time. Meanwhile, the BoC's preferred core index dropped a sizeable 0.3 percent on the month, enough to shade its yearly rate from 2.1 percent to 2.0 percent, its weakest since July 2014. Seasonal factors tend to depress prices in November and adjusted for these the CPI was up 0.2 percent on the month, matching its October advance. On the same basis, the excluding food and energy index and the BoC's underlying gauge both edged just 0.1 percent firmer. Within the adjusted basket, the main upward pressure came from transportation, where prices climbed a monthly 0.8 percent, ahead of clothing & footwear (0.6 percent) and food & drink (also 0.6 percent). The downside was boosted by decreases in household operations, furnishings & equipment (0.6 percent) and recreation, education & reading (0.3 percent). November consumer prices fell 0.1 percent on the month. However, the decline still saw the annual inflation rate jump fully 0.4 percentage points to 1.4 percent as the effects of last year's slump in energy prices ensured significantly positive base effects. Underlying prices were weaker still. The CPI excluding food and energy was 0.2 percent lower than in October although, at 1.8 percent, its annual rate was a tick up on last time. Meanwhile, the BoC's preferred core index dropped a sizeable 0.3 percent on the month, enough to shade its yearly rate from 2.1 percent to 2.0 percent, its weakest since July 2014. Seasonal factors tend to depress prices in November and adjusted for these the CPI was up 0.2 percent on the month, matching its October advance. On the same basis, the excluding food and energy index and the BoC's underlying gauge both edged just 0.1 percent firmer. Within the adjusted basket, the main upward pressure came from transportation, where prices climbed a monthly 0.8 percent, ahead of clothing & footwear (0.6 percent) and food & drink (also 0.6 percent). The downside was boosted by decreases in household operations, furnishings & equipment (0.6 percent) and recreation, education & reading (0.3 percent).
Both the Federal Reserve and the Bank of Japan gave investors something to think about. For the Fed it was the positive news of a rate increase. For the BoJ it was — confusion. Economic data were mixed for the week. While the central bank actions were diversions, investors quickly resumed their worries about global growth and commodity prices.
It is a relatively light week for economic data. Japan posts its November data on December 25 including the consumer price index, household spending and unemployment. The UK and France report their final revisions to third quarter GDP.
| The following indicators will be released this week... |
| Europe |
|
|
| December 21 |
Eurozone |
EC Consumer Confidence (December flash) |
| December 23 |
France |
Gross Domestic Product (Q3.2015 final) |
|
|
Consumption of Manufactured Goods (November) |
|
UK |
Gross Domestic Product (Q3.2015 final) |
| |
|
|
| Asia/Pacific |
|
|
| December 25 |
Japan |
Consumer Price Index (November) |
|
|
Household Spending (November) |
|
|
Unemployment (November) |
| |
|
|
| Americas |
|
|
| December 23 |
Canada |
Monthly Gross Domestic Product (October) |
|
|
Retail Sales (October) |
| The following indicators will be released this week... |
| Europe |
|
|
| December 29 |
Germany |
Retail Sales (November) |
| December 30 |
Eurozone |
M3 Money Supply (November) |
| |
|
|
| Asia/Pacific |
|
|
| December 28 |
Japan |
Industrial Production (November) |
|
|
Retail Sales (November) |
Anne D Picker is the author of International Economic Indicators and Central Banks.
|
