|
China invented fireworks and we had plenty of them to begin the New Year -- including of all things the worst start in the history of the U.S. stock market. FOMC minutes posted during the week called last month's liftoff a close call. Policy makers at the time were focused on weak inflation as a risk but not the global environment. Had Shanghai's big losses hit this time last month, would the Fed have raised rates after all? This is not ours to know. But however much China may be slowing, the U.S. labor market is, well, Red Hot.
 The December employment report confirms the wisdom of December rate's hike, at least that is for the employment half of the Fed's dual mandate. Nonfarm payrolls surged 292,000 in the month, which was well over expectations, with November and October both revised higher by a net 50,000. October now stands at an impressive 307,000. The 3-month average, after spending much of 2015 below 200,000, is suddenly at 284,000 for the best showing since January 2015 and among the very best of the whole recovery. This rate of growth, according to past comments from Janet Yellen, is nearly double what is necessary to absorb newcomers into the labor market. The unemployment rate, which is calculated from a separate set of data, held steady at 5.0 percent which is a very healthy reading for the U.S. economy. And participation readings are on the rise as new entrants, perhaps more confident in their prospects, begin to look for work again. The December employment report confirms the wisdom of December rate's hike, at least that is for the employment half of the Fed's dual mandate. Nonfarm payrolls surged 292,000 in the month, which was well over expectations, with November and October both revised higher by a net 50,000. October now stands at an impressive 307,000. The 3-month average, after spending much of 2015 below 200,000, is suddenly at 284,000 for the best showing since January 2015 and among the very best of the whole recovery. This rate of growth, according to past comments from Janet Yellen, is nearly double what is necessary to absorb newcomers into the labor market. The unemployment rate, which is calculated from a separate set of data, held steady at 5.0 percent which is a very healthy reading for the U.S. economy. And participation readings are on the rise as new entrants, perhaps more confident in their prospects, begin to look for work again.
 Turning back to the payroll data, the professional & business services component is very strong especially the temporary help subcomponent which, at a gain of 34,000, has posted two very good results in the last three months (dark columns in accompanying graph). This is solid evidence that employers are scrambling to keep up with business and it's offering a leading indication for strength in future hiring. Special note must also be made for construction where December's 45,000 jump adds to a 48,000 gain in November. The nation's unusually warm temperatures are keeping construction going which is giving a further boost to the labor market. Turning back to the payroll data, the professional & business services component is very strong especially the temporary help subcomponent which, at a gain of 34,000, has posted two very good results in the last three months (dark columns in accompanying graph). This is solid evidence that employers are scrambling to keep up with business and it's offering a leading indication for strength in future hiring. Special note must also be made for construction where December's 45,000 jump adds to a 48,000 gain in November. The nation's unusually warm temperatures are keeping construction going which is giving a further boost to the labor market.
 But the results of the employment report relative to the Fed's other half of its dual mandate is not at all that great. Wages aren't giving much boost to overall inflation, falling fractionally month-to-month as seen in the light bar of the graph. The year-on-year rate, however, is showing some life, rising to 2.5 percent which however, given an easy comparison with a 0.2 percent monthly decline in December 2014, was widely expected to come in two to three tenths higher. And some harder comparisons, not easier ones, are coming up including a very tough 0.6 percent surge in January 2015. In actual dollar terms, earnings came in at $25.24 for a 1 cent dip from November which is the first decline since December 2014 and among only a handful during the whole recovery. The minutes of the December FOMC, posted at mid-week, highlighted doubts among some members that inflation will in fact begin to move higher. For the doves, these wage results don't offer any reassurance. But the results of the employment report relative to the Fed's other half of its dual mandate is not at all that great. Wages aren't giving much boost to overall inflation, falling fractionally month-to-month as seen in the light bar of the graph. The year-on-year rate, however, is showing some life, rising to 2.5 percent which however, given an easy comparison with a 0.2 percent monthly decline in December 2014, was widely expected to come in two to three tenths higher. And some harder comparisons, not easier ones, are coming up including a very tough 0.6 percent surge in January 2015. In actual dollar terms, earnings came in at $25.24 for a 1 cent dip from November which is the first decline since December 2014 and among only a handful during the whole recovery. The minutes of the December FOMC, posted at mid-week, highlighted doubts among some members that inflation will in fact begin to move higher. For the doves, these wage results don't offer any reassurance.
 The latest week (and 2016 for that matter) started with a thud and we're not just talking about China. ISM's manufacturing index came out early in the week and the results were in the contraction column. The December index came in at 48.2, measurably below the 50 level which is the breakeven point for monthly change. This is the second sub-50 reading in a row and only the third of the whole recovery. Factory orders, the shaded area of the graph, came out later in the week and also showed contraction. Low energy and commodity prices are holding down related industries and with them the factory sector as a whole. Weak demand for our exports, made weaker by the strength of the dollar, is a further headwind. The latest week (and 2016 for that matter) started with a thud and we're not just talking about China. ISM's manufacturing index came out early in the week and the results were in the contraction column. The December index came in at 48.2, measurably below the 50 level which is the breakeven point for monthly change. This is the second sub-50 reading in a row and only the third of the whole recovery. Factory orders, the shaded area of the graph, came out later in the week and also showed contraction. Low energy and commodity prices are holding down related industries and with them the factory sector as a whole. Weak demand for our exports, made weaker by the strength of the dollar, is a further headwind.
 But there was some hidden strength in the ISM report where exports, as tracked in the dark line of the graph, are suddenly on the mend. After hitting recovery lows of 46.5 in August and September, the December index jumped 4.5 points to 51.0 for the first plus 50 reading since April last year. Does this point to an upturn for export demand? Exports of the nation's goods, the shaded area of the graph, have been trending lower for more than a year with November, in data also posted during the week, down 1.1 percent to $122.2 billion. By coincidence perhaps, the ISM's other report during the week was on non-manufacturing and also showed an export spike, up 4.0 points to 53.5. But this reading, boosted by foreign demand for U.S. business and technical services, has never shown much weakness despite the strength of the dollar. But there was some hidden strength in the ISM report where exports, as tracked in the dark line of the graph, are suddenly on the mend. After hitting recovery lows of 46.5 in August and September, the December index jumped 4.5 points to 51.0 for the first plus 50 reading since April last year. Does this point to an upturn for export demand? Exports of the nation's goods, the shaded area of the graph, have been trending lower for more than a year with November, in data also posted during the week, down 1.1 percent to $122.2 billion. By coincidence perhaps, the ISM's other report during the week was on non-manufacturing and also showed an export spike, up 4.0 points to 53.5. But this reading, boosted by foreign demand for U.S. business and technical services, has never shown much weakness despite the strength of the dollar.
 Unit sales of vehicles, which are posted at the beginning of each month by the automakers themselves, have not been telling the same story as the government's motor vehicle component of the retail sales report. The line in the graph, which is unit sales, peaked out at extremely strong annualized rates over 18 million from September through November. But the motor vehicle component declined in two of those three months? The biggest factor at play in the confusion is sales to businesses which are included in the unit sales data but are excluded in the retail sales report. The graph looks like unit sales are coming back down to retail sales. The Econoday consensus is calling for no change in the coming retail sales report for December with vehicle sales holding down the outlook, excluding which retail sales are expected to rise 0.2 percent. Unit sales of vehicles, which are posted at the beginning of each month by the automakers themselves, have not been telling the same story as the government's motor vehicle component of the retail sales report. The line in the graph, which is unit sales, peaked out at extremely strong annualized rates over 18 million from September through November. But the motor vehicle component declined in two of those three months? The biggest factor at play in the confusion is sales to businesses which are included in the unit sales data but are excluded in the retail sales report. The graph looks like unit sales are coming back down to retail sales. The Econoday consensus is calling for no change in the coming retail sales report for December with vehicle sales holding down the outlook, excluding which retail sales are expected to rise 0.2 percent.
 On again, off again. Just like a circuit breaker should, right? But in this case it's the circuit breaker itself that is going on and off, and the latest word is off as Chinese authorities, rattled from separate 6.9 and 7.0 percent wind shears in the Shanghai composite, fly by the seat of their pants. Slowing in the Chinese economy has already been built into the U.S. outlook but not, perhaps, for a collapse of the Chinese stock market. China aside, the week's Fedspeak was hawkish and headed by Vice Chairman Stanley Fischer who, in nothing but the bluntest terms, said the market has yet to price in the full extent of this year's likely rate hikes which Fed forecasts say will hit four times or double what's priced into the Treasury market right now. Fischer made his comments, however, after only the first of the Shanghai nosedives, not the second. On again, off again. Just like a circuit breaker should, right? But in this case it's the circuit breaker itself that is going on and off, and the latest word is off as Chinese authorities, rattled from separate 6.9 and 7.0 percent wind shears in the Shanghai composite, fly by the seat of their pants. Slowing in the Chinese economy has already been built into the U.S. outlook but not, perhaps, for a collapse of the Chinese stock market. China aside, the week's Fedspeak was hawkish and headed by Vice Chairman Stanley Fischer who, in nothing but the bluntest terms, said the market has yet to price in the full extent of this year's likely rate hikes which Fed forecasts say will hit four times or double what's priced into the Treasury market right now. Fischer made his comments, however, after only the first of the Shanghai nosedives, not the second.
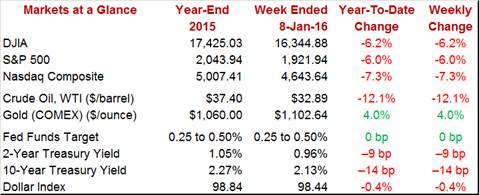
U.S. stocks were blood red in the week, down a total 6.2 percent for the Dow which officially goes into the record books as the worst start of any year. Oil posted especially heavy losses, down 12.1 percent on the week for West Texas Intermediate which is testing support at $33 along its path, seemingly, to $30. The extending and unexpected declines in oil aren't making the Fed's inflation efforts any easier. Gold was a winner on the week, up 4.0 percent and just above $1,100, as were Treasuries where yields are going down, not up as the Fed expects. The 10-year yield fell 14 basis points on the week to 2.13 percent.
The strength of December's employment report is consistent with Vice Chairman Fischer's warning that an ample series of rate hikes is definitely on its way and it also hints at a stronger-than-expected outcome for fourth-quarter GDP where early estimates have been soft, between 1 and 2 percent. Less consistent with the confident outlook, however, is China. Global weakness may not be hitting the U.S. economy with great force, but global volatility is definitely affecting U.S. share prices.
It will be day to day with the Chinese markets as U.S. data in the beginning of the week are scarce. But jobless claims, which are expected to show strength, and import & export prices, which are expected to show weakness, will heat Thursday up followed by a rush of key data on Friday led by retail sales, where autos are expected to hold down holiday gains, and also by industrial production where manufacturing, hit by weak exports, is not expected to show much life. Consumer sentiment will also be posted on Friday offering early hints on China's immediate effects.
The small business optimism index has been flat but key components have been showing solid strength including hiring plans and especially job openings. Capital investment and expansion plans, both of which are related to future employment, have also been special positives. The Econoday consensus is calling for a small gain to 95.0 in the December index vs 94.8 in November.
Small Business Optimism Index - Consensus Forecast for December: 95.0
Range: 93.6 to 96.0
Initial jobless claims fell back to their very favorable trend in the January 2 week, down 10,000 to 277,000 though the 4-week average, at 275,750, is still slightly elevated compared to prior readings. Forecasters see claims edging further lower, down 2,000 in the January 9 week to 275,000.
Initial Jobless Claims - Consensus Forecast for January 9 week: 275,000
Range: 270,000 to 310,000
Import & export prices have been in deep contraction and further contraction is expected. The Econoday consensus is calling for a very steep 1.4 percent decrease for import prices in December, which would be the 6th straight drop, as well as a sizable 0.5 percent decrease for export prices which would be the 5th straight drop. Weakness in this report has not been confined to oil as non-petroleum import prices have also been in extended contraction.
Import Prices, M/M Chg - Consensus Forecast for December: -1.4%
Range: -2.1% to -0.2%
Export Prices, M/M Chg - Consensus Forecast for December: -0.5%
Range: -0.8% to -0.1%
The producer prices - final demand headline is expected to slip 0.1 percent following a much stronger-than-expected 0.3 percent rise in November. Forecasters see less weakness for December's core rate where the consensus is plus 0.1 percent. Service-centered gains in this report would help underscore the strength of domestic demand.
PPI-FD - Consensus for December: -0.1%
Range: -0.3% to +0.1%
PPI-FD Less Food & Energy - Consensus for December: +0.1%
Range: 0.0% to +0.3%
Held back by slowing in vehicle sales, retail sales were lukewarm going into year-end. The Econoday consensus is calling for no change in December, which improves to a consensus 0.2 percent gain when excluding autos. Core rates have been more solid with forecasters calling for a moderate 0.3 percent gain for December's ex-auto ex-gas reading. It will be this report's core readings, in fact, that will determine the health or weakness of holiday sales and their contribution to fourth-quarter growth.
Retail Sales - Consensus for December: 0.0%
Range: -0.4% to +0.3%
Retail Sales Ex-Autos - Consensus for December: +0.2%
Range: 0.0% to +0.7%
Retail Sales Ex-Autos Ex-Gas - Consensus for December: +0.3%
Range: +0.2% to +1.0%
The Empire State report has been offering decisive signals of weakness in the factory sector with the headline in significant contraction since August. Orders and backlogs have been stuck in the negative column as have the workweek and employment, both of which are at recovery lows. Employment is suffering its weakest streak since late 2009. Prices have also been in contraction with final-goods prices down for four straight months. The Econoday consensus is calling for a headline of minus 4.00 in January vs minus 4.59 in December.
Empire State Index - Consensus Forecast for January: -4.00
Range: -7.50 to +1.00
Manufacturing production in November, coming in unchanged, wasn't able to extend October's strength. And forecasters see no strength and no change for December. Industrial production, which includes utilities and mining, is expected to extend its declines, down 0.2 percent in what would be a fourth straight dip. Weakness in utilities reflects unseasonably warm temperatures while weakness in mining and manufacturing reflects weak energy and export markets.
Industrial Production, M/M Chg - Consensus Forecast for December: -0.2%
Range: -0.5% to +0.5%
Manufacturing Production, M/M Chg - Consensus Forecast for December: 0.0%
Range: -0.3% to +0.4%
Capacity Utilization Rate - Consensus Forecast for December: 76.9%
Range: 76.5% to 77.5%
Consumer sentiment is expected to come in at 93.0 for the January flash, which would be 4 tenths higher than December but a bit lower than the month-end trend. Strength has been centered in the current conditions component which will be especially watched in this report given events in China. Inflation expectations have been very subdued.
Consumer Sentiment, Preliminary - Consensus for January, Final: 93.0
Range: 91.0 to 95.5
Business inventories may be too heavy relative to sales, posing risks to future production and also to future hiring especially given troubles in China. But inventories have been coming down though not fast enough compared to sales which have also been coming down. Forecasters see a second month of no change for business inventories.
Business Inventories - Consensus for November: 0.0%
Range: -0.1% to +0.3%
|
