|
Demand for risk is contracting sharply in the financial markets, which is not a vote of confidence in the global outlook. When the FOMC last month launched the first rate hike in what is billed as a series of rate hikes, they had no idea Chinese stocks would collapse (or at least look very much like they're collapsing). Policy makers were, however, depending on strength in domestic consumer spending for the growth outlook and, for the inflation outlook, on easing downward pulls from oil and import prices. What they're getting so far this year isn't of course what they were expecting.
 The consumer definitely did not splurge during the 2015 holidays. Retail sales fell 0.1 percent in December despite low gasoline prices that are keeping more money in our pockets. Falling gas prices have been deflating retail sales totals for more than a year, putting the focus on ex-gasoline sales as seen in the graph. The monthly rate is tracked in the columns, the latest of which you can barely see because it's nearly at zero, at minus 0.02 percent to be exact and the weakest reading since June and the weakest December since the recession year of 2009. The year-on-year rate, at plus 3.9 percent, has slowed for the three months in a row. If we're not buying things, where are we putting the gas savings? Some of it is going into savings as the savings rate has moved over 5 percent, last at 5.5 percent in data for November. The consumer definitely did not splurge during the 2015 holidays. Retail sales fell 0.1 percent in December despite low gasoline prices that are keeping more money in our pockets. Falling gas prices have been deflating retail sales totals for more than a year, putting the focus on ex-gasoline sales as seen in the graph. The monthly rate is tracked in the columns, the latest of which you can barely see because it's nearly at zero, at minus 0.02 percent to be exact and the weakest reading since June and the weakest December since the recession year of 2009. The year-on-year rate, at plus 3.9 percent, has slowed for the three months in a row. If we're not buying things, where are we putting the gas savings? Some of it is going into savings as the savings rate has moved over 5 percent, last at 5.5 percent in data for November.
 Several retail components showed unusual weakness in December including apparel sales which, depressed by unseasonably warm weather, fell 0.9 percent. This is not good news for the nation's long list of apparel retailers. The Beige Book released a day before Friday's retail sales report, noted wide complaints out of the industry. Apparel makes up just under 5 percent of total sales while two larger components also showed weakness, motor vehicles which make up 21 percent of sales and general merchandise at 13 percent. Vehicle sales showed no change in December with the year-on-year rate, as tracked in the dark line of the graph, edging higher to what is still a comparatively soft 6.1 percent. Even though the weakness follows prior strength, it still raises the question of how much vehicles can continue to pull retail sales higher. The light line in the graph is general merchandise which is barely over zero at plus 0.1 percent. Weakness here, as in apparel, in part reflects price contraction related to falling import prices for consumer goods, though it also hints at a disengaged consumer. Several retail components showed unusual weakness in December including apparel sales which, depressed by unseasonably warm weather, fell 0.9 percent. This is not good news for the nation's long list of apparel retailers. The Beige Book released a day before Friday's retail sales report, noted wide complaints out of the industry. Apparel makes up just under 5 percent of total sales while two larger components also showed weakness, motor vehicles which make up 21 percent of sales and general merchandise at 13 percent. Vehicle sales showed no change in December with the year-on-year rate, as tracked in the dark line of the graph, edging higher to what is still a comparatively soft 6.1 percent. Even though the weakness follows prior strength, it still raises the question of how much vehicles can continue to pull retail sales higher. The light line in the graph is general merchandise which is barely over zero at plus 0.1 percent. Weakness here, as in apparel, in part reflects price contraction related to falling import prices for consumer goods, though it also hints at a disengaged consumer.
 Vehicles have also been holding up the factory sector, at least they were. Industrial production was another disappointment in the week, falling 0.4 percent for a third straight decline, one that reflects weather-related contraction in utility output and price-related contraction for mining which of course is getting hit by falling oil and commodity prices. But the manufacturing component has also been weak, down 0.1 percent in three of the last four months including December. The graph compares year-on-year vehicle production, the dark line which has chopped down to plus 3.7 percent, and manufacturing production excluding vehicles where growth is very subdued, not much above zero at plus 0.6 percent. Judging by vehicles sales at the retail level, the future contribution from vehicles is also in question for the factory sector. Other data in the industrial production report include a 4 tenths decline in capacity utilization to 76.5 percent in a reminder that output slack makes for low prices. Vehicles have also been holding up the factory sector, at least they were. Industrial production was another disappointment in the week, falling 0.4 percent for a third straight decline, one that reflects weather-related contraction in utility output and price-related contraction for mining which of course is getting hit by falling oil and commodity prices. But the manufacturing component has also been weak, down 0.1 percent in three of the last four months including December. The graph compares year-on-year vehicle production, the dark line which has chopped down to plus 3.7 percent, and manufacturing production excluding vehicles where growth is very subdued, not much above zero at plus 0.6 percent. Judging by vehicles sales at the retail level, the future contribution from vehicles is also in question for the factory sector. Other data in the industrial production report include a 4 tenths decline in capacity utilization to 76.5 percent in a reminder that output slack makes for low prices.
 And low prices are another theme of the week's data — a theme that raises questions on how well anchored inflation expectations can expect to remain. The headline for the producer price report fell 0.2 percent in December with the year-on-year rate at minus 1.0 percent. And ongoing declines in oil prices point to more of the same for next month's report for January. Excluding food and energy, prices did inch 0.1 percent higher on the month though the year-on-year rate fell 2 tenths to a less-than-robust plus 0.3 percent. A key negative in the report is lack of punch in service prices which did rise 0.1 percent for only, however, the second gain in five months (dark columns in graph). It's no surprise that goods prices fell again, down 0.7 percent for the sixth straight contraction, but weakness on the service side is a surprise given wide confidence in the strength of the domestic economy. And low prices are another theme of the week's data — a theme that raises questions on how well anchored inflation expectations can expect to remain. The headline for the producer price report fell 0.2 percent in December with the year-on-year rate at minus 1.0 percent. And ongoing declines in oil prices point to more of the same for next month's report for January. Excluding food and energy, prices did inch 0.1 percent higher on the month though the year-on-year rate fell 2 tenths to a less-than-robust plus 0.3 percent. A key negative in the report is lack of punch in service prices which did rise 0.1 percent for only, however, the second gain in five months (dark columns in graph). It's no surprise that goods prices fell again, down 0.7 percent for the sixth straight contraction, but weakness on the service side is a surprise given wide confidence in the strength of the domestic economy.
 However strong the U.S. economy is, we are exposed to global price effects, evidenced in the week's import & export price report where both categories moved deeper into contraction. Imports, made cheaper by the strength of the U.S. dollar, fell 1.2 percent in December with the year-on-year rate, as seen in the dark columns, improving but still deeply negative at minus 8.2 percent. Export prices, the line in the graph, fell 1.1 percent in the month for year-on-year contraction of 6.5 percent. Data like these, not to mention $30 oil, aren't making for sound sleep at the Federal Reserve. Oh, and there was one other report during the week, the consumer sentiment flash for early January that, showing mixed signals on the initial impact of the Chinese breakdown, also showed a 2 tenths downdraft in 1-year inflation expectations to only plus 2.4 percent — which is very low for this reading. However strong the U.S. economy is, we are exposed to global price effects, evidenced in the week's import & export price report where both categories moved deeper into contraction. Imports, made cheaper by the strength of the U.S. dollar, fell 1.2 percent in December with the year-on-year rate, as seen in the dark columns, improving but still deeply negative at minus 8.2 percent. Export prices, the line in the graph, fell 1.1 percent in the month for year-on-year contraction of 6.5 percent. Data like these, not to mention $30 oil, aren't making for sound sleep at the Federal Reserve. Oh, and there was one other report during the week, the consumer sentiment flash for early January that, showing mixed signals on the initial impact of the Chinese breakdown, also showed a 2 tenths downdraft in 1-year inflation expectations to only plus 2.4 percent — which is very low for this reading.
 Things of course have been up and down in the markets, well, actually entirely down. But things have also been up and down for Fedspeak. Last week Vice Chairman Stanley Fischer, known as a dove, bluntly warned in the most hawkish fashion that the markets need to price in more rate hikes. But then this week, St. Louis President James Bullard, a voter on this year's FOMC and well known as a hawk, said he's not so certain anymore that inflation expectations will hold. Inflation concerns were also voiced in the week by voting members William Dudley of New York and Eric Rosengren of Boston. Things of course have been up and down in the markets, well, actually entirely down. But things have also been up and down for Fedspeak. Last week Vice Chairman Stanley Fischer, known as a dove, bluntly warned in the most hawkish fashion that the markets need to price in more rate hikes. But then this week, St. Louis President James Bullard, a voter on this year's FOMC and well known as a hawk, said he's not so certain anymore that inflation expectations will hold. Inflation concerns were also voiced in the week by voting members William Dudley of New York and Eric Rosengren of Boston.
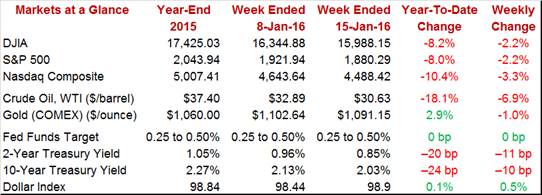
And, in more bad news for the Fed, it was another week of blood for the stock market with the Dow down 2.2 percent and taking its day-to-day cue from the Shanghai composite. Oil is the big news of course, denting inflation expectations and falling nearly 7 percent in the week to repeatedly test support at $30 for WTI. Money continues to rush into the Treasury market where rates are falling, not rising as the Federal Reserve had expected. The 2-year yield, the shortest on the coupon curve, fell an outsized 11 basis points to 0.85 percent to bring its two week drop to an astonishing 20 basis points (a telling sign of flight to safety that only the deepest pessimist could have predicted). The 10-year yield fell 10 basis points in the week and is bordering 2 percent at 2.03 percent.
Federal Reserve officials voiced sound confidence in their outlook and their actions, but that was last month. This month is a new story with Fedspeak sounding uncharacteristically dissonant. China wasn't much of a factor at the December FOMC and oil was still near $40. Not anymore, which sets up what promises to be a dovish, though probably not subdued, FOMC meeting at month end.
A bright spot in the economy has been the housing sector which takes center stage in this week's holiday-shortened calendar. The housing market index comes out on Tuesday and is expected to show a gain as are housing starts on Wednesday, both benefiting from warm weather. Permits, however, are expected to ease back from prior strength. Existing home sales on Friday are expected to surge, reversing prior weakness that was tied to new closing rules. Outside of housing, consumer prices are a major release with moderate pressure once again seen for the core rate, one that would contrast with mostly soft readings for other inflation gauges. The Philly Fed is out on Thursday and if it should prove as weak as the prior week's Empire State report, expectations for the factory sector may slip further. Thursday's data on initial jobless claims, however, may garner the most attention as the sample week matches that of the January employment report.
The new home market has been solid though the housing market index has been losing a little steam, down 4 points over two months to a still very strong 61 in December. Forecasters see the index gaining back 1 point in January to 62. Sales indications have been strong in this report though the traffic component, reflecting weak interest on the part of first-time buyers, has been noticeably lagging.
Housing Market Index - Consensus Forecast for January: 62
Range: 60 to 62
Consumer prices have been showing more life than other inflation readings which have been showing very little, if any, life. The Econoday consensus for December is for a fourth straight 0.2 percent gain for the core ex-food ex-energy reading. Total prices, however, are expected to come in unchanged reflecting another expected decline for energy.
Consumer Price Index, M/M Chg - Consensus Forecast for December: 0.0%
Range: -0.2% to +0.2%
CPI Less Food & Energy, M/M Chg - Consensus Forecast for December: +0.2%
Range: +0.1% to +0.3%
Housing starts & permits have been volatile month-to-month but have been trending higher. Starts, after surging 11 percent in November, are expected to rise a further 2.3 percent in December to a 1.200 million annualized rate, benefiting from unseasonably warm temperatures across most of the country. Permits, also up 11 percent in November but are not subject to weather effects, are expected to ease 5.6 percent.
Housing Starts - Consensus Forecast for December: 1.200 million
Range: 1.115 to 1.255 million
Housing Permits - Consensus Forecast for December: 1.217 million
Range: 1.178 to 1.300 million
Initial jobless claims are expected to fall back to their very favorable trend in the January 16 week, down 9,000 to 275,000. The reporting week is of special importance as it is also the sample week for the January employment report. Earlier trends in claims data have been pointing to less strength for the January labor market.
Initial Jobless Claims - Consensus Forecast for January 16 week: 275,000
Range: 267,000 to 285,000
The Philadelphia Fed manufacturing index is expected to remain in negative territory, at a consensus minus 4.0 in January for what would be a fifth straight month of contraction. Last week's Empire State report for January was deeply negative and, unlike the Philly Fed report, was the first to signal back in August what would be a long slow second-half for the factory sector. Note that annual revisions to the Philly data have swept prior readings lower including December, from an initial minus 5.9 to minus 10.2.
Philadelphia Fed Manufacturing Index - Consensus Forecast for January: -4.0
Range: -10.0 to +3.5
The manufacturing PMI, which had been posting much stronger levels of activity than other manufacturing reports, slowed sharply in November and December. And not much is expected for the January flash with the Econoday consensus calling for a 2 tenths dip from final December to 51.0. New orders have been in near stagnation in this report with backlogs contracting sharply.
Manufacturing PMI, Flash - Consensus Forecast for January: 51.0
Range: 50.5 to 51.8
New closing rules for November deeply depressed existing home sales which are expected to bounce back strongly in the December report, up a consensus 9.2 percent to an annualized rate of 5.200 million. Lack of supply of available homes on the market has been holding down sales but has also been supporting prices which were up 6.3 percent for November's median.
Existing Home Sales, Annualized Rate - Consensus Forecast for December: 5.200 million
Range: 5.000 to 5.450 million
Losses in the stock market and a rise in jobless claims will likely depress the index of leading indicators which is expected to decline 0.1 percent in December. This index had been flat through most of the second half before showing life in both October and November.
Index of Leading Economic Indicators - Consensus Forecast for December: -0.1%
Range: -0.3% to +0.2%
|
