|
Listening to the congressional questioning of Janet Yellen, not to mention the various presidential debates, you would think that the U.S. economy has already completely fallen apart. But it really hasn't. And in fact, growth appears to be accelerating! No kidding. The week's data is definitely positive and led by convincing strength from the consumer who is benefiting from low unemployment and low gas prices and, despite negative rates everywhere and all the assessments of doom, is still walking on the sunny side of the street.
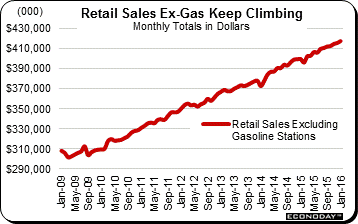 Consumer spending, at an annualized 2.2 percent, held up fourth-quarter GDP and, after the January retail sales report, looks to be offering even more support for first-quarter GDP, at least that's the initial indication. But spending is being pulled down, in an irony of sorts, by low prices for gasoline, prices that are however boosting the savings rate as well as boosting retail sales outside of gasoline stations. Ex-gasoline retail sales, as seen in the accompanying graph, have been on a steady and convincing ascent during the whole recovery, moving to $417 billion in January from just below $310 billion per month in 2009. Sales at gasoline stations, as a percentage of total retail sales, are at 7 percent, well down from 12 percent of total sales back in December 2009. Consumer spending, at an annualized 2.2 percent, held up fourth-quarter GDP and, after the January retail sales report, looks to be offering even more support for first-quarter GDP, at least that's the initial indication. But spending is being pulled down, in an irony of sorts, by low prices for gasoline, prices that are however boosting the savings rate as well as boosting retail sales outside of gasoline stations. Ex-gasoline retail sales, as seen in the accompanying graph, have been on a steady and convincing ascent during the whole recovery, moving to $417 billion in January from just below $310 billion per month in 2009. Sales at gasoline stations, as a percentage of total retail sales, are at 7 percent, well down from 12 percent of total sales back in December 2009.
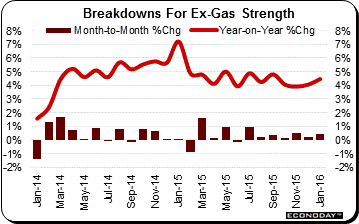 This graph breaks down the monthly totals for ex-gas sales into percentage changes and offers different looks at the steady gains. Ex-gas retail sales month-to-month (the dark columns) expanded for seven months in a row which matches the longest streak in five years. Year-on-year, ex-gas sales are at a very respectable plus 4.5 percent and reflect special strength in vehicle sales, up 6.9 percent on the year. Month-to-month, vehicle sales rose a strong 0.6 percent on top of similar gains in December and November. This strength is important and puts the auto sector back at the forefront of the nation's economy where it was through the first half of last year. Non-store retailers are also a standout, at an 8.7 percent year-on-year rate as e-commerce continues to build strength. Restaurants are also strong, at 6.1 percent despite a dip back in January sales, with building materials up 5.0 percent on the year. But when including gasoline stations and also sales of ever-cheapening general merchandise imports, readings come down with total sales growth at only 3.4 percent. Still, the 3.4 percent reading is — by far and despite the general chaos of January — the best since last January. The Atlanta Fed raised its first-quarter GDP forecast by 2 tenths following the retail sales report to a very respectable 2.7 percent. Doomsdayers may be grinding their molars but the nation's inward-looking service-sector economy remains sound. This graph breaks down the monthly totals for ex-gas sales into percentage changes and offers different looks at the steady gains. Ex-gas retail sales month-to-month (the dark columns) expanded for seven months in a row which matches the longest streak in five years. Year-on-year, ex-gas sales are at a very respectable plus 4.5 percent and reflect special strength in vehicle sales, up 6.9 percent on the year. Month-to-month, vehicle sales rose a strong 0.6 percent on top of similar gains in December and November. This strength is important and puts the auto sector back at the forefront of the nation's economy where it was through the first half of last year. Non-store retailers are also a standout, at an 8.7 percent year-on-year rate as e-commerce continues to build strength. Restaurants are also strong, at 6.1 percent despite a dip back in January sales, with building materials up 5.0 percent on the year. But when including gasoline stations and also sales of ever-cheapening general merchandise imports, readings come down with total sales growth at only 3.4 percent. Still, the 3.4 percent reading is — by far and despite the general chaos of January — the best since last January. The Atlanta Fed raised its first-quarter GDP forecast by 2 tenths following the retail sales report to a very respectable 2.7 percent. Doomsdayers may be grinding their molars but the nation's inward-looking service-sector economy remains sound.
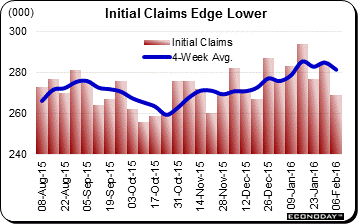 January's climb in unemployment claims, even though from rock-bottom historic lows, has been making the nervous nellies even more nervous. But calm may be in sight after the latest report with initial claims falling a very steep 16,000 in the February 6 week to a much lower-than-expected 269,000. This is the lowest level in two months. The 4-week average, at 281,250, fell 3,500 which is a sizable decrease for this reading. Continuing claims, which also had been moving higher, likewise moved down, to 2.249 million for a 21,000 decline in lagging data for the January 30 week. The unemployment rate for insured workers is very low, down 1 tenth at 1.6 percent. Another positive surprise in the next set of initial claims, which will cover the sample week of the monthly employment report, would give a strong boost to expectations for the February employment report, for perhaps even another tick lower in the unemployment rate to 4.8 percent. January's climb in unemployment claims, even though from rock-bottom historic lows, has been making the nervous nellies even more nervous. But calm may be in sight after the latest report with initial claims falling a very steep 16,000 in the February 6 week to a much lower-than-expected 269,000. This is the lowest level in two months. The 4-week average, at 281,250, fell 3,500 which is a sizable decrease for this reading. Continuing claims, which also had been moving higher, likewise moved down, to 2.249 million for a 21,000 decline in lagging data for the January 30 week. The unemployment rate for insured workers is very low, down 1 tenth at 1.6 percent. Another positive surprise in the next set of initial claims, which will cover the sample week of the monthly employment report, would give a strong boost to expectations for the February employment report, for perhaps even another tick lower in the unemployment rate to 4.8 percent.
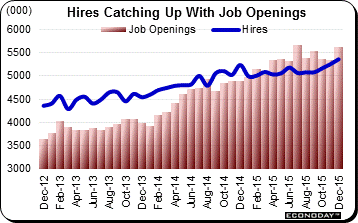 And there were data in the week, the JOLTS report, that point to further improvement in the labor participation rate, where gains remember were a highlight of the last employment report. Job openings are what attract new entries as well as re-entries into the labor force and they remain very strong, at 5.6 million in December for the second highest reading of the recovery. More good news comes from the number of hires, at 5.4 million which is the very best reading of the recovery. Other signs of strength come from a fall in the layoff rate and a rise in the quits rate with the latter also at a recovery high and indicating that workers are confident enough to look for better jobs. Given the strength, yes strength, of the labor market, it's no wonder that consumer spirits are solid and not suicidally depressed. And doomsdayers take note! Consumer confidence readings have been showing remarkable resilience during this season of gloom with the consumer sentiment index at a February flash of 90.7, down little more than 1 point over the average of the prior four months and actually matching the average of the third quarter, a time remember of hope and promise and expectations for a long series of rate hikes ahead. And there were data in the week, the JOLTS report, that point to further improvement in the labor participation rate, where gains remember were a highlight of the last employment report. Job openings are what attract new entries as well as re-entries into the labor force and they remain very strong, at 5.6 million in December for the second highest reading of the recovery. More good news comes from the number of hires, at 5.4 million which is the very best reading of the recovery. Other signs of strength come from a fall in the layoff rate and a rise in the quits rate with the latter also at a recovery high and indicating that workers are confident enough to look for better jobs. Given the strength, yes strength, of the labor market, it's no wonder that consumer spirits are solid and not suicidally depressed. And doomsdayers take note! Consumer confidence readings have been showing remarkable resilience during this season of gloom with the consumer sentiment index at a February flash of 90.7, down little more than 1 point over the average of the prior four months and actually matching the average of the third quarter, a time remember of hope and promise and expectations for a long series of rate hikes ahead.
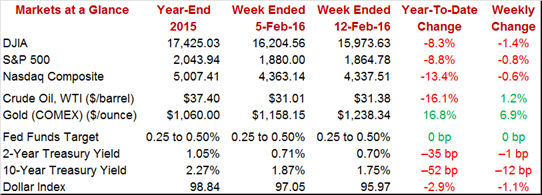
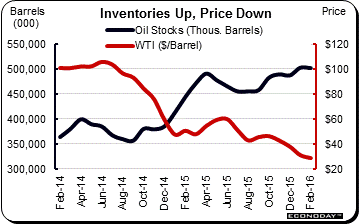 West Texas Intermediate was down just about all week, back under $30 and even under $28 before recovering at week's end, near $31.50 but still down 16 percent so far this year. WTl's exaggerated declines are tied to the exaggerated builds underway in petroleum inventories. U.S. commercial inventories for crude are over 500 million barrels, a record as seen in the black line of the graph. Inefficient wells have been closing but domestic output has seen limited impact from the price collapse, slowing from a record peak of 9.6 million barrels per day during mid-year last year to a steady four-month run at 9.2 million. Imports have risen the past two months, holding at a steady run near 8.0 million barrels per day. Low oil prices have definitely been hurting energy shares and contributed to a 1.4 percent loss for the Dow in the week to 15,973. Losses in bank shares have also hurt, hit by weakening profits and rising stress in the financial markets. West Texas Intermediate was down just about all week, back under $30 and even under $28 before recovering at week's end, near $31.50 but still down 16 percent so far this year. WTl's exaggerated declines are tied to the exaggerated builds underway in petroleum inventories. U.S. commercial inventories for crude are over 500 million barrels, a record as seen in the black line of the graph. Inefficient wells have been closing but domestic output has seen limited impact from the price collapse, slowing from a record peak of 9.6 million barrels per day during mid-year last year to a steady four-month run at 9.2 million. Imports have risen the past two months, holding at a steady run near 8.0 million barrels per day. Low oil prices have definitely been hurting energy shares and contributed to a 1.4 percent loss for the Dow in the week to 15,973. Losses in bank shares have also hurt, hit by weakening profits and rising stress in the financial markets.  But the problem here could be mitigated so to speak, at least in Europe where talk is building that the European Central Bank, as part of its quantitative easing policy, could actually protect the market and begin buying up bank shares. Such talk, however, isn't really a confidence builder and movement into the safety of U.S. Treasuries, where rates unlike Europe are still positive, has been simply colossal. The 2-year yield is down 35 basis points so far this year to 0.70 percent and the 10-year down 12 basis points in the week for a 52 basis point year-to-date decline. One good thing for exporters is that low Treasury yields are usually a negative for the dollar, and the dollar index did fall 1.1 percent on the week and is down 2.9 percent so far this year. And low yields reduce the opportunity cost for holding gold which had an unusually good week with a 6.9 percent gain to $1,238. But the problem here could be mitigated so to speak, at least in Europe where talk is building that the European Central Bank, as part of its quantitative easing policy, could actually protect the market and begin buying up bank shares. Such talk, however, isn't really a confidence builder and movement into the safety of U.S. Treasuries, where rates unlike Europe are still positive, has been simply colossal. The 2-year yield is down 35 basis points so far this year to 0.70 percent and the 10-year down 12 basis points in the week for a 52 basis point year-to-date decline. One good thing for exporters is that low Treasury yields are usually a negative for the dollar, and the dollar index did fall 1.1 percent on the week and is down 2.9 percent so far this year. And low yields reduce the opportunity cost for holding gold which had an unusually good week with a 6.9 percent gain to $1,238.
Janet Yellen was billed to keep an FOMC rate hike on the table during the week's semi-annual testimony to Congress. Yet negative policy rates in Asia and Europe, along with dislocations in European bonds, have been raising recession talk and turned the matter around, with Yellen having to reassure everyone that the next policy move (forget about a hike) is not likely to be a rate cut. The serpent may have swallowed negative rates but the economy, driven by the consumer, is still on the climb and it's still not too late, given continued strength in employment and consumer spending, to bring back the possibility of a March rate hike (at least in theory, that is).
A holiday shortened week starts off with the deeply depressed Empire State report offering what is expected to be another deeply negative indication on the manufacturing sector. The housing market index will follow on Tuesday and is expected to show continued optimism among the nation's home builders. Housing starts & permits are out on Wednesday and are expected to underscore housing as a leading strength for the economy. The labor market is the economy's greatest strength and initial jobless claims for Thursday will cover the sample week of the February employment report and look set to signal strong improvement from January. Consumer prices close out the week on Friday and are not expected to show any traction.
The Empire State report has been signaling decisive weakness for the factory sector since way back in August with January's minus 19.37 an especially upsetting headline. Orders and backlog orders are in a long run of contraction with recent weakness accelerating and pointing to even weaker headlines in the months ahead. Employment has been crumbling as has the 6-month outlook. Forecasters see only marginal relief for February with the Econoday consensus at minus 10.00.
Empire State Index - Consensus Forecast for February: -10.00
Range: -16.00 to -7.50
The housing market index has been losing a little steam but is nevertheless signaling that confidence among the nation's home builders is very strong. The Econoday consensus is calling for a 1 point rise to 61.0 for the February report, a reading that would be well above breakeven 50.0. The component for present sales has been especially strong as have the future sales. But traffic, reflecting lack of first-time buyers, has been lagging.
Housing Market Index - Consensus Forecast for February: 61
Range: 57 to 62
Housing starts & permits have been volatile month-to-month but have been trending higher with accelerating strength. Forecasters see starts coming in at a 1.175 million annual rate in January, in what would be a 2.3 percent gain from November, with permits far out front at 1.224 million in what would, however, be a fractional decline on the month. Starts and permits both fell back in December but followed strong gains in November. Year-on-year, starts were up a healthy 6.4 percent in December with permits especially strong at 14.4 percent.
Housing Starts - Consensus Forecast for January: 1.175 million
Range: 1.100 to 1.255 million
Housing Permits - Consensus Forecast for January: 1.224 million
Range: 1.190 to 1.255 million
Pulled down by extending declines for oil and commodities, the headline for December's producer prices report is expected to slip 0.2 percent for a second straight month. Excluding gasoline and food, the core rate is expected to show less weakness, at a consensus plus 0.1 percent gain. Service readings in this report, little changed in the December report, failed to offset commodity weakness. Year-on-year, producer prices were down 1.0 percent in December with the core rate up but only marginally at plus 0.3 percent.
PPI-FD - Consensus for January: -0.2%
Range: -0.5% to -0.1%
PPI-FD Less Food & Energy - Consensus for January: +0.1%
Range: 0.0% to +0.2%
PPI-FD Less Food, Energy & Trade Services - Consensus for January: +0.2%
Range: 0.0% to +1.1%
The range of estimates is wide but industrial production is expected to rise a strong 0.4 percent in January, reflecting strong utility output tied to the month's heavy weather and helped in part by what is expected to be a 0.2 percent gain for the manufacturing component where trends have otherwise been very soft. The gain for manufacturing is based not on regional Fed reports, which have been weak, but on hours data in the January employment report which were strong. The report's third component, mining, has been very weak due to low commodity prices.
Industrial Production, M/M Chg - Consensus Forecast for January: +0.4%
Range: -0.3% to +0.6%
Manufacturing Production, M/M Chg - Consensus Forecast for January: +0.2%
Range: -0.1% to +0.4%
Capacity Utilization Rate - Consensus Forecast for January: 76.7%
Range: 76.4% to 76.9%
The Philadelphia Fed manufacturing index is expected to extend a long series of declines with the Econoday forecast calling for a minus 2.5 February headline. At minus 3.5 in January, last month's reading was the fifth negative score in a row with the new orders index improving but still negative, at minus 1.4. Inventories have been down in this report and the six-month outlook has been easing, both pointing to defensive business expectations.
Philadelphia Fed Manufacturing Index - Consensus Forecast for February: -2.5
Range: -7.5 to +2.8
Losses in the stock market and a rise in jobless claims will likely depress the index of leading indicators which is expected to decline 0.2 percent in January. But for most of second-half last year, this index, boosted by low short-end rates as well as the report's credit component, pointed to respectable first-half growth for the economy this year.
Index of Leading Economic Indicators - Consensus Forecast for January: -0.2%
Range: -0.3% to +0.2%
Deflationary pull from Chinese imports as well as falling energy and commodity prices have been keeping down consumer prices which nevertheless have been showing some life. But little to no life is expected for the January report with the Econoday consensus calling for a headline minus 0.1 percent with the ex-food ex-energy core rate little better at plus 0.1 percent. The year-on-year rate for the December core came in above the Fed's 2 percent target at 2.1 percent, but 2.1 percent is far above the 1.4 percent rate for the PCE core which is the Fed's preferred reading.
Consumer Price Index, M/M Chg - Consensus Forecast for January: -0.1%
Range: -0.2% to -0.1%
CPI Less Food & Energy, M/M Chg - Consensus Forecast for January: +0.1%
Range: +0.1% to +0.2%
|
