|
Equities rebounded from last week's lows with most global indexes increasing for the week. Oil prices staged a rally helping to boost energy companies and in turn the indexes. But equities continue to trade in concert with oil prices. And when crude gave back some of its gains, so did stocks.
The effectiveness of central bank negative interest rate policies (NIRP) continue to be debated in the markets. In the Eurozone, Switzerland and Japan, NIRP has proven to be ineffective at weakening currencies and stirring inflation and suggests problems for central banks. Denmark's central bank (Danmarks Nationalbank) was the first to implement a negative interest rate in July 2012, followed by the European Central Bank (June 2014), Switzerland (December 2014), Sweden (February 2015) and Japan last month.
A market measure of inflation expectations since the BoJ pushed rates into negative territory at the end of January has dropped to a post crisis low while the yen has strengthened against the U.S. dollar. Similar evidence appears to be true for the Eurozone since the ECB went negative. Analysts think that this is strong evidence that the adoption of negative rates has undermined inflation expectations. On the other hand, the large asset purchase programs introduced by the Federal Reserve and Bank of England have proved to be effective at raising inflation expectations and weakening currencies. The ineffectiveness of NIRP could be due to markets interpreting the move as policy exhaustion even as markets require ever increasing accommodation to achieve the same outcomes.
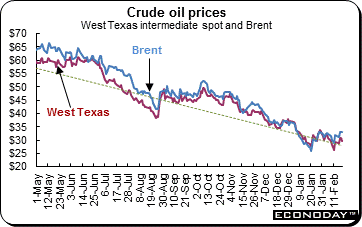 Earlier this week, oil prices rallied as Russia and Saudi Arabia proposed freezing production at January's level. At least six OPEC nations, including Saudi Arabia, have backed a plan to keep oil production at January's levels. That would help address a giant supply glut and strengthen prices, which have fallen to their lowest levels in about 13 years. Iran, which has not agreed to the deal and has said it wants to keep increasing its production, said it supported any measure to raise oil prices. The deal will not go into effect unless all 13 OPEC members agree to it. Earlier this week, oil prices rallied as Russia and Saudi Arabia proposed freezing production at January's level. At least six OPEC nations, including Saudi Arabia, have backed a plan to keep oil production at January's levels. That would help address a giant supply glut and strengthen prices, which have fallen to their lowest levels in about 13 years. Iran, which has not agreed to the deal and has said it wants to keep increasing its production, said it supported any measure to raise oil prices. The deal will not go into effect unless all 13 OPEC members agree to it.
| |
|
2015 |
2016 |
% Change |
|
Index |
Dec 31 |
Feb 12 |
Feb 19 |
Week |
2016 |
| Asia/Pacific |
|
|
|
|
|
|
| Australia |
All Ordinaries |
5344.6 |
4816.6 |
5008.28 |
4.0% |
-6.3% |
| Japan |
Nikkei 225 |
19033.7 |
14952.6 |
15967.17 |
6.8% |
-16.1% |
| Hong Kong |
Hang Seng |
21914.4 |
18319.6 |
19285.50 |
5.3% |
-12.0% |
| S. Korea |
Kospi |
1961.3 |
1835.3 |
1916.24 |
4.4% |
-2.3% |
| Singapore |
STI |
2882.7 |
2540.0 |
2656.87 |
4.6% |
-7.8% |
| China |
Shanghai Composite |
3539.2 |
2763.5 |
2860.02 |
3.5% |
-19.2% |
|
|
|
|
|
|
|
| India |
Sensex 30 |
26117.5 |
22986.1 |
23709.15 |
3.1% |
-9.2% |
| Indonesia |
Jakarta Composite |
4593.0 |
4714.4 |
4697.56 |
-0.4% |
2.3% |
| Malaysia |
KLCI |
1692.5 |
1643.7 |
1674.88 |
1.9% |
-1.0% |
| Philippines |
PSEi |
6952.1 |
6654.5 |
6792.06 |
2.1% |
-2.3% |
| Taiwan |
Taiex |
8338.1 |
8063.0 |
8325.04 |
3.2% |
-0.2% |
| Thailand |
SET |
1288.0 |
1276.5 |
1320.19 |
3.4% |
2.5% |
|
|
|
|
|
|
|
| Europe |
|
|
|
|
|
|
| UK |
FTSE 100 |
6242.3 |
5707.6 |
5950.23 |
4.3% |
-4.7% |
| France |
CAC |
4637.1 |
3995.1 |
4223.04 |
5.7% |
-8.9% |
| Germany |
XETRA DAX |
10743.0 |
8967.5 |
9388.05 |
4.7% |
-12.6% |
| Italy |
FTSE MIB |
21418.4 |
16514.9 |
16909.56 |
2.4% |
-21.1% |
| Spain |
IBEX 35 |
9544.2 |
7920.8 |
8194.20 |
3.5% |
-14.1% |
| Sweden |
OMX Stockholm 30 |
1446.8 |
1286.7 |
1355.95 |
5.4% |
-6.3% |
| Switzerland |
SMI |
8818.1 |
7656.6 |
7863.36 |
2.7% |
-10.8% |
|
|
|
|
|
|
|
| North America |
|
|
|
|
|
|
| United States |
Dow |
17425.0 |
15973.8 |
16391.99 |
2.6% |
-5.9% |
|
NASDAQ |
5007.4 |
4337.5 |
4504.43 |
3.8% |
-10.0% |
|
S&P 500 |
2043.9 |
1864.8 |
1917.78 |
2.8% |
-6.2% |
| Canada |
S&P/TSX Comp. |
13010.0 |
12381.2 |
12813.40 |
3.5% |
-1.5% |
| Mexico |
Bolsa |
42977.5 |
42416.4 |
43375.310 |
2.3% |
0.9% |
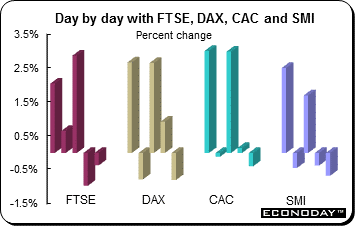 European markets ended Friday's session in the red as investors adopted a more cautious attitude toward risk. Crude oil prices retreated Friday as an agreement between Iran and Saudi Arabia on a production cut begins to look less likely. The weak performance of the Asian markets and the early struggles of the U.S. equity markets also contributed to the negative mood. However, for the week, the indexes advanced. The FTSE was up 4.3 percent, the CAC jumped 5.7 percent, the DAX added 4.7 percent and the SMI was 2.7 percent higher. Higher crude prices helped buoy equities. On Thursday, however, oil prices began to pare early gains after the U.S. EIA reported that weekly U.S. crude inventories increased. European markets ended Friday's session in the red as investors adopted a more cautious attitude toward risk. Crude oil prices retreated Friday as an agreement between Iran and Saudi Arabia on a production cut begins to look less likely. The weak performance of the Asian markets and the early struggles of the U.S. equity markets also contributed to the negative mood. However, for the week, the indexes advanced. The FTSE was up 4.3 percent, the CAC jumped 5.7 percent, the DAX added 4.7 percent and the SMI was 2.7 percent higher. Higher crude prices helped buoy equities. On Thursday, however, oil prices began to pare early gains after the U.S. EIA reported that weekly U.S. crude inventories increased.
According to the minutes of the January European Central Bank's monetary policy meeting, the euro area economic recovery was progressing, but downside risks had increased again this year mainly due to global concerns. The minutes said that downside risks had increased amid heightened uncertainty about the growth prospects of emerging market economies, volatility in financial markets and geopolitical risks. The ECB minutes said that inflation continued to be weaker than expected, mainly due to the renewed sharp decline in oil prices and persistently subdued underlying price pressures. Financial market conditions in the euro area had clearly deteriorated since the early December Governing Council meeting, although the magnitude and persistence of these developments were still uncertain. The minutes also said that there was unanimity in the Governing Council in seeking a review of the policy stance in March after a thorough analysis of data and also after receiving the latest ECB Staff macroeconomic projections.
Economic data released for the UK were all positive while data for Germany and the Eurozone disappointed. Both producer and consumer price index readings improved as did claimant and the ILO unemployment data. And retail sales were higher than anticipated. However, Germany's ZEW survey reading fell to its lowest since October 2014. Euro area flash consumer confidence also tumbled.
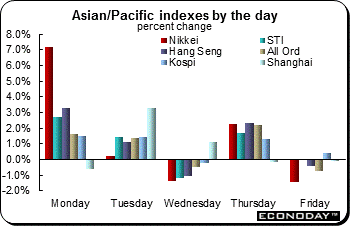 Even though equities ended the week on a sour note, all but the Jakarta Composite advanced. Equities were heavily influenced as usual by overnight U.S. market performance and the direction of crude oil prices. The advances were robust across the board. The Nikkei gained 6.8 percent on the week mostly due to a 7.2 percent jump on Monday. The Hang Seng followed with a 5.3 percent advance. Investors appeared to shun two dismal merchandise trade reports from China and Japan. Both exports and imports tumbled in January in both countries indicating weak domestic and global demand. Trade data were also weak for Taiwan and Korea, pointing to a significant deterioration in global trade and have only strengthened the case for more monetary easing. Even though equities ended the week on a sour note, all but the Jakarta Composite advanced. Equities were heavily influenced as usual by overnight U.S. market performance and the direction of crude oil prices. The advances were robust across the board. The Nikkei gained 6.8 percent on the week mostly due to a 7.2 percent jump on Monday. The Hang Seng followed with a 5.3 percent advance. Investors appeared to shun two dismal merchandise trade reports from China and Japan. Both exports and imports tumbled in January in both countries indicating weak domestic and global demand. Trade data were also weak for Taiwan and Korea, pointing to a significant deterioration in global trade and have only strengthened the case for more monetary easing.
The sharp gains came in part because markets have tumbled so much this year, prompting some investors to hunt for bargains. The buying came intermittently in recent days, and investors are still sitting on high levels of cash amid concerns over the global economy, ready to sell equities on signs of renewed volatility. Swings in oil prices remain a major determinant in market performance globally.
The Nikkei's advance came despite a preliminary GDP reading that indicated the economy was once again contacting. Fourth quarter GDP contracted 1.4 percent. The Nikkei's weekly increase was its best performance since the week ended October 31, 2014 when the Bank of Japan boosted the size of its asset purchase program. Investors are expecting still more stimulus from the BoJ in light of the very weak economic data this past week when it meets on March 15. Given the yen's recent strengthening despite the BoJ's decision late last month to introduce negative interest rates, investors are wary of the growing inability for central bank action to curb currency appreciation, boost inflation and lift equity markets.
The Hang Seng also posted a healthy gain on the week — up 5.3 percent — investors here also ignored the drop in Chinese exports and imports. The Shanghai Composite was up 3.5 percent following its week-long celebration of the Lunar New Year.
China's policy makers have accelerated measures to bolster the economy after the week's data showed a decline in exports and a pickup in inflation. In moves that could support lending after a record surge in new yuan loans last month, the PBoC loosened restrictions on what banks could pay on deposits and charge for loans, while the nation's cabinet has discussed lowering the minimum ratio of provisions that banks must set aside for bad loans. Even with this week's advance, the Shanghai Composite is the world's worst performer this year after Greek and Italian equities, plunging 19.2 percent.
The PBoC said it will conduct open market operations daily to influence the money supply, thus making permanent the practice of daily interventions established during the Chinese New Year holiday. Before January 19, the Bank engaged in open market operations twice a week.
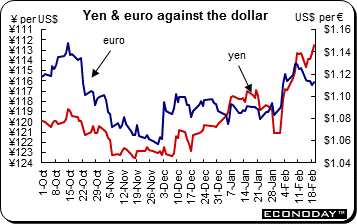 The U.S. dollar was up against the euro, pound sterling and Swiss franc but retreated against the yen and the commodity currencies — the Canadian and Australian dollars. The latter two currencies benefited from stabilizing commodity prices. The pound sterling, despite positive economic data, is retreating as financial markets begin to pay attention to the complex negotiations between the UK and the European Union. The result of these negotiations could determine whether the UK remains part of the European Union. Tough negotiations were ongoing at this writing. The U.S. dollar was up against the euro, pound sterling and Swiss franc but retreated against the yen and the commodity currencies — the Canadian and Australian dollars. The latter two currencies benefited from stabilizing commodity prices. The pound sterling, despite positive economic data, is retreating as financial markets begin to pay attention to the complex negotiations between the UK and the European Union. The result of these negotiations could determine whether the UK remains part of the European Union. Tough negotiations were ongoing at this writing.
A year and a half ago, China held as much as $4 trillion in foreign exchange reserves. Now, as China's economic growth continues to slow, that sign of national strength is ebbing. China's foreign exchange reserves are shrinking steadily as money flows out of the country and Beijing moves to shore up its currency. The country's reserves have shrunk by nearly a fifth since the summer of 2014 with more than a third of the shrinkage occurring in the last three months. By the end of January, reserves stood at $3.23 trillion, a level that has prompted speculation about how much lower Beijing will let them go. With a smaller pot of reserves, Chinese leaders have less room to maneuver should the economy undergo a sudden shock. The reserves situation also weakens China's control over the value of its currency, the renminbi. However, the reserves are still considerable, more than double Japan's, which has the world's second largest amount.
|
|
2015 |
2016 |
% Change |
|
|
Dec 31 |
Feb 12 |
Feb 19 |
Week |
2016 |
| U.S. $ per currency |
|
|
|
|
|
|
| Australia |
A$ |
0.7288 |
0.710 |
0.715 |
0.7% |
-1.9% |
| New Zealand |
NZ$ |
0.6833 |
0.662 |
0.664 |
0.2% |
-2.8% |
| Canada |
C$ |
0.7231 |
0.722 |
0.726 |
0.7% |
0.4% |
| Eurozone |
euro (€) |
1.0871 |
1.126 |
1.113 |
-1.1% |
2.4% |
| UK |
pound sterling (£) |
1.4742 |
1.451 |
1.436 |
-1.0% |
-2.6% |
|
|
|
|
|
|
|
| Currency per U.S. $ |
|
|
|
|
|
|
| China |
yuan |
6.4937 |
6.574 |
6.522 |
0.8% |
-0.4% |
| Hong Kong |
HK$* |
7.7501 |
7.789 |
7.773 |
0.2% |
-0.3% |
| India |
rupee |
66.1537 |
68.235 |
68.468 |
-0.3% |
-3.4% |
| Japan |
yen |
120.2068 |
113.320 |
112.620 |
0.6% |
6.7% |
| Malaysia |
ringgit |
4.2943 |
4.164 |
4.208 |
-1.0% |
2.1% |
| Singapore |
Singapore $ |
1.4179 |
1.398 |
1.405 |
-0.5% |
0.9% |
| South Korea |
won |
1175.0600 |
1211.540 |
1234.360 |
-1.8% |
-4.8% |
| Taiwan |
Taiwan $ |
32.8620 |
33.016 |
33.249 |
-0.7% |
-1.2% |
| Thailand |
baht |
36.0100 |
35.573 |
35.720 |
-0.4% |
0.8% |
| Switzerland |
Swiss franc |
1.0014 |
0.9763 |
0.9902 |
-1.4% |
1.1% |
| *Pegged to U.S. dollar |
|
|
|
|
|
|
| Source: Bloomberg |
|
|
|
|
|
|
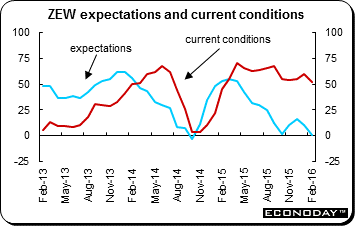 February ZEW current conditions index weighed in at 52.3, far beneath its 59.7 January print. This was its steepest decline since last October and its poorest level since February 2015. At the same time, expectations were pared to just 1.0, a 9.2 point drop from January and their worst reading since October 2014. Expectations have now declined in nine of the last 11 months. February ZEW current conditions index weighed in at 52.3, far beneath its 59.7 January print. This was its steepest decline since last October and its poorest level since February 2015. At the same time, expectations were pared to just 1.0, a 9.2 point drop from January and their worst reading since October 2014. Expectations have now declined in nine of the last 11 months.
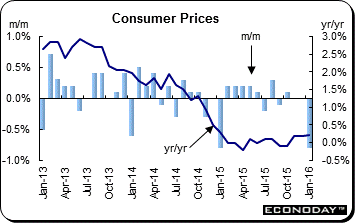 January consumer prices dropped a monthly 0.8 percent after a 0.1 percent increase in December. The annual inflation rate was a tick firmer at 0.3 percent, its highest reading since January 2015. The main upward pressure on the yearly rate came from motor fuels which fell 2.6 percent on the month after a 6.8 percent fall over the same period in 2015. Food & non-alcoholic drinks (down 0.6 percent after declining 1.0 percent) also provided a modest boost as did alcohol & tobacco (5.2 percent after 3.2 percent) and clothing & footwear (down 3.4 percent after declining 3.9 percent). The only significant negative impact came from air fares which declined 35.8 percent on the month compared with a much smaller 17.1 percent drop a year ago. Even so, the core CPI posted an annual gain of 1.2 percent, a 3-month low. January consumer prices dropped a monthly 0.8 percent after a 0.1 percent increase in December. The annual inflation rate was a tick firmer at 0.3 percent, its highest reading since January 2015. The main upward pressure on the yearly rate came from motor fuels which fell 2.6 percent on the month after a 6.8 percent fall over the same period in 2015. Food & non-alcoholic drinks (down 0.6 percent after declining 1.0 percent) also provided a modest boost as did alcohol & tobacco (5.2 percent after 3.2 percent) and clothing & footwear (down 3.4 percent after declining 3.9 percent). The only significant negative impact came from air fares which declined 35.8 percent on the month compared with a much smaller 17.1 percent drop a year ago. Even so, the core CPI posted an annual gain of 1.2 percent, a 3-month low.
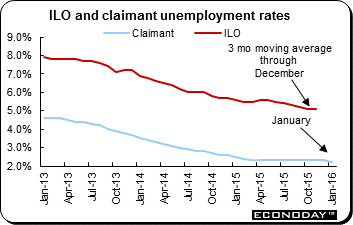 January claimant count unemployment dropped 14,800 after a much sharper revised 15,200 decline at year-end. As a result, the jobless rate dipped a tick to just 2.2 percent, its first decline since last February and matching its lowest mark since November 1974. On this measure the number of people out of work fell more than 32,000 over the last three months compared with a fourth quarter decline of 17,200 and a third quarter drop of just 5,100. The ILO data were slightly less robust with a 60,000 decrease in joblessness in the three months to December and only enough to leave the unemployment rate steady at 5.1 percent. Employment was up 205,000 over the period and at 74.1 percent, the employment rate was at a new record high. However wages remain subdued. Average earnings last quarter were up just 1.9 percent on the year. Moreover, single month growth in December was only 1.5 percent, the lowest since last February. Excluding bonus payments, the annual quarterly rise was 2.0 percent, up 0.1 percentage points from last time but still historically very soft. January claimant count unemployment dropped 14,800 after a much sharper revised 15,200 decline at year-end. As a result, the jobless rate dipped a tick to just 2.2 percent, its first decline since last February and matching its lowest mark since November 1974. On this measure the number of people out of work fell more than 32,000 over the last three months compared with a fourth quarter decline of 17,200 and a third quarter drop of just 5,100. The ILO data were slightly less robust with a 60,000 decrease in joblessness in the three months to December and only enough to leave the unemployment rate steady at 5.1 percent. Employment was up 205,000 over the period and at 74.1 percent, the employment rate was at a new record high. However wages remain subdued. Average earnings last quarter were up just 1.9 percent on the year. Moreover, single month growth in December was only 1.5 percent, the lowest since last February. Excluding bonus payments, the annual quarterly rise was 2.0 percent, up 0.1 percentage points from last time but still historically very soft.
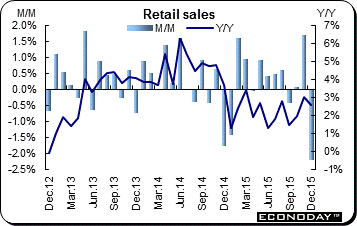
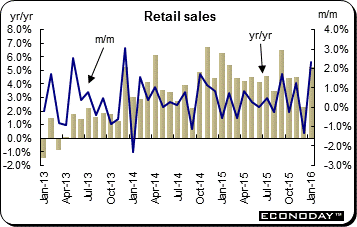 January retail sales rebounded 2.3 percent on the month after sinking 1.4 percent in December. It was the strongest increase in more than two years. As a result, annual sales growth climbed from 2.3 percent to 5.2 percent. Excluding auto fuel, purchases were just as robust and matched the monthly headline spurt for a yearly gain of 5.0 percent, up from 1.8 percent last time. January's surge was led by the non-food sector which, excluding auto fuel, registered a 3.6 percent monthly jump. However, this only served to offset an equivalent decline in December. Growth here was dominated by the other stores category which saw a rise of 8.1 percent. Elsewhere clothing & footwear (3.3 percent) similarly had a very good month (but only after a 6.1 percent plunge in December) and there were solid advances in non-store retailing (1.1 percent), non-specialized stores (0.9 percent) and household goods (0.4 percent). Food gained 1.1 percent and auto fuel 2.5 percent. January retail sales rebounded 2.3 percent on the month after sinking 1.4 percent in December. It was the strongest increase in more than two years. As a result, annual sales growth climbed from 2.3 percent to 5.2 percent. Excluding auto fuel, purchases were just as robust and matched the monthly headline spurt for a yearly gain of 5.0 percent, up from 1.8 percent last time. January's surge was led by the non-food sector which, excluding auto fuel, registered a 3.6 percent monthly jump. However, this only served to offset an equivalent decline in December. Growth here was dominated by the other stores category which saw a rise of 8.1 percent. Elsewhere clothing & footwear (3.3 percent) similarly had a very good month (but only after a 6.1 percent plunge in December) and there were solid advances in non-store retailing (1.1 percent), non-specialized stores (0.9 percent) and household goods (0.4 percent). Food gained 1.1 percent and auto fuel 2.5 percent.
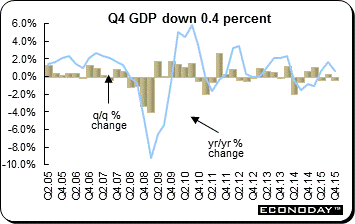 The Japanese economy continues to limp along. Fourth quarter gross domestic product retreated 0.3 percent on the quarter (down 1.4 percent annualized) according to the first estimate. From a year ago, GDP was up 0.7 percent. GDP has been bouncing around the zero mark over the last three quarters. Second quarter GDP was down 1.4 percent on an annualized basis while third quarter GDP was revised from an initial decline to an increase of 1.3 percent. On a quarterly basis, private demand was down 0.6 percent. Private consumption dropped 0.8 percent while consumption of households lost 0.9 percent. Private residential investment was down 1.2 percent but CAPEX was up 1.4 percent. The Japanese economy continues to limp along. Fourth quarter gross domestic product retreated 0.3 percent on the quarter (down 1.4 percent annualized) according to the first estimate. From a year ago, GDP was up 0.7 percent. GDP has been bouncing around the zero mark over the last three quarters. Second quarter GDP was down 1.4 percent on an annualized basis while third quarter GDP was revised from an initial decline to an increase of 1.3 percent. On a quarterly basis, private demand was down 0.6 percent. Private consumption dropped 0.8 percent while consumption of households lost 0.9 percent. Private residential investment was down 1.2 percent but CAPEX was up 1.4 percent.
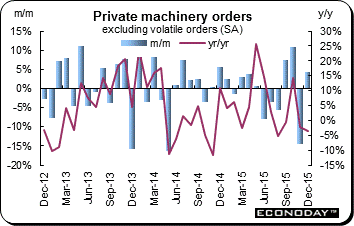 December core machine orders excluding volatile items jumped 4.2 percent on the month but were 3.5 percent lower on the year. Manufacturing orders retreated 3.4 percent on the month while nonmanufacturing orders added 8.5 percent. Volatile government orders soared 34.1 percent. However, overseas orders slid 3.1 percent. These data, though very volatile, are a popular proxy for capital expenditures. The total value of machinery orders received by the 280 manufacturers sampled was up 3.6 percent after decreasing 23.2 percent from the previous month on a seasonally adjusted basis. December core machine orders excluding volatile items jumped 4.2 percent on the month but were 3.5 percent lower on the year. Manufacturing orders retreated 3.4 percent on the month while nonmanufacturing orders added 8.5 percent. Volatile government orders soared 34.1 percent. However, overseas orders slid 3.1 percent. These data, though very volatile, are a popular proxy for capital expenditures. The total value of machinery orders received by the 280 manufacturers sampled was up 3.6 percent after decreasing 23.2 percent from the previous month on a seasonally adjusted basis.
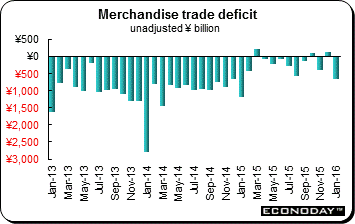 January merchandise trade deficit was ¥645.9 billion. This was far off the mark to put it mildly of expectations for a surplus of ¥680.2 billion. On the year, both exports and imports tumbled at their fastest pace since 2009. Exports were down 12.9 percent from a year ago while imports were 18.0 percent lower. Exports were down for the fourth consecutive month while imports dropped for the 13th consecutive month. Exports to all major markets declined on the year. Exports to the U.S. were down 5.3 percent. Exports to the EU slid 3.6 percent. And exports to Asia plummeted 17.8 percent with those to China, 17.5 percent lower. On a seasonally adjusted basis, the January trade surplus was ¥119.4 billion. Exports were up 0.6 percent on the month but down 10.8 percent from a year ago. Imports slid 1.1 percent and 16.5 percent. January merchandise trade deficit was ¥645.9 billion. This was far off the mark to put it mildly of expectations for a surplus of ¥680.2 billion. On the year, both exports and imports tumbled at their fastest pace since 2009. Exports were down 12.9 percent from a year ago while imports were 18.0 percent lower. Exports were down for the fourth consecutive month while imports dropped for the 13th consecutive month. Exports to all major markets declined on the year. Exports to the U.S. were down 5.3 percent. Exports to the EU slid 3.6 percent. And exports to Asia plummeted 17.8 percent with those to China, 17.5 percent lower. On a seasonally adjusted basis, the January trade surplus was ¥119.4 billion. Exports were up 0.6 percent on the month but down 10.8 percent from a year ago. Imports slid 1.1 percent and 16.5 percent.
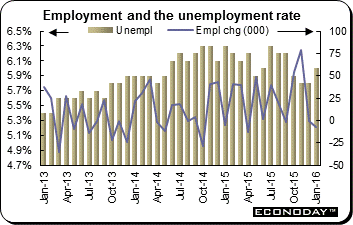 January employment was down 7,900. At the same time, the unemployment rate increased to 6.0 percent from 5.8 percent the month before. The number of unemployed increased 30,200. The Australian Bureau of Statistics attributed the increase in unemployment to new members in the sample. The labour force participation rate was unchanged at 65.2 percent. January employment was down 7,900. At the same time, the unemployment rate increased to 6.0 percent from 5.8 percent the month before. The number of unemployed increased 30,200. The Australian Bureau of Statistics attributed the increase in unemployment to new members in the sample. The labour force participation rate was unchanged at 65.2 percent.
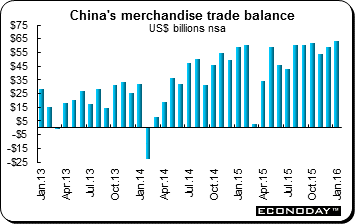 January merchandise trade surplus grew to Rmb406.2 billion from Rmb382.1 billion in December. In dollar terms, China's trade surplus rose to $63.3 billion from $60.09 in December. Both exports and imports declined in both renminbi and dollar-denominated terms. In renminbi terms, exports dropped 6.6 percent from a year ago following a 2.3 percent gain in December. It was the biggest fall in exports since an 8.9 percent drop in July last year. The drop was even more pronounced measured in U.S. dollars, with exports crashing 11.2 percent on the year against expectations of a 2.2 percent slide after declining 1.4 percent in December. It was the biggest drop since a 15 percent decline in March last year. The import side of the equation fared worse in both renminbi and dollar-terms. Shipments to China plunged 14.4 percent on the year. That compares with a 4.0 percent drop last time. In dollar terms, imports plunged 18.8 percent compared with a 7.6 percent drop in December. This was the biggest monthly drop in imports since last September and also means shipments have contracted on the year for the past 15 months straight. January merchandise trade surplus grew to Rmb406.2 billion from Rmb382.1 billion in December. In dollar terms, China's trade surplus rose to $63.3 billion from $60.09 in December. Both exports and imports declined in both renminbi and dollar-denominated terms. In renminbi terms, exports dropped 6.6 percent from a year ago following a 2.3 percent gain in December. It was the biggest fall in exports since an 8.9 percent drop in July last year. The drop was even more pronounced measured in U.S. dollars, with exports crashing 11.2 percent on the year against expectations of a 2.2 percent slide after declining 1.4 percent in December. It was the biggest drop since a 15 percent decline in March last year. The import side of the equation fared worse in both renminbi and dollar-terms. Shipments to China plunged 14.4 percent on the year. That compares with a 4.0 percent drop last time. In dollar terms, imports plunged 18.8 percent compared with a 7.6 percent drop in December. This was the biggest monthly drop in imports since last September and also means shipments have contracted on the year for the past 15 months straight.
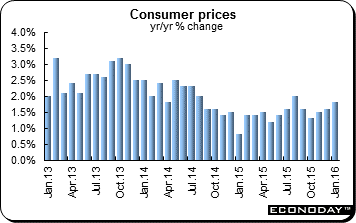 January consumer prices were up 1.8 percent from a year ago, an encouraging sign for China. However, the CPI continues to trail Beijing's target of "around 3 percent". On the month, the CPI was up 0.5 percent for a second month. The urban CPI was up 1.8 percent on the year while the rural index was up 1.5 percent for a second month. Food prices were up 4.1 percent on the year after increasing 2.7 percent in December. Non-food CPI was up 1.2 percent after 1.1 percent. However, transportation & communication prices were down 1.6 percent after declining 1.3 percent in December. January consumer prices were up 1.8 percent from a year ago, an encouraging sign for China. However, the CPI continues to trail Beijing's target of "around 3 percent". On the month, the CPI was up 0.5 percent for a second month. The urban CPI was up 1.8 percent on the year while the rural index was up 1.5 percent for a second month. Food prices were up 4.1 percent on the year after increasing 2.7 percent in December. Non-food CPI was up 1.2 percent after 1.1 percent. However, transportation & communication prices were down 1.6 percent after declining 1.3 percent in December.
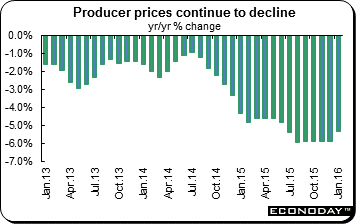 Producer prices, which are often regarded as a proxy for medium-term inflation, remained in negative territory, but the pace of decline improved. The PPI was down 5.3 percent on the year, moderating from December's decline of 5.9 percent. PPI has remained in negative territory since March 2012, reaching a low of 5.9 percent for the five consecutive months since August 2015. On the month the PPI declined 0.5 percent after dropping 0.7 percent in December. Producer prices, which are often regarded as a proxy for medium-term inflation, remained in negative territory, but the pace of decline improved. The PPI was down 5.3 percent on the year, moderating from December's decline of 5.9 percent. PPI has remained in negative territory since March 2012, reaching a low of 5.9 percent for the five consecutive months since August 2015. On the month the PPI declined 0.5 percent after dropping 0.7 percent in December.
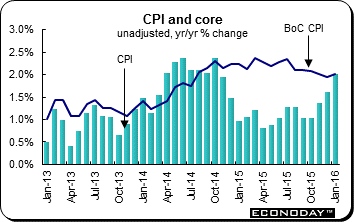 January consumer price index was up 0.2 percent and 2.0 percent from a year ago. Core prices similarly picked up. Excluding food & energy the CPI also climbed 0.2 percent on the month to stand 1.8 percent higher than in January 2015 after a 1.7 percent annual increase last time. Meanwhile, the BoC's underlying gauge rose 0.3 percent on the month for a 2.0 percent yearly advance. The seasonally adjusted CPI was 0.2 percent firmer than in December when it edged 0.1 percent higher. Both core indexes matched this gain. Within the adjusted basket, the main upward pressure came from alcohol & tobacco (0.7 percent), food (0.6 percent) and recreation, education & reading (0.5 percent). However, increases here were partially offset by declines in transportation (0.8 percent) and clothing & footwear (0.4 percent). January consumer price index was up 0.2 percent and 2.0 percent from a year ago. Core prices similarly picked up. Excluding food & energy the CPI also climbed 0.2 percent on the month to stand 1.8 percent higher than in January 2015 after a 1.7 percent annual increase last time. Meanwhile, the BoC's underlying gauge rose 0.3 percent on the month for a 2.0 percent yearly advance. The seasonally adjusted CPI was 0.2 percent firmer than in December when it edged 0.1 percent higher. Both core indexes matched this gain. Within the adjusted basket, the main upward pressure came from alcohol & tobacco (0.7 percent), food (0.6 percent) and recreation, education & reading (0.5 percent). However, increases here were partially offset by declines in transportation (0.8 percent) and clothing & footwear (0.4 percent).
 December retail sales dropped a monthly 2.2 percent. The decline easily more than reversed an unrevised 1.7 percent increase in November and, despite strongly positive base effects, annual growth of purchases dropped from 3.0 percent to 2.6 percent. Prices were marginally firmer so the decrease in cash sales was more than matched by volumes which plunged 2.3 percent from November. What was the sharpest monthly decline in nominal demand since April 2010 may have been influenced by late snowfalls and unseasonably warm weather. However, ten of the eleven subsectors retreated. The largest decrease occurred in motor vehicles & parts (3.9 percent) but even without this subsector purchases were still down 1.6 percent. Elsewhere, food & drink dropped 1.2 percent, clothing & accessories 3.6 percent and electronics & appliances 3.0 percent. Gasoline was down 1.1 percent, miscellaneous stores 1.2 percent and general merchandise 2.2 percent. The only increase was posted by furniture & home furnishings (0.5 percent). December retail sales dropped a monthly 2.2 percent. The decline easily more than reversed an unrevised 1.7 percent increase in November and, despite strongly positive base effects, annual growth of purchases dropped from 3.0 percent to 2.6 percent. Prices were marginally firmer so the decrease in cash sales was more than matched by volumes which plunged 2.3 percent from November. What was the sharpest monthly decline in nominal demand since April 2010 may have been influenced by late snowfalls and unseasonably warm weather. However, ten of the eleven subsectors retreated. The largest decrease occurred in motor vehicles & parts (3.9 percent) but even without this subsector purchases were still down 1.6 percent. Elsewhere, food & drink dropped 1.2 percent, clothing & accessories 3.6 percent and electronics & appliances 3.0 percent. Gasoline was down 1.1 percent, miscellaneous stores 1.2 percent and general merchandise 2.2 percent. The only increase was posted by furniture & home furnishings (0.5 percent).
Most equity indexes rebounded from the previous week's losses. Oil showed signs of stabilizing amid talk that OPEC and other oil producers might act to curb production. UK data were positive while German and Eurozone data were not. Most Japanese data disappointed with the exception of the very volatile machine orders data. China's data were mixed with both exports and imports sinking. Australian labour force data also disappointed with employment declining and the jobless rate increasing.
Investors will get a reading on the health of the manufacturing sector with the flash manufacturing PMIs for February. The UK posts its second estimate of gross domestic product along with Germany and France. G20 meeting of finance ministers and central bank governors will meet in Shanghai on February 26.
| The following indicators will be released this week... |
| Europe |
|
|
| February 22 |
Eurozone |
PMI Manufacturing, Services & Composite (February, flash) |
|
Germany |
PMI Manufacturing, Services & Composite (February, flash) |
|
France |
PMI Manufacturing, Services & Composite (February, flash) |
| February 23 |
Germany |
Gross Domestic Product (Q4.2015 final) |
|
|
Ifo Survey (February) |
| February 25 |
Eurozone |
M3 Money Supply (January) |
|
|
Harmonized Index of Consumer Prices (January final) |
|
UK |
Gross Domestic Product (Q4.2015 second estimate) |
| February 26 |
Eurozone |
EC Business and Consumer Survey (February) |
|
France |
Gross Domestic Product (Q4.2015 second estimate) |
|
|
Consumption of Manufactured Goods (January) |
| |
|
|
| Asia/Pacific |
|
|
| February 22 |
Japan |
PMI Manufacturing (February flash) |
| February 26 |
Japan |
Consumer Price Index (January) |
Anne D Picker is the author of International Economic Indicators and Central Banks.
|
