|
Squawking pessimism can't drown out what is a very respectable start to 2016. Economic data so far this year, apart from predictions of deflation and negative interest rates, could justify what was scheduled to be, but what soon seemed impossible, a rate hike at the March FOMC. Yes, global factors are a risk and are hurting the factory sector but service prices are definitely on the climb and vehicle prices and vehicle production, reflecting strength in domestic demand, are back up. Ignore the cacophony of doubt and look at the economic data for yourself!
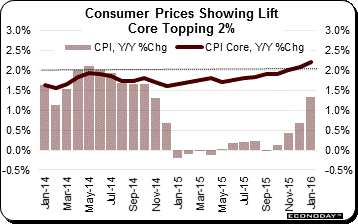 Consumer prices are on the rise and the Fed's December rate hike doesn't look misplaced at all. Year-on-year core prices rose 1 tenth to plus 2.2 percent for the highest rate in more than 3-1/2 years. This rate, as tracked in the line of the accompanying graph, is breaching the 2 percent policy line which is something, of course, that isn't going unnoticed at the Fed. Core prices have been on the up-slope since last spring and offer policy makers convincing justification to withdraw stimulus. The Bureau of Labor Statistics, which compiles the CPI report, went out of its way to cite a "lack of declines" across January's core readings. And the gain for the monthly core, at plus 0.3 percent, is the strongest since, get this, all the way back in 2006. Consumer prices are on the rise and the Fed's December rate hike doesn't look misplaced at all. Year-on-year core prices rose 1 tenth to plus 2.2 percent for the highest rate in more than 3-1/2 years. This rate, as tracked in the line of the accompanying graph, is breaching the 2 percent policy line which is something, of course, that isn't going unnoticed at the Fed. Core prices have been on the up-slope since last spring and offer policy makers convincing justification to withdraw stimulus. The Bureau of Labor Statistics, which compiles the CPI report, went out of its way to cite a "lack of declines" across January's core readings. And the gain for the monthly core, at plus 0.3 percent, is the strongest since, get this, all the way back in 2006.
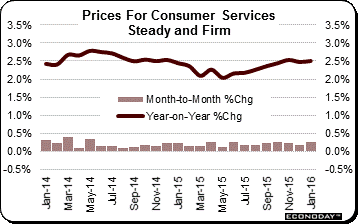 Services are the center of the economy's strength and, fittingly, also the center of the emerging price pressure. Prices for services are tracking at a year-on-year 2.5 percent with January's monthly rise at a solid 0.3 percent. Medical care jumped 0.5 percent in the month for a year-on-year plus 3.0 percent with the subcomponent for prescription drugs also up a monthly 0.5 percent. Shelter rose 0.3 percent in the month as did the subcomponent for rent while owner's equivalent rent, which offers a subjective reading on home prices, rose 0.2 percent. Hotel prices jumped a full 2.0 percent while airfares were especially hot, up 1.2 percent. Goods prices also show pressure with apparel up a very sharp 0.6 percent in the month and new vehicles up 0.3 percent. When including energy, however, where prices extended their long decline and when also including food which was flat, total consumer prices were unchanged in the month. Despite the drag from energy, the year-on-year rate for total prices literally surged, up 7 tenths to plus 1.4 percent. Services are the center of the economy's strength and, fittingly, also the center of the emerging price pressure. Prices for services are tracking at a year-on-year 2.5 percent with January's monthly rise at a solid 0.3 percent. Medical care jumped 0.5 percent in the month for a year-on-year plus 3.0 percent with the subcomponent for prescription drugs also up a monthly 0.5 percent. Shelter rose 0.3 percent in the month as did the subcomponent for rent while owner's equivalent rent, which offers a subjective reading on home prices, rose 0.2 percent. Hotel prices jumped a full 2.0 percent while airfares were especially hot, up 1.2 percent. Goods prices also show pressure with apparel up a very sharp 0.6 percent in the month and new vehicles up 0.3 percent. When including energy, however, where prices extended their long decline and when also including food which was flat, total consumer prices were unchanged in the month. Despite the drag from energy, the year-on-year rate for total prices literally surged, up 7 tenths to plus 1.4 percent.
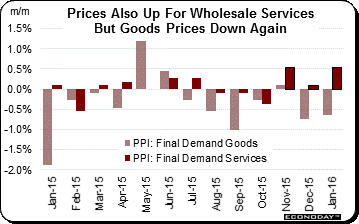 Service prices are also the highlight of the week's other inflation data, the producer price report. Service prices make up about 60 percent of the PPI report and jumped, as seen in the dark column of the graph, an impressive 0.5 percent in January for the third straight increase. Services got a boost from machinery and equipment wholesaling in gains that may be hinting at emerging strength for the capital goods sector. But goods, however, as seen in the light columns of the graph, continue their downdraft. Here, energy is once again the center of weakness, down 5.0 percent in the month with gasoline down 15.7 percent. But it's the service sector that's at the center of the economy's strength and the week's price reports are definitely bad news for all the pessimists out there, even the most hard boiled who, despite however hard they look, won't be able to find much deflation. Simply enough, the data clearly point to acceleration for the Fed's favored inflation reading: core PCE prices which will be released with the personal income & outlays report on Friday, February 26. Service prices are also the highlight of the week's other inflation data, the producer price report. Service prices make up about 60 percent of the PPI report and jumped, as seen in the dark column of the graph, an impressive 0.5 percent in January for the third straight increase. Services got a boost from machinery and equipment wholesaling in gains that may be hinting at emerging strength for the capital goods sector. But goods, however, as seen in the light columns of the graph, continue their downdraft. Here, energy is once again the center of weakness, down 5.0 percent in the month with gasoline down 15.7 percent. But it's the service sector that's at the center of the economy's strength and the week's price reports are definitely bad news for all the pessimists out there, even the most hard boiled who, despite however hard they look, won't be able to find much deflation. Simply enough, the data clearly point to acceleration for the Fed's favored inflation reading: core PCE prices which will be released with the personal income & outlays report on Friday, February 26.
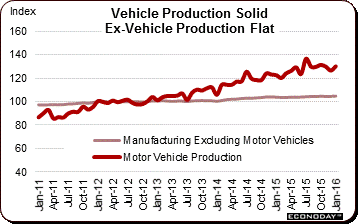 And the good news doesn't stop with prices as a sharp gain in motor vehicle production underpinned a very strong industrial production report where the headline rose a far stronger-than-expected 0.9 percent in January. Vehicle production, which has long been outperforming other areas of the factory sector, surged 2.8 percent in the month and drove the manufacturing component up by a very solid and very welcome 0.5 percent. Year-on-year, vehicle production is at the top of the heap with a 6.2 percent gain. And manufacturing in January also received rare support from capital goods which gained 0.3 percent in the month in yet another positive sign from this hard-hit sector. Year-on-year, manufacturing production is up 1.2 percent which doesn't sound like much but compares with negative readings throughout a host of other factory readings (as we will see later in this report). The surprise strength in industrial production, boosted by vehicles and underscoring January's solid rebound in retail auto sales, points to a healthy first-quarter performance for the economy (naysayers take note!). And the good news doesn't stop with prices as a sharp gain in motor vehicle production underpinned a very strong industrial production report where the headline rose a far stronger-than-expected 0.9 percent in January. Vehicle production, which has long been outperforming other areas of the factory sector, surged 2.8 percent in the month and drove the manufacturing component up by a very solid and very welcome 0.5 percent. Year-on-year, vehicle production is at the top of the heap with a 6.2 percent gain. And manufacturing in January also received rare support from capital goods which gained 0.3 percent in the month in yet another positive sign from this hard-hit sector. Year-on-year, manufacturing production is up 1.2 percent which doesn't sound like much but compares with negative readings throughout a host of other factory readings (as we will see later in this report). The surprise strength in industrial production, boosted by vehicles and underscoring January's solid rebound in retail auto sales, points to a healthy first-quarter performance for the economy (naysayers take note!).
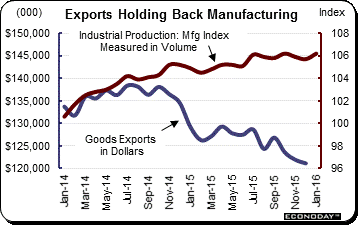 Here we shift gears a little and highlight the weakness of the economy — exports. Export prices in the producer price report did rise 0.1 percent in January but the year-on-year rate continues to hold in the negative column, at minus 2.5 percent. Exports have been a major factor holding down the factory sector as seen in the graph which compares the manufacturing component of the industrial production report against total goods exports. Goods exports started their decline back in late 2014, reflecting emerging weakness in global demand and the negative effects of the strong dollar which make our exports more expensive for foreign buyers. Goods exports have been especially weak for capital goods in a trend that points to lack of confidence in the outlook among our trading partners and lack of investment in global productivity. Exports will be updated in the international trade in goods report which will be a highlight of the coming week's data, posted along with personal income and outlays on the 26th. Here we shift gears a little and highlight the weakness of the economy — exports. Export prices in the producer price report did rise 0.1 percent in January but the year-on-year rate continues to hold in the negative column, at minus 2.5 percent. Exports have been a major factor holding down the factory sector as seen in the graph which compares the manufacturing component of the industrial production report against total goods exports. Goods exports started their decline back in late 2014, reflecting emerging weakness in global demand and the negative effects of the strong dollar which make our exports more expensive for foreign buyers. Goods exports have been especially weak for capital goods in a trend that points to lack of confidence in the outlook among our trading partners and lack of investment in global productivity. Exports will be updated in the international trade in goods report which will be a highlight of the coming week's data, posted along with personal income and outlays on the 26th.
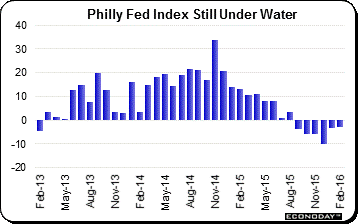 Not a highlight of the past week's data, unfortunately, was the Philly Fed report where the general business conditions index, getting little help from exports, came in at an index reading of minus 2.8 in February to extend a long run of negative readings. New orders, at minus 5.3, have also been stuck in the minus column as have unfilled orders, at minus 12.7. Shipments, at plus 2.5, were positive for a second straight month but just barely and aren't likely to hold above zero for very long given the weakness in orders. Employment posted a second straight month of contraction as did the workweek. And manufacturers in the region continue to draw down inventories to betray sagging expectations while the six-month outlook fell nearly 2 points to 17.3 which is still in the plus column but very low for this reading. Price data continue to hold in the negative column. The Mid-Atlantic, which is tracked by the Philly Fed, is only one region of the economy but not the only one where the factory sector is having trouble. Not a highlight of the past week's data, unfortunately, was the Philly Fed report where the general business conditions index, getting little help from exports, came in at an index reading of minus 2.8 in February to extend a long run of negative readings. New orders, at minus 5.3, have also been stuck in the minus column as have unfilled orders, at minus 12.7. Shipments, at plus 2.5, were positive for a second straight month but just barely and aren't likely to hold above zero for very long given the weakness in orders. Employment posted a second straight month of contraction as did the workweek. And manufacturers in the region continue to draw down inventories to betray sagging expectations while the six-month outlook fell nearly 2 points to 17.3 which is still in the plus column but very low for this reading. Price data continue to hold in the negative column. The Mid-Atlantic, which is tracked by the Philly Fed, is only one region of the economy but not the only one where the factory sector is having trouble.
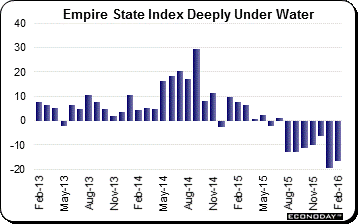 The Empire State index, which tracks New York's manufacturing region, is also in contraction and more severely at minus 16.64 in February. As seen in the graph, this is the seventh straight negative reading for this index. New orders, at minus 11.63, are in contraction for a ninth month in a row while employment, though improving to minus 0.99 from minus 13.00, is in contraction for an eighth month in a row. Shipments are in contraction, unfilled orders are in contraction, the workweek is contraction, selling prices are in contraction and the list goes on. Both this report and the Philly Fed report, though regional, belie the strength of the industrial production report and, get your ear plugs out, give the doom and gloomers something to harp on. The Empire State index, which tracks New York's manufacturing region, is also in contraction and more severely at minus 16.64 in February. As seen in the graph, this is the seventh straight negative reading for this index. New orders, at minus 11.63, are in contraction for a ninth month in a row while employment, though improving to minus 0.99 from minus 13.00, is in contraction for an eighth month in a row. Shipments are in contraction, unfilled orders are in contraction, the workweek is contraction, selling prices are in contraction and the list goes on. Both this report and the Philly Fed report, though regional, belie the strength of the industrial production report and, get your ear plugs out, give the doom and gloomers something to harp on.
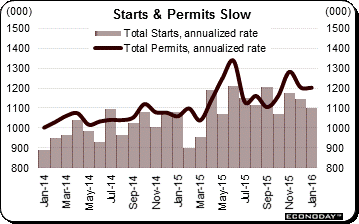 But the industrial production report does offer hope as have most readings on the housing sector which, at times at least, has seemed poised to take a leadership role in the economy. But not so fast. Housing starts and permits proved softer-than-expected in January, down 3.8 percent to an annualized rate of 1.099 million for starts with permits down fractionally to 1.202 million. Starts show roughly equal weakness between single-family homes, down 3.9 percent to a 731,000 rate, and multi-family homes, down 3.7 percent to 368,000. Permits for single-family homes fell 1.6 percent in the month but multi-family permits, in the strongest reading of the report, did rise 2.1 percent to 482,000. Multi-family homes remain the center of strength for the housing sector with year-on-year permits up 19.9 percent, surpassing a very solid 9.6 percent gain for single-family homes. But starts are lagging far behind, at a year-on-year plus 1.8 percent overall and reflecting supply constraints in the construction sector, including for labor, as well as January's heavy weather that hit the East Coast at mid-month. The housing sector is definitely not on fire but price trends are favorable as are permit trends. But the industrial production report does offer hope as have most readings on the housing sector which, at times at least, has seemed poised to take a leadership role in the economy. But not so fast. Housing starts and permits proved softer-than-expected in January, down 3.8 percent to an annualized rate of 1.099 million for starts with permits down fractionally to 1.202 million. Starts show roughly equal weakness between single-family homes, down 3.9 percent to a 731,000 rate, and multi-family homes, down 3.7 percent to 368,000. Permits for single-family homes fell 1.6 percent in the month but multi-family permits, in the strongest reading of the report, did rise 2.1 percent to 482,000. Multi-family homes remain the center of strength for the housing sector with year-on-year permits up 19.9 percent, surpassing a very solid 9.6 percent gain for single-family homes. But starts are lagging far behind, at a year-on-year plus 1.8 percent overall and reflecting supply constraints in the construction sector, including for labor, as well as January's heavy weather that hit the East Coast at mid-month. The housing sector is definitely not on fire but price trends are favorable as are permit trends.
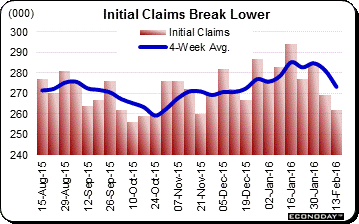 Saving the best for last we turn to what, along with the consumer price report, is the most favorable news of the week. Initial jobless claims fell 7,000 to 262,000 for the February 13 week — which was also the sample week for the February employment report (to be released at the beginning of March). This is the lowest level since November and, more immediately for expectations on the monthly employment report, is down a very sizable 32,000 from the January 16 week which was the sample week for the January employment report. The 4-week average fell to 273,250 for a sizable 8,000 decline from the prior week and for a 12,000 decline from January's sample week. These comparisons point squarely at significant improvement for the February employment report. And January's payroll growth of 151,000 really wasn't all that bad and other readings in that report, including a downtick in the unemployment to 4.9 percent and an uptick in the labor participation rate, showed outright strength. A similar employment report for February — let alone one that shows improvement — could make a March rate hike seem almost perhaps inevitable. Saving the best for last we turn to what, along with the consumer price report, is the most favorable news of the week. Initial jobless claims fell 7,000 to 262,000 for the February 13 week — which was also the sample week for the February employment report (to be released at the beginning of March). This is the lowest level since November and, more immediately for expectations on the monthly employment report, is down a very sizable 32,000 from the January 16 week which was the sample week for the January employment report. The 4-week average fell to 273,250 for a sizable 8,000 decline from the prior week and for a 12,000 decline from January's sample week. These comparisons point squarely at significant improvement for the February employment report. And January's payroll growth of 151,000 really wasn't all that bad and other readings in that report, including a downtick in the unemployment to 4.9 percent and an uptick in the labor participation rate, showed outright strength. A similar employment report for February — let alone one that shows improvement — could make a March rate hike seem almost perhaps inevitable.
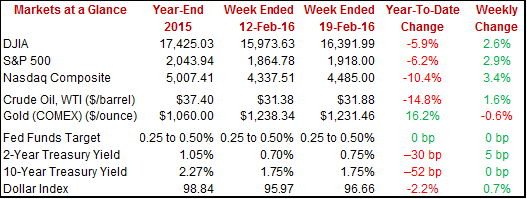
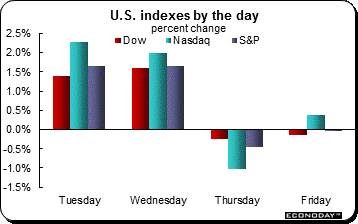 Markets showed very little reaction to Friday's consumer price data which, however, should support what are still the Fed's stated plans for a series of incremental rate hikes this year. Should these hikes begin, Treasury rates, which have fallen very sharply so far this year, would appear certain to climb higher. The 10-year yield was unchanged on the week at 1.75 percent though the 2-year yield did rise, up 5 basis points to 0.75 percent. Still, the 2-year yield is down an unlikely 30 basis points so far this year. And the CPI failed to roll back the stock market which ended Friday little changed and with big gains on the week, at 2.6 percent for the Dow at 16,391. A rise in Fed policy rates wouldn't likely be a plus for the stock market though higher rates would underscore the Fed's confidence in the economy which by extension could boost expectations for corporate profits. Oil, boosted by talk of an OPEC production cut, ended near $32 for a 1.6 percent weekly gain while gold edged lower near $1,230. Markets showed very little reaction to Friday's consumer price data which, however, should support what are still the Fed's stated plans for a series of incremental rate hikes this year. Should these hikes begin, Treasury rates, which have fallen very sharply so far this year, would appear certain to climb higher. The 10-year yield was unchanged on the week at 1.75 percent though the 2-year yield did rise, up 5 basis points to 0.75 percent. Still, the 2-year yield is down an unlikely 30 basis points so far this year. And the CPI failed to roll back the stock market which ended Friday little changed and with big gains on the week, at 2.6 percent for the Dow at 16,391. A rise in Fed policy rates wouldn't likely be a plus for the stock market though higher rates would underscore the Fed's confidence in the economy which by extension could boost expectations for corporate profits. Oil, boosted by talk of an OPEC production cut, ended near $32 for a 1.6 percent weekly gain while gold edged lower near $1,230.
Minutes from the January FOMC highlighted the risks from soft global demand and market volatility, pointing to a wait-and-see Fed which, however, if it sees a strong employment report for February and continued lift in prices could very well resurrect a rate hike at next month's policy meeting. The pundits of pessimism may be pecking and scratching but the story of this year's economy, at least so, isn't so bad after all.
Core PCE prices on Friday will be the week's highlight and if they show pressure as expected, expectations for a March FOMC rate hike could be back on the table. Key data will begin rolling out on Tuesday with consumer confidence which has been getting a boost from both a strong jobs market and from home-price appreciation. Home prices will be updated on Tuesday with the Case-Shiller report and then again on Thursday with the FHFA report, both of which are expected to show welcome pressure. Home sales will also be a highlight of the week with existing home sales on Tuesday followed on Wednesday by new home sales with both of these reports expected to show respectable results. Durable goods orders follow on Thursday and, despite weak global markets, are also expected to respectable results. PCE prices will be released with the personal income and outlays report where, once again, strength is expected including for consumer spending which is getting a telling lift from rising vehicle sales.
The February manufacturing PMI flash is expected to hold steady, at a consensus 52.5 vs a final January reading of 52.4 and a January flash of 52.7. Back in January, new orders, boosted by domestic demand, picked up steam as did production and selling prices. But employment slowed while inventories fell slightly, both signs of weakness. Note that this report runs hot compared to other manufacturing reports.
Manufacturing PMI, Flash - Consensus Forecast for February: 52.5
Range: 51.8 to 53.7
Homes on the market are scarce which has been helping home prices where year-on-year appreciation is approaching 6 percent. The Case-Shiller adjusted 20-city index is expected to show a year-on-year rate of 5.9 percent in the December report for a 1 tenth gain with the month-on-month adjusted rate at a very strong plus 0.8 percent. Home prices aren't quite booming but they are well ahead of wages and a key source of increasing household wealth. Note that FHFA house price data will be released later in the week on Thursday morning.
Case-Shiller, 20-City Adj. Index, M/M Chg - Consensus Forecast for December: +0.8%
Range: +0.7% to +1.2%
Case-Shiller, 20-City Unadj. Index, M/M Chg - Consensus Forecast for December: +0.2%
Range: +0.1% to +0.4%
Case-Shiller, 20-City Unadj. Index, Y/Y Chg - Consensus Forecast for December: +5.9%
Range: +5.7% to +6.2%
Despite this year's stock market losses and talk of global recession, consumer spirits have been surprisingly steady. But the consumer confidence index is expected to edge lower in the February report with the Econoday consensus at 97.2 vs 98.1 in January. Earlier readings this month from the consumer sentiment and consumer comfort reports softened but only slightly. Note that assessments of the jobs market in the consumer confidence report are always very closely watched as leading gauges for the monthly employment report.
Consumer Confidence Index - Consensus Forecast for February: 97.2
Range: 95.0 to 100.5
Existing home sales have been volatile month-to-month but when averaged out, have been slowing. The Econoday consensus is a 5.32 million annualized rate in January vs an outsized 5.46 million rate in December that was skewed higher by new lending rules which pulled sales out of November. Lack of homes on the market has been holding down sales but has also been supporting prices where the median was up a year-on-year 7.6 percent in the December report.
Existing Home Sales, Annualized Rate - Consensus Forecast for January: 5.320 million
Range: 5.130 to 5.555 million
The Empire State and Philly Fed reports have been showing decisive weakness but the Richmond Fed's manufacturing index, in contrast, has been holding steady. The Econoday consensus is calling for no change in February at an index reading of 2. New orders and backlog orders have been holding in the plus column for this report.
Richmond Fed Manufacturing Index - Consensus Forecast for January: +2
Range: -1 to +3
Lack of optimism in the business outlook and weakness in the energy sector have been pulling down growth in the services PMI. Growth in new orders slowed to a 12-month low in the January report with backlog orders posting a sixth straight month of contraction. The Econoday consensus for the February flash is 53.7 in what would be a 5 tenths decrease from final January's 53.2 and no change from the January flash. Employment has been solid in this report but the weakness in orders does point to less hiring ahead.
Services PMI - Consensus Forecast for February, Flash: 53.7
Range: 52.8 to 54.0
Samples are small and monthly data swing wildly but new home sales did surge going into year-end. The gains, however, were likely driven by discounting as the median price fell to a year-on-year minus 4.3 percent in December. Econoday forecasters are calling for slowing in January, to a 520,000 annualized rate vs December's outsized 544,000 that was, in the latest example of volatility, more than 40,000 over consensus.
New Home Sales, Annualized Rate - Consensus Forecast for January: 520,000
Range: 505,000 to 550,000
Indications on the factory sector have been weak but not the manufacturing component of the industrial production report where renewed strength in vehicles made for a rare gain in January. Durable goods orders for February are likewise expected to show rare strength, at least for the headline level where a 2.0 percent gain is expected. Ex-transportation orders, however, are seen unchanged. This report simply fizzled into year end with broad declines including for capital goods where weakness, tied to weak global demand and weak energy-related demand, points to lack of confidence in the outlook.
Durable Goods Orders, M/M Chg - Consensus Forecast for January: +2.0%
Range: +0.2% to +5.3%
Durable Goods Orders, Ex-Transportation, M/M Chg - Consensus for January: 0.0%
Range: -1.2% to +1.5%
The February 13 week, which was the sample week for the monthly employment report, proved pivotal for initial jobless claims which fell sizably to 262,000 for the lowest reading since November. The month-to-month comparison with the January sample week points to significant improvement for the February employment report. This will definitely upstage data for the February 20 week where the Econoday consensus is calling for a rise back to 270,000. But this week's report will include lagging data for continuing claims that will also track the February 13 week.
Initial Jobless Claims - Consensus Forecast for February 20 week: 270,000
Range: 265,000 to 284,000
Home-price appreciation may not be booming but has been respectable, roughly around 6.0 percent year-on-year for most readings including the FHFA house price index where the prior report came in at 5.9 percent. Month-on-month, Econoday forecasters see December's rate rising a solid 0.5 percent. With wage gains limited, home-price appreciation is perhaps the central driver right now for household wealth.
FHFA House Price Index - Consensus Forecast for December: +0.5%
Range: +0.4% to +1.0%
The second estimate for fourth-quarter GDP is expected to come in at plus 0.4 percent vs an initial reading of plus 0.7 percent. The decrease reflects expectations for lower inventory accumulation and lower readings for both residential and non-residential investment. But it was consumer spending that was the highlight of the first estimate, rising at an annualized 2.2 percent in strength that has extended into the first quarter this year.
Real GDP, 4th Quarter, 2nd Estimate, Annualized Rate - Consensus Forecast: +0.4%
Range: 0.2% to +0.8%
GDP Price Index, 4th Quarter, 2nd Estimate - Consensus Forecast: +0.8%
Range: +0.8% to +0.9%
The international trade in goods is expected to narrow slightly in January to an advance reading of $61.0 billion. Imports of goods have been steady with gains for autos offsetting declines for consumer goods. But goods exports have been clearly weak, especially for capital goods in a trend that points to lack of confidence in the outlook among foreign businesses and lack of investment in global productivity.
International Trade In Goods, M/M Chg - Consensus Forecast for January: -$61.0 billion
Range: -$62.5 to -$57.3 billion
The core PCE price index is the Fed's favorite inflation reading and, based on the sharp rise in core consumer prices, is expected to increase a solid 0.2 percent in January. Readings on personal income and personal spending are also expected to post solid gains, at plus 0.4 percent for income, reflecting gains in wage and workweek data in the January employment report, and at plus 0.3 percent for spending reflecting what is expected to be incremental gains for service spending and in line with gains for core retail sales in January.
Personal Income, M/M Chg - Consensus for January: +0.4%
Range: +0.3% to +0.5%
Personal Spending, M/M Chg - Consensus for January: +0.3%
Range: +0.2% to +0.5%
PCE Price Index, M/M Chg - Consensus for January: 0.0%
Range: -0.2% to +0.1%
Core PCE Price Index M/M Chg - Consensus for January: +0.2%
Range: +0.1% to +0.3%
Global stress and this year's decline for the stock market have had only limited impact on consumer confidence measures which have been steady and firm. The consumer sentiment index is expected to come in at 91.0 for the final February reading vs 92.0 for final January and February's flash of 90.7. Resiliency and patience in the domestic consumer, who is getting a boost from low unemployment, would point to solid results for the first-quarter economy. An important detail will be inflation expectations and the effect of low oil prices, readings that are closely watched by Federal Reserve policy makers.
Consumer Sentiment, Final - Consensus for February: 91.0
Range: 90.7 to 98.8
|
