|
Amid the thundering rumble of his footsteps, the unimpeded and unlikely climb of Donald Trump to the very top has yet to either unnerve or inspire the U.S. consumer. The consumer, boosted by high levels of employment, has remained engaged despite the election fury, spending at a respectable clip and remaining confident in the outlook. The outcome of the November election may not prove moderate but the early reaction of the consumer has been exactly that, moderate.
 The consumer sentiment report comes out twice a month and is a closely watched barometer for the immediate effect of news events. The news in this case, of course, is Trump's run of early primary victories that have many insiders already conceding his nomination. But Trump's breakout has not visibly affected the sentiment report where the index for February firmed 1.0 point from mid-month to a 91.7 level that is only marginally below January's final reading of 92.0. And the implied pace over the last two weeks, which is the period when Trump's momentum has secured his place among the immortals, is nearly 92.5 which would point to a small gain. The consumer confidence report, however, is offering a conflicting signal with its index going in the other direction, down a very sizable 5.6 points to 92.2. But this report is monthly with the sample closing out in the third week of the month, a period that saw only a portion of what has become a late-month surge of Trumpmania. Let's turn to a third indicator to settle the matter, the consumer comfort index which comes out weekly but is less closely watched. This indicator has also been stable, holding narrowly over 44 all year despite the financial market shakedown in January and the subsequent Trump shakeup of February. The consumer's early reaction, based on confidence reports, seems to be muted. The consumer sentiment report comes out twice a month and is a closely watched barometer for the immediate effect of news events. The news in this case, of course, is Trump's run of early primary victories that have many insiders already conceding his nomination. But Trump's breakout has not visibly affected the sentiment report where the index for February firmed 1.0 point from mid-month to a 91.7 level that is only marginally below January's final reading of 92.0. And the implied pace over the last two weeks, which is the period when Trump's momentum has secured his place among the immortals, is nearly 92.5 which would point to a small gain. The consumer confidence report, however, is offering a conflicting signal with its index going in the other direction, down a very sizable 5.6 points to 92.2. But this report is monthly with the sample closing out in the third week of the month, a period that saw only a portion of what has become a late-month surge of Trumpmania. Let's turn to a third indicator to settle the matter, the consumer comfort index which comes out weekly but is less closely watched. This indicator has also been stable, holding narrowly over 44 all year despite the financial market shakedown in January and the subsequent Trump shakeup of February. The consumer's early reaction, based on confidence reports, seems to be muted.
 Politics aside, there's plenty of punch in the consumer. Personal income jumped 0.5 percent in January as did consumer spending, both readings higher than expected. Details are solidly positive with components on the income side led by wages & salaries, up a very strong 0.6 percent for the third large gain of the last four months. And year-on-year rates are climbing again with total income up 4.3 percent and with wages & salaries at 4.5 percent, which are far from torrid but the direction is definitely favorable. And consumers didn't draw from savings on their January shopping spree, with the savings rate unchanged at a very solid 5.2 percent. Components on the spending side are led by durable goods which jumped 1.2 percent and reflect strong vehicle sales in the month. Spending on services rose a monthly 0.6 percent. Year-on-year, spending is up 4.2 percent. Again, this isn't great but it does point to a surprisingly strong start to the first quarter which looks to double or triple the fourth-quarter's annualized growth rate of 1.0 percent. Politics aside, there's plenty of punch in the consumer. Personal income jumped 0.5 percent in January as did consumer spending, both readings higher than expected. Details are solidly positive with components on the income side led by wages & salaries, up a very strong 0.6 percent for the third large gain of the last four months. And year-on-year rates are climbing again with total income up 4.3 percent and with wages & salaries at 4.5 percent, which are far from torrid but the direction is definitely favorable. And consumers didn't draw from savings on their January shopping spree, with the savings rate unchanged at a very solid 5.2 percent. Components on the spending side are led by durable goods which jumped 1.2 percent and reflect strong vehicle sales in the month. Spending on services rose a monthly 0.6 percent. Year-on-year, spending is up 4.2 percent. Again, this isn't great but it does point to a surprisingly strong start to the first quarter which looks to double or triple the fourth-quarter's annualized growth rate of 1.0 percent.
 But the really big story of the report is the core PCE, especially the year-on-year rate which is up from 1.4 percent to 1.7 percent and is pointing confidently toward the Fed's 2 percent line. The 1.7 percent rate was last matched way back in July 2014 and before that in February 2013. The gain, so soon in the year, puts the core PCE at the top of the Fed's 1.5 to 1.7 percent forecast for 2016. Total prices, which include food and energy, rose only 0.1 percent but the year-on-year rate for this reading has been on a tear, moving from about zero late last year to plus 1.3 percent in January. The core PCE index, where the methodology is nimble and adjustments made frequently, is the Fed's favorite inflation measure, but other readings have also shown pressure including average hourly earnings which have moved from the 2 percent line to the 2.5 percent line over the past half year. The rise in inflation is on schedule and is a central pillar justifying the Fed's forecast for a series of rate hikes this year. Yet there the indications on the economy that aren't turning out as hoped. But the really big story of the report is the core PCE, especially the year-on-year rate which is up from 1.4 percent to 1.7 percent and is pointing confidently toward the Fed's 2 percent line. The 1.7 percent rate was last matched way back in July 2014 and before that in February 2013. The gain, so soon in the year, puts the core PCE at the top of the Fed's 1.5 to 1.7 percent forecast for 2016. Total prices, which include food and energy, rose only 0.1 percent but the year-on-year rate for this reading has been on a tear, moving from about zero late last year to plus 1.3 percent in January. The core PCE index, where the methodology is nimble and adjustments made frequently, is the Fed's favorite inflation measure, but other readings have also shown pressure including average hourly earnings which have moved from the 2 percent line to the 2.5 percent line over the past half year. The rise in inflation is on schedule and is a central pillar justifying the Fed's forecast for a series of rate hikes this year. Yet there the indications on the economy that aren't turning out as hoped.
 The factory sector bounced back strongly in January, but that was way back in January. The industrial production report showed the first indication of January strength followed by this week's durable goods data where most readings were very strong. But January's bounce follows a very weak close to 2015 and isn't likely to mark an upward pivot in momentum. Year-on-year rates tell the story, at a very modest plus 1.8 percent for total durable goods and down 0.6 percent for ex-transportation which excludes the volatile aircraft component. Ex-transportation is the dark line in the graph which, along with the light line of total orders, has been dead flat for an entire year. But growth rates are improving slightly and comparisons with year-ago periods, as you can see in the graph, are getting easier, much easier. The factory sector bounced back strongly in January, but that was way back in January. The industrial production report showed the first indication of January strength followed by this week's durable goods data where most readings were very strong. But January's bounce follows a very weak close to 2015 and isn't likely to mark an upward pivot in momentum. Year-on-year rates tell the story, at a very modest plus 1.8 percent for total durable goods and down 0.6 percent for ex-transportation which excludes the volatile aircraft component. Ex-transportation is the dark line in the graph which, along with the light line of total orders, has been dead flat for an entire year. But growth rates are improving slightly and comparisons with year-ago periods, as you can see in the graph, are getting easier, much easier.
 Capital goods are the special highlight of the January durable goods report, jumping 3.9 percent following two months of heavy declines. Several industries in this group posted big gains including machinery, computers and fabricated metals. But one month of data is only one month of data. Down a year-on-year 2.8 percent, orders for core capital goods remain near the bottom of the factory rundown. Cross-border trade in capital goods, data in the international trade in goods report that was also released in the week, have also been weak with exports of capital goods down 2.3 percent in January and imports of capital goods down 2.4 percent. Demand for capital goods has been the soft, pointing to lack of confidence in the business outlook including the global outlook. Capital goods are the special highlight of the January durable goods report, jumping 3.9 percent following two months of heavy declines. Several industries in this group posted big gains including machinery, computers and fabricated metals. But one month of data is only one month of data. Down a year-on-year 2.8 percent, orders for core capital goods remain near the bottom of the factory rundown. Cross-border trade in capital goods, data in the international trade in goods report that was also released in the week, have also been weak with exports of capital goods down 2.3 percent in January and imports of capital goods down 2.4 percent. Demand for capital goods has been the soft, pointing to lack of confidence in the business outlook including the global outlook.
 Factory news so far has really been mixed more than bad. But before turning to the really bad news, we have to do some homework. The industrial production and durable goods reports are issued by the government and lag a bit, that is it takes several weeks for the data to be compiled and released. In contrast, anecdotal data, based on voluntary replies from what are often small samples, come out during the month in question. And the month now in question, February, is one of the worst yet, at least based on this run of early indications. The week's data included a national purchasing sample from Markit Economics whose diffusion index is at 51.0 and barely signaling any growth at all. It was the lowest reading in three years and was hit badly in February by weakness in exports. The break-even for Markit's reading, that is the level of the index that indicates no monthly change, is 50 as highlighted in the graph. In percentage terms, the 50 line is equal to zero percent. The more closely watched ISM index, whose data for February comes out on Tuesday, March 1, hit 50.0 exactly in September last year and has since been in sub-50 contraction. Factory news so far has really been mixed more than bad. But before turning to the really bad news, we have to do some homework. The industrial production and durable goods reports are issued by the government and lag a bit, that is it takes several weeks for the data to be compiled and released. In contrast, anecdotal data, based on voluntary replies from what are often small samples, come out during the month in question. And the month now in question, February, is one of the worst yet, at least based on this run of early indications. The week's data included a national purchasing sample from Markit Economics whose diffusion index is at 51.0 and barely signaling any growth at all. It was the lowest reading in three years and was hit badly in February by weakness in exports. The break-even for Markit's reading, that is the level of the index that indicates no monthly change, is 50 as highlighted in the graph. In percentage terms, the 50 line is equal to zero percent. The more closely watched ISM index, whose data for February comes out on Tuesday, March 1, hit 50.0 exactly in September last year and has since been in sub-50 contraction.
 Regional anecdotal reports are also watched for indications on the factory sector and none of these indications are positive. Sharp declines in the Empire State and Philly Fed reports have been followed by similar declines from the Richmond Fed and especially the Kansas City Fed which is getting pulled deeply under by the energy sector. And in many of these reports, selling prices, not just prices for raw materials, are going down in what is a not-so-favorable indication of pass through that is deflation pass through. These are indications that do not point to continued acceleration for inflation. Weakness in February's anecdotal run is convincing if nothing else than in its totality, suggesting that January's rise in the government's national reports will prove a one-hit wonder for a sector that simply continues to struggle. Regional anecdotal reports are also watched for indications on the factory sector and none of these indications are positive. Sharp declines in the Empire State and Philly Fed reports have been followed by similar declines from the Richmond Fed and especially the Kansas City Fed which is getting pulled deeply under by the energy sector. And in many of these reports, selling prices, not just prices for raw materials, are going down in what is a not-so-favorable indication of pass through that is deflation pass through. These are indications that do not point to continued acceleration for inflation. Weakness in February's anecdotal run is convincing if nothing else than in its totality, suggesting that January's rise in the government's national reports will prove a one-hit wonder for a sector that simply continues to struggle.
 Unfortunately, it would be no surprise if the factory sector extends its slump through the year, but it would be a surprise if housing doesn't pick up speed. Sales data for both existing homes and new homes did not show much life in January. Existing home sales, up 0.4 percent in January to a 5.47 million annualized rate, held on to the bulk of December's surge. But new home sales, pulled down by an odd plunge in the West, could not hold onto their December surge, falling steeply to a 494,000 rate. Price data in both reports are very weak with the median price for existing homes down 4.2 percent to $213,800 and the median for a new home down 5.7 percent in the month to $278,800. Discounting may help boost sales but, in pulling down home-price appreciation, it will not help household wealth. Unfortunately, it would be no surprise if the factory sector extends its slump through the year, but it would be a surprise if housing doesn't pick up speed. Sales data for both existing homes and new homes did not show much life in January. Existing home sales, up 0.4 percent in January to a 5.47 million annualized rate, held on to the bulk of December's surge. But new home sales, pulled down by an odd plunge in the West, could not hold onto their December surge, falling steeply to a 494,000 rate. Price data in both reports are very weak with the median price for existing homes down 4.2 percent to $213,800 and the median for a new home down 5.7 percent in the month to $278,800. Discounting may help boost sales but, in pulling down home-price appreciation, it will not help household wealth.
 The most closely watched data on home prices come from FHFA and Case-Shiller, both of which have been stuck under 6 percent since mid-year last year. And trends in the latest data actually slowed slightly. The FHFA did rise moderately in the latest month but the year-on-year rate slipped 2 tenths to 5.7 percent. Case-Shiller posted a sharper monthly increase but, here too, the year-on-year rate also slowed to 5.7 percent. But 5.7 percent appreciation won't be cutting it with the optimists among homeowners who came into this year hoping for 10 percent. Housing has been uneven and may not be contributing its share to economic growth. The most closely watched data on home prices come from FHFA and Case-Shiller, both of which have been stuck under 6 percent since mid-year last year. And trends in the latest data actually slowed slightly. The FHFA did rise moderately in the latest month but the year-on-year rate slipped 2 tenths to 5.7 percent. Case-Shiller posted a sharper monthly increase but, here too, the year-on-year rate also slowed to 5.7 percent. But 5.7 percent appreciation won't be cutting it with the optimists among homeowners who came into this year hoping for 10 percent. Housing has been uneven and may not be contributing its share to economic growth.
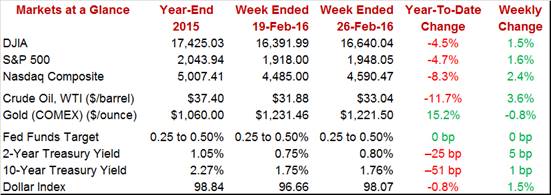
 Demand for stocks has generally been climbing as the Trump sensation builds. The Dow, closing this week at 16,640, has gained more than 700 points since Trump's New Hampshire victory on February 9. Short-end Treasury rates have shown no change though demand for long-term Treasuries, in perhaps a hint of a safety bid, have risen but not convincingly. The dollar index, in perhaps another modest sign of a safety bid, has risen about 1 percent over this period. The lack of significant reaction to Trump may suggest that a less-than-moderate outcome for the November election would not rattle the economic outlook, or it may suggest that market repricing has yet to swing into gear. Day-to-day ups and downs for the market have not been tied to Trump but instead to oil which gained 3.6 percent on the week, in turn paving the way for the Dow's 1.5 percent weekly gain. Demand for stocks has generally been climbing as the Trump sensation builds. The Dow, closing this week at 16,640, has gained more than 700 points since Trump's New Hampshire victory on February 9. Short-end Treasury rates have shown no change though demand for long-term Treasuries, in perhaps a hint of a safety bid, have risen but not convincingly. The dollar index, in perhaps another modest sign of a safety bid, has risen about 1 percent over this period. The lack of significant reaction to Trump may suggest that a less-than-moderate outcome for the November election would not rattle the economic outlook, or it may suggest that market repricing has yet to swing into gear. Day-to-day ups and downs for the market have not been tied to Trump but instead to oil which gained 3.6 percent on the week, in turn paving the way for the Dow's 1.5 percent weekly gain.
Recent economic news has been mixed but not political news which has been anything but mixed. Still, the economic impact from the election has so far been zero with no trend yet detectable. Far more than zero, however, and fully detectable is the rise underway in inflation, itself a manifestation of the strength of the consumer who, despite the sound and fury of the election and despite weakness in the factory and housing sectors, is alert and in the driver's seat. Debate at the mid-March FOMC looks to be lively. Strong consumers together with an upward pivot for inflation are not the makings for a rate pass but, on the contrary, are the makings of a rate hike. And a strong employment report for February, which is a definite possibility, could make a pass seem almost inconceivable (at least that is for the hawks).
A week filled with data will culminate in Friday's employment report where respectable strength is expected. Pending home sales lead off on Monday followed on Tuesday with construction spending, both offering the latest on the housing sector where recent data have been uneven. Factory data have mostly been in clear retreat including the ISM manufacturing index where another sub-50 contraction is expected in Tuesday's report. But the news is expected to improve a bit on Thursday with ISM's non-manufacturing report where growth is expected steady at a moderate pace, growth that would help confirm confidence in the domestic economy. What has not been slowing is the labor market which has continued to improve. Econoday's consensus for Friday's non-farm payroll headline is 190,000 in what would be a solid increase from December's 151,000 and perhaps enough to revive the chances of a rate hike at the March FOMC.
The Chicago PMI is expected to fall back to 52.9 from January's great and completely unexpected 12.7-point surge to 55.6. Readings in the January report swung from yearlong lows back to yearlong highs with new orders and backlog orders posting substantial improvement along with production. Holding in the negative column, however, were employment and input prices. This report, which can be very volatile, tracks the whole of the Chicago-area economy.
Chicago PMI - Consensus for February: 52.9
Range: 48.0 to 55.0
Boosted by gains in mortgage applications for home purchases, pending home sales are expected to climb 0.5 percent in January, in turn pointing to solid growth for final sales of existing homes. However up-and-down the sector has been, housing still appears to be a positive for the nation's economy.
Pending Home Sales, M/M Chg. - Consensus for January: +0.5%
Range: +0.4% to +1.5%
The Dallas Fed general activity index has been buried in very deep contraction and, along with the Kansas City Fed report, have been showing the greatest effects from the collapse in oil prices. The Econoday consensus is calling for a 14th straight month of contraction in February, at minus 30.0 and not much better than January's shocking plunge to minus 34.6. Both new orders and backlog orders in the January report fell further into the red. Production, which had held in the plus column as manufacturers worked off backlogs, fell a numbing 23 points in January to move deeply into the negative column at minus 10.2.
Dallas Fed Manufacturing Index - Consensus Forecast for February: -30.0
Range: -32.4 to -18.0
Motor vehicle sales are perhaps 2016's best early surprise, rising to a 17.6 million annualized rate in January in strength that was later confirmed by a solid rise in the related component of the retail sales report. Manufacturers are expected to report a slight uptick in February to 17.7 million in what would be another important sign of consumer strength.
Total Vehicle Sales, Annual Rate - Consensus Forecast for January: 17.7 million
Range: 17.3 to 17.8 million
The final reading for the February manufacturing PMI is expected to hold steady, at a very soft consensus of 51.3 vs a February flash of 51.0 and a final January reading of 52.4. The February flash was the weakest reading in three years and included slowing across new orders, backlog orders, employment and production. In a convincing sign of weakness, selling prices were also down. Exports remain a central weakness of the report, reflecting soft global demand compounded by the strength of the dollar.
Manufacturing PMI, Final - Consensus Forecast for February: 51.3
Range: 51.0 to 51.7
The ISM manufacturing index has been below breakeven 50 for four straight readings and another sub-50 reading is expected for February, at an Econoday consensus of 48.5. New orders, boosted by domestic demand, did pop back over 50 in January but only slightly while backlog orders and export orders remained in contraction. Employment has been especially weak and, like many readings in this report, is at its lowest point since 2009. Inventories of raw materials have held steady but ISM's sample has been warning that inventories of finished goods are too high, sentiment that points to lack of confidence in the business outlook.
ISM Manufacturing Index - Consensus Forecast for February: 48.5
Range: 47.2 to 49.5
Construction spending had been a strength for the economy until late last year when the annualized rate, despite mild weather in November and December, flattened out at just over $1.1 trillion. Still, growth across most readings, both residential and non-residential, has been trending in the high single digits with multi-family homes on the residential side a standout with year-on-year growth at 12.0 percent in the December report. Forecasters see renewed strength in January with the Econoday consenus at plus 0.5 percent. Housing and construction have been bumpy but on net have been contributing to overall economic growth.
Construction Spending, M/M Chg - Consensus Forecast for January: +0.5%
Range: -0.2% to +0.8%
The ADP employment report doesn't always predict the outcome of the government's employment report but it has been accurate the last two reports, signaling convincing acceleration in December and then slowing in January. Forecasters see Friday's employment report for February showing strength and likewise see ADP showing strength as well, at a consensus 185,000 vs ADP's private payroll count of 205,000 in January.
ADP, Private Payrolls - Consensus Forecast for February: 185,000
Range: 165,000 to 205,000
The February 13 week, which was the sample week for the monthly employment report, proved pivotal for initial jobless claims which fell sizably to 262,000 for the lowest reading since November. Since then, claims have climbed but only slightly with the Econoday consensus pointing to a very favorable 270,000 level in the February 27 week. Whatever the results, data in the latest report fall outside the mid-month sample period and will very likely have no impact on expectations for the February employment report.
Initial Jobless Claims - Consensus Forecast for February 27 week: 270,000
Range: 263,000 to 272,000
Pulled down by low output and a rise in hours worked, non-farm productivity fell into annualized contraction of minus 3.0 percent in the first estimate for the fourth quarter. Forecasters expect productivity to be revised only slightly to minus 3.2 percent in the second estimate. Weak output together with a 1.3 percent rise in compensation lifted unit labor costs to plus 4.5 percent with the second estimate seen at plus 4.7 percent. The lack of output during the fourth quarter gave this report a very weak baseline and relative strength in the first quarter points to ongoing improvement for productivity and ongoing easing in labor costs.
Non-Farm Productivity, Adj. Annualized Rate, 2nd Estimate - Consensus for Fourth Quarter: -3.2%
Range: -3.5% to -2.1%
Unit Labor Costs, Adj. Annualized Rate, 2nd Estimate - Consensus for Fourth Quarter: +4.7%
Range: +3.3% to +5.0%
Manufacturing definitely popped higher in January with both the industrial production and durable goods reports showing strength. And strength is expected for the January's factory orders report where a strong 2.0 percent gain is expected. The durables report did show wide strength including a bounce back for capital, but early indications on February's factory activity are uniformily negative and suggest that January was not the beginning of a new trend.
Factory Orders, M/M Chg. - Consensus Forecast for January: +2.0%
Range: +0.5% to +2.8%
Slowing steadily for six months, the ISM non-manufacturing index correctly signaled the second-half dip in GDP and may be signaling disappointing growth for the first quarter. But components for new orders and backlogs have continued to show strength, though much less so for employment where growth slowed sharply in January. The services PMI from Markit Economics has also been slowing and forecasters see further slowing for the non-manufacturing index, to a consensus 53.1 for February vs 53.5 in January.
ISM Non-Manufacturing Index - Consensus Forecast for February: 53.1
Range: 52.0 to 54.0
Nonfarm payrolls are expected to rise 190,000 in February following a lower-than-expected but still respectable 151,000 increase in January. January's employment report, despite the slowing in payrolls, did show strength as the unemployment rate came down and average hourly earnings jumped an outsized 0.5 percent. The unemployment rate is expected to hold at 4.9 percent in February while average hourly earnings are expected to slow to a more sustainable plus 0.2 percent. With jobless claims moving back down, the labor market looks solid and appears to be moving to full employment, and a February report that would no more than meet consensus could very well give the FOMC, outside of secodary considerations, enough justification to hike rates at this month's FOMC.
Nonfarm Payrolls - Consensus for February: 190,000
Range: 168,000 to 217,000
Private Payrolls - Consensus for February: 183,000
Range: 156,000 to 215,000
Unemployment Rate - Consensus for February: 4.9%
Range: 4.8% to 5.0%
Average Hourly Earnings - Consensus for February: +0.2%
Range: 0.0% to +0.2%
Average Workweek - Consensus for February: 34.6 hours
Range: 34.5 to 34.6 hours
The nation's trade deficit is expected to widen slightly to $43.9 billion in January vs December's $43.4 billion. Weak global demand has been hurting exports while imports, in a sign of domestic weakness and despite strength in the dollar, have been flat. Last week's advanced data on January showed a narrowing in the goods deficit, down 1.2 percent to $62.2.
International Trade Balance - Consensus Forecast for January: -$43.9 billion
Range: -$45.3 to -$40.9 billion
|
