|
Truth unfortunately is not always consistent with politics, especially during the loud and repetitive hyperbole of an election year. Candidates from both parties may be harping on economic failure but the U.S. labor market, as this column has been saying all along, remains very strong and continues to track toward the theoretical flashpoint of wage inflation. Yet wage inflation has yet to appear, underscoring that growth, as election hopefuls are stressing, is skewed toward low paying jobs. It's important to remember, however, that inflation outside of wages is also subdued which at least means that pay is not losing ground. Block the negativism out and assess the week's economic news, both good and bad, for yourself and I think you'll find that, on net, the data are strong enough to warrant at least the consideration of a rate hike at this month's FOMC.
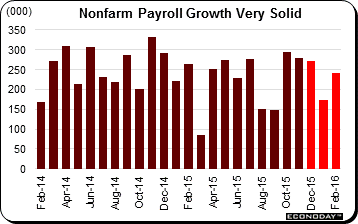 The labor market is adding jobs at an unquestionably strong rate which is not consistent with predictions of recession or worries over negative interest rates and all the rest. Nonfarm payrolls rose 242,000 in February vs the Econoday consensus for 190,000 and a high estimate of only 217,000. Adding to the punch are upward revisions to the two prior months totaling 30,000. The 3-month average is at 228,000, more than double the minimum 100,000 that Janet Yellen believes is enough to absorb new job seekers into the labor market. To underscore the strength, payroll growth was last under the 100,000 line in March 2015 at 84,000 and before that in December 2013 and June 2012. The last negative reading was 5-1/2 years ago, way back at the beginning of the recovery in September 2010. The labor market is adding jobs at an unquestionably strong rate which is not consistent with predictions of recession or worries over negative interest rates and all the rest. Nonfarm payrolls rose 242,000 in February vs the Econoday consensus for 190,000 and a high estimate of only 217,000. Adding to the punch are upward revisions to the two prior months totaling 30,000. The 3-month average is at 228,000, more than double the minimum 100,000 that Janet Yellen believes is enough to absorb new job seekers into the labor market. To underscore the strength, payroll growth was last under the 100,000 line in March 2015 at 84,000 and before that in December 2013 and June 2012. The last negative reading was 5-1/2 years ago, way back at the beginning of the recovery in September 2010.
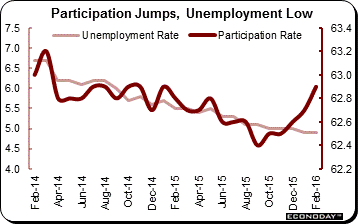 A very big plus is the unemployment rate which remains very low at 4.9 percent, unchanged in February even though the labor participation rate is rebounding, up 2 tenths in the month to 62.9 percent as both new entrants come in and, importantly, discouraged workers begin looking for work again. Participation is now at its best rate since January last year. The U-6 unemployment rate, a wide definition that is cited frequently by Janet Yellen, is down a full 2 tenths to 9.7 percent for the lowest reading of the recovery, since May 2008. Low unemployment together with rising participation are telling evidence of economic strength. A very big plus is the unemployment rate which remains very low at 4.9 percent, unchanged in February even though the labor participation rate is rebounding, up 2 tenths in the month to 62.9 percent as both new entrants come in and, importantly, discouraged workers begin looking for work again. Participation is now at its best rate since January last year. The U-6 unemployment rate, a wide definition that is cited frequently by Janet Yellen, is down a full 2 tenths to 9.7 percent for the lowest reading of the recovery, since May 2008. Low unemployment together with rising participation are telling evidence of economic strength.
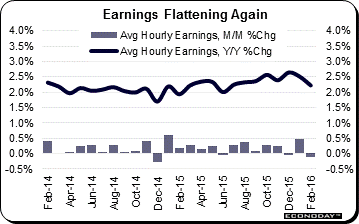 A prominent negative in the report, however, is a 0.1 percent decline in average hourly earnings that follows, however, January's outsized 0.5 percent gain when state-level minimum wage increases took effect. Another possible one-time negative factor is the timing of the February sample week which did not include the 15th of the month and so may exclude mid-month pay raises. Unfortunately, however, the year-on-year rate for earnings is decidedly downbeat, down 3 tenths to 2.2 percent. This key reading, as seen in the dark line of the graph, appears to be losing steam and won't be getting any lift from coming comparisons against the first half of 2015 when earnings growth was respectable. And looking at payroll gains by industry does point to low wages with retail leading the way at a February gain of 55,000. A prominent negative in the report, however, is a 0.1 percent decline in average hourly earnings that follows, however, January's outsized 0.5 percent gain when state-level minimum wage increases took effect. Another possible one-time negative factor is the timing of the February sample week which did not include the 15th of the month and so may exclude mid-month pay raises. Unfortunately, however, the year-on-year rate for earnings is decidedly downbeat, down 3 tenths to 2.2 percent. This key reading, as seen in the dark line of the graph, appears to be losing steam and won't be getting any lift from coming comparisons against the first half of 2015 when earnings growth was respectable. And looking at payroll gains by industry does point to low wages with retail leading the way at a February gain of 55,000.
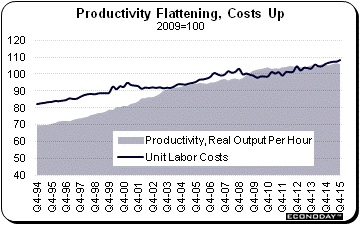 Low wage jobs are one salient of the labor market as is slow growth in worker productivity which is another factor holding down wages. The long slope of productivity, as seen in the shaded area of the graph, has been flattening while the slope for labor costs, the dark line in the graph, is steepening. When measured year-on-year, productivity growth for the whole of the recovery has been trending in the low single digits (under 2.0 percent) while labor costs, in contrast, have been trending in the mid-single digits. This unwanted separation in part reflects lack of investment in new technologies and means that employers are getting less punch with each new employee they hire. This hurts profit margins and limits the ability of employers to improve wages. Low wage jobs are one salient of the labor market as is slow growth in worker productivity which is another factor holding down wages. The long slope of productivity, as seen in the shaded area of the graph, has been flattening while the slope for labor costs, the dark line in the graph, is steepening. When measured year-on-year, productivity growth for the whole of the recovery has been trending in the low single digits (under 2.0 percent) while labor costs, in contrast, have been trending in the mid-single digits. This unwanted separation in part reflects lack of investment in new technologies and means that employers are getting less punch with each new employee they hire. This hurts profit margins and limits the ability of employers to improve wages.
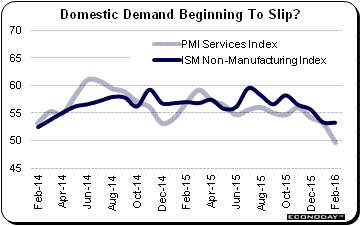 There is a scare in the week's data and that is contraction for Markit Economics' service-sector sample which reported unusually flat activity in February, at an index of 49.7 for the weakest reading since the government shutdown in October 2013. New orders are still growing but, after three months of slowing, are at their weakest pace since January last year. The 12-month outlook, though still positive, is the least positive in 5-1/2 years. Hiring in the sample is still solid but how long it can sustain strength, given the weakness in orders, is a big question. Price data are not favorable with inputs down and selling prices falling to a 5-month low. All this weakness, however, was not confirmed by ISM's non-manufacturing report where the index held steady at a respectable plus-50 score of 53.4. New orders in this sample came in at 55.5, down 1 point from January but still very solid. And backlog orders continue to expand. Strength in orders points to future strength in employment which, however, in the report's only negative did dip 2.5 points to 49.7 for the first sub-50 reading since February 2014. This turned out, interestingly, to be a false signal of weakness for the February employment report. Other details include a nearly 4 point rise in output (defined as business activity in this report) which is a solid indication for first-quarter growth. Still, trends in both reports have been moving downward and raise the important question whether domestic demand is falling in line with sinking demand from overseas. There is a scare in the week's data and that is contraction for Markit Economics' service-sector sample which reported unusually flat activity in February, at an index of 49.7 for the weakest reading since the government shutdown in October 2013. New orders are still growing but, after three months of slowing, are at their weakest pace since January last year. The 12-month outlook, though still positive, is the least positive in 5-1/2 years. Hiring in the sample is still solid but how long it can sustain strength, given the weakness in orders, is a big question. Price data are not favorable with inputs down and selling prices falling to a 5-month low. All this weakness, however, was not confirmed by ISM's non-manufacturing report where the index held steady at a respectable plus-50 score of 53.4. New orders in this sample came in at 55.5, down 1 point from January but still very solid. And backlog orders continue to expand. Strength in orders points to future strength in employment which, however, in the report's only negative did dip 2.5 points to 49.7 for the first sub-50 reading since February 2014. This turned out, interestingly, to be a false signal of weakness for the February employment report. Other details include a nearly 4 point rise in output (defined as business activity in this report) which is a solid indication for first-quarter growth. Still, trends in both reports have been moving downward and raise the important question whether domestic demand is falling in line with sinking demand from overseas.
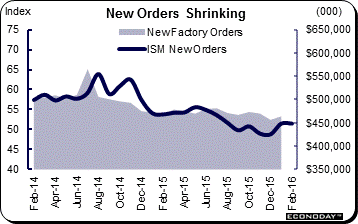 The factory sector is the economy's weak link but data for January proved strong with factory orders up 1.6 percent as tracked by the shaded area of the graph where orders rose 1.6 percent to a monthly $464 billion. Core capital goods, boosted by orders for machinery, fabricated metals, and computers, are a key positive in the report and offset another major decline for mining & oil field equipment. Other areas of strength include aircraft orders and also motor vehicle orders where domestic sales have been very solid. And a leading indicator on February, that is the ISM's new orders index for manufacturing, held unchanged at a respectable enough level of 51.5 as seen in the dark line of the graph. But other indications on February have been uniformly negative suggesting that, despite the steady ISM reading for orders, February will not be extending January's strength. The factory sector is the economy's weak link but data for January proved strong with factory orders up 1.6 percent as tracked by the shaded area of the graph where orders rose 1.6 percent to a monthly $464 billion. Core capital goods, boosted by orders for machinery, fabricated metals, and computers, are a key positive in the report and offset another major decline for mining & oil field equipment. Other areas of strength include aircraft orders and also motor vehicle orders where domestic sales have been very solid. And a leading indicator on February, that is the ISM's new orders index for manufacturing, held unchanged at a respectable enough level of 51.5 as seen in the dark line of the graph. But other indications on February have been uniformly negative suggesting that, despite the steady ISM reading for orders, February will not be extending January's strength.
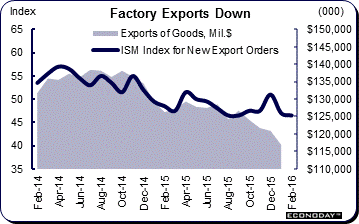 Contraction in energy equipment is one key factor hurting the factory sector as is weakness in exports, tracked here by the shaded area which has been falling sharply, to only $117 billion for January. This is the lowest monthly level since June 2011. But ISM's index for export orders, the line in the graph, is not pointing to further weakness which may, perhaps, point ahead to an export rebound in the months ahead. Still, exports of capital goods have been especially weak as have imports of capital goods, both pointing to lack of business investment and continued lack of productivity growth, not just at the domestic level but the global level as well. Shipments of core capital goods, in data from the factory orders report, fell noticeably in January which gets actual first-quarter business investment off to a bad start this year. Contraction in energy equipment is one key factor hurting the factory sector as is weakness in exports, tracked here by the shaded area which has been falling sharply, to only $117 billion for January. This is the lowest monthly level since June 2011. But ISM's index for export orders, the line in the graph, is not pointing to further weakness which may, perhaps, point ahead to an export rebound in the months ahead. Still, exports of capital goods have been especially weak as have imports of capital goods, both pointing to lack of business investment and continued lack of productivity growth, not just at the domestic level but the global level as well. Shipments of core capital goods, in data from the factory orders report, fell noticeably in January which gets actual first-quarter business investment off to a bad start this year.
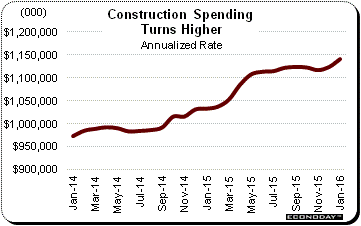 Construction, in contrast to exports, is a positive for the economy with related spending turning higher toward an annualized rate of $1.15 trillion. The strength for January, however, does not include housing which was flat. Instead, growth was led by a one-month surge in highway & street spending as well as gains for Federal construction projects and a welcome gain for manufacturing. The residential component was unchanged in the month as a 0.2 percent slip in single-family homes offset another jump in the much smaller multi-family subcomponent which rose 2.6 percent in the month. Demand on the multi-family side, reflecting strength in rental prices, has been very strong with year-on-year spending up 30.4 percent vs 6.6 percent for single-family homes. Together, residential spending is up a year-on-year 7.7 percent. Construction, in contrast to exports, is a positive for the economy with related spending turning higher toward an annualized rate of $1.15 trillion. The strength for January, however, does not include housing which was flat. Instead, growth was led by a one-month surge in highway & street spending as well as gains for Federal construction projects and a welcome gain for manufacturing. The residential component was unchanged in the month as a 0.2 percent slip in single-family homes offset another jump in the much smaller multi-family subcomponent which rose 2.6 percent in the month. Demand on the multi-family side, reflecting strength in rental prices, has been very strong with year-on-year spending up 30.4 percent vs 6.6 percent for single-family homes. Together, residential spending is up a year-on-year 7.7 percent.
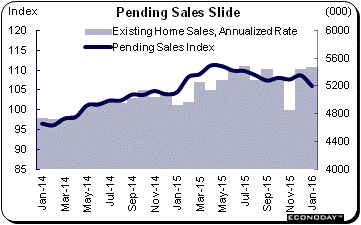 Gains in construction spending, though solid, have been limited by supply constraints that include available labor which may explain softening growth in construction payrolls that only rose 19,000 in February following an even smaller 15,000 gain in January. These readings follow three strong prior months when growth in construction payrolls averaged 49,000. Lack of new construction has been limiting sales of new homes but this scarcity hasn't been giving much lift to sales of existing homes. Pending home sales were one of the week's disappointments, down 2.5 percent in the latest report and pointing to lack of growth for final sales of existing homes as tracked in the shaded area of the graph. Despite high levels of employment and low mortgage rates, home sales are getting off to a slow start this year. Gains in construction spending, though solid, have been limited by supply constraints that include available labor which may explain softening growth in construction payrolls that only rose 19,000 in February following an even smaller 15,000 gain in January. These readings follow three strong prior months when growth in construction payrolls averaged 49,000. Lack of new construction has been limiting sales of new homes but this scarcity hasn't been giving much lift to sales of existing homes. Pending home sales were one of the week's disappointments, down 2.5 percent in the latest report and pointing to lack of growth for final sales of existing homes as tracked in the shaded area of the graph. Despite high levels of employment and low mortgage rates, home sales are getting off to a slow start this year.
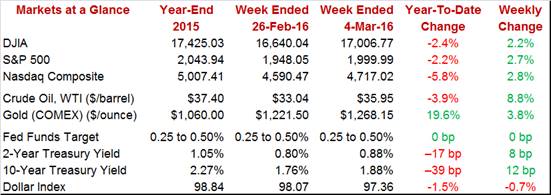
 Solid job growth together with low wage inflation is a combination that points to economic growth without the immediate risk of a Fed rate hike. Markets rallied Friday and lifted the week's gain for the Dow to 2.2 percent, ending at 17,006 and back over 17,000 for the first time since January 5th. The S&P 500, up 2.7 percent on the week, ended at 1,999.99 and just short of 2,000 where it last was also on January 5th. Oil, near $36 for WTI, had a very good week, jumping 8.8 percent and cutting the year-to-date loss to only 3.9 percent. Gains for stocks and commodities came at the expense of Treasuries where selling lifted the 10-year yield by 12 basis points to 1.88 percent. Still, compared to the beginning of the year, the 10-year yield is down a whopping 39 basis points in what is tangible evidence of this year's investor unease. Solid job growth together with low wage inflation is a combination that points to economic growth without the immediate risk of a Fed rate hike. Markets rallied Friday and lifted the week's gain for the Dow to 2.2 percent, ending at 17,006 and back over 17,000 for the first time since January 5th. The S&P 500, up 2.7 percent on the week, ended at 1,999.99 and just short of 2,000 where it last was also on January 5th. Oil, near $36 for WTI, had a very good week, jumping 8.8 percent and cutting the year-to-date loss to only 3.9 percent. Gains for stocks and commodities came at the expense of Treasuries where selling lifted the 10-year yield by 12 basis points to 1.88 percent. Still, compared to the beginning of the year, the 10-year yield is down a whopping 39 basis points in what is tangible evidence of this year's investor unease.
Employment growth is alive and well, attracting new applicants into the labor force and more than enough to keep the unemployment rate down. But global demand is definitely soft as is business investment, which are headwinds that may be slowing the domestic economy's growth. Still, were it not for global issues, which include market volatility, there would very likely be no question of a March rate hike. But the lack of wage strength reduces the urgency for a hike and gives policy makers the cover they need to pass at this month's FOMC. At least, that is the general expectation.
Last week's employment report — and dip backwards for average hourly earnings — points to economic growth without the risk of a Fed rate hike, a combination that is proving very helpful for stocks. This week's calendar includes import & export prices on Friday which are expected to show extended contraction in what would underscore the weakness of cross-border demand and weakness of global prices. Otherwise the calendar is very light with jobless claims on Thursday the only other market-moving data.
Consumer credit is expected to rise $16.5 billion in January following a $21.3 billion gain in December that included a second straight strong showing for revolving credit, one that hints at greater consumer willingness to take on credit-card debt. Nonrevolving credit, boosted by vehicle sales and also by student loans, is the stronger of the two components.
Consumer Credit - Consensus for January: +$16.5 billion
Range: +$6.5 to +$20.0 billion
The small business optimism index had been on the climb before January's 1.3 point dip to 93.9, one that reflected deepening doubts over both the economic outlook and sales expectations. Plans to increase employment also came down but nevertheless remained solidly in the plus column. Forecasters see this index bouncing back slightly, at a consensus 94.2 for February.
Small Business Optimism Index - Consensus Forecast for February: 94.2
Range: 92.4 to 94.6
Wholesale inventories, due to soft demand, fell each month of the fourth quarter and the reading on the first month of the first quarter is also negative, at a consensus minus 0.1 percent. Wholesale inventory liquidation has been a success, keeping the stock-to-sales ratio for this sector at a moderate 1.32 in both December and November.
Wholesale Inventories, M/M Chg. - Consensus Forecast for January: -0.1%
Range: -0.4% to +0.3%
Initial jobless claims are expected to fall 6,000 to 272,000 in the March 5th week. Both initial claims as well as continuing claims have been near historic lows, pointing toward full employment for the economy.
Initial Jobless Claims - Consensus Forecast for March 5 week: 272,000
Range: 270,000 to 278,000
No price report has been as weak for as long as import & export prices where year-on-year rates are in the negative mid-single digits. The import side has been pressured by low prices for imports made cheaper by the strength of the dollar, while the export side has been hurt by falling global demand for U.S. products including the key category of capital goods. Econoday forecasters see import prices falling 0.8 percent in February with export prices down 0.5 percent. None of the forecasters see a gain for either of the readings.
Import Prices, M/M Chg - Consensus Forecast for February: -0.8%
Range: -1.5% to -0.1%
Export Prices, M/M Chg - Consensus Forecast for February: -0.5%
Range: -1.0% to -0.2%
|
