|
The high cost of things is a popular topic on both sides of the political campaign but it's actually the low cost of things that has been a major concern for economic policy makers over the past year. Indications of global prices have mostly been weak but here in the U.S., signs of a welcome shift are perhaps beginning to emerge.
 Cross-border price pressures, pulled lower by weak global demand continue to contract though at a slowing rate in what offers limited good news for the inflation outlook. Import prices fell 0.3 percent in February with export prices down 0.4 percent, both showing the least contraction since October. Turning to year-on-year readings as seen in the accompanying graph, for both import and export prices are tracking at minus 6.0 percent, which is very weak of course, but still an improvement from prior months especially on the import side where contraction last year hit almost 12 percent. And this month's big rally in oil prices, up 15 percent since the end of February, points to monthly gains for both import and export prices in March and further improvement for year-on-year rates where comparisons, in a technical positive, are becoming easier and easier. Cross-border price pressures, pulled lower by weak global demand continue to contract though at a slowing rate in what offers limited good news for the inflation outlook. Import prices fell 0.3 percent in February with export prices down 0.4 percent, both showing the least contraction since October. Turning to year-on-year readings as seen in the accompanying graph, for both import and export prices are tracking at minus 6.0 percent, which is very weak of course, but still an improvement from prior months especially on the import side where contraction last year hit almost 12 percent. And this month's big rally in oil prices, up 15 percent since the end of February, points to monthly gains for both import and export prices in March and further improvement for year-on-year rates where comparisons, in a technical positive, are becoming easier and easier.
 The long contraction for import prices is due in part to the strength of the dollar which is giving U.S. buyers more for their money. But this effect, like that for oil, may be easing as the dollar steadily loses ground, down 2.7 percent on the dollar index so far this year. Prices of imported finished goods, which contracted throughout last year, appear to have hit bottom at year-end and are improving across the board. Prices of imported consumer goods, the dark line that includes many of the basics we buy, are now at the breakeven line. Both motor vehicles and capital goods are also showing life. The long contraction for import prices is due in part to the strength of the dollar which is giving U.S. buyers more for their money. But this effect, like that for oil, may be easing as the dollar steadily loses ground, down 2.7 percent on the dollar index so far this year. Prices of imported finished goods, which contracted throughout last year, appear to have hit bottom at year-end and are improving across the board. Prices of imported consumer goods, the dark line that includes many of the basics we buy, are now at the breakeven line. Both motor vehicles and capital goods are also showing life.
 The offset to contraction for goods prices has been steady and respectable strength for service prices which are less exposed to the vicissitudes of the global economy. Service-price inflation at the consumer level has been holding steady near 2.5 percent since October last year, offering a convincing offset to weakness in commodities inflation which has been in contraction since October 2014. But even here, as seen in the brown line of the graph, improvement is evident as commodity prices may very well emerge back into expansion in March. The offset to contraction for goods prices has been steady and respectable strength for service prices which are less exposed to the vicissitudes of the global economy. Service-price inflation at the consumer level has been holding steady near 2.5 percent since October last year, offering a convincing offset to weakness in commodities inflation which has been in contraction since October 2014. But even here, as seen in the brown line of the graph, improvement is evident as commodity prices may very well emerge back into expansion in March.
 Two inflation readings that will get very close examination at the March FOMC will be core rates for the CPI and especially the PCE. The CPI core has been moving above the 2 percent target line since late last year, boosted by services and especially the medical component which is tracking at 3 percent. Less pronounced is strength in the more carefully calibrated PCE which is just beginning to track toward 2 percent. Yet the direction of the PCE is very convincing and at 1.7 percent in the latest data is already at the outside of the FOMC's target for this year. Two inflation readings that will get very close examination at the March FOMC will be core rates for the CPI and especially the PCE. The CPI core has been moving above the 2 percent target line since late last year, boosted by services and especially the medical component which is tracking at 3 percent. Less pronounced is strength in the more carefully calibrated PCE which is just beginning to track toward 2 percent. Yet the direction of the PCE is very convincing and at 1.7 percent in the latest data is already at the outside of the FOMC's target for this year.  But there's a third reading in the mix and that's average hourly earnings where the trend, despite six months of improvement, has been fading downward. Earnings fell 0.1 percent in February with the year-on-year rate, as tracked in the dark blue line, moving in the wrong direction, from 2.5 percent late last year to 2.2 percent in the latest report. Wage inflation has yet to appear giving policy makers immediate cover not to further withdraw stimulus. And cover is especially welcome during the political campaign when low wages are a cross-party theme. Still, if against all odds inflation does take hold and rates are suddenly jacked up in response, we can look back at this month's FOMC and say March could have been a favorable time to have acted before wage inflation appeared. But there's a third reading in the mix and that's average hourly earnings where the trend, despite six months of improvement, has been fading downward. Earnings fell 0.1 percent in February with the year-on-year rate, as tracked in the dark blue line, moving in the wrong direction, from 2.5 percent late last year to 2.2 percent in the latest report. Wage inflation has yet to appear giving policy makers immediate cover not to further withdraw stimulus. And cover is especially welcome during the political campaign when low wages are a cross-party theme. Still, if against all odds inflation does take hold and rates are suddenly jacked up in response, we can look back at this month's FOMC and say March could have been a favorable time to have acted before wage inflation appeared.
 One offset to low wages for the consumer has been the decline in oil prices which, however, may (or may not) be a thing of the past. Oil has moved from the low $30s earlier this month to $40 on Friday. The ongoing gain for oil is tied in part to talk of producer cutbacks, but production here in the U.S. has remained strong. Domestic production, the dark line in the graph, has kept above 9.0 million barrels per day throughout the price collapse. Imports, the lighter line, have showed no meaningful change and have been climbing of late, moving to an 8.0 million per day average. One offset to low wages for the consumer has been the decline in oil prices which, however, may (or may not) be a thing of the past. Oil has moved from the low $30s earlier this month to $40 on Friday. The ongoing gain for oil is tied in part to talk of producer cutbacks, but production here in the U.S. has remained strong. Domestic production, the dark line in the graph, has kept above 9.0 million barrels per day throughout the price collapse. Imports, the lighter line, have showed no meaningful change and have been climbing of late, moving to an 8.0 million per day average.  The combined weekly total for crude of 17.0 million barrels is the highest on record! Inventories are a key determinant for price and high inventories, at roughly 520 million barrels as tracked in the black line, correlate with low prices as tracked in the red line. Oil prices may be turning up and look to be giving near-term data a lift, but further gains will be limited by ever-building inventories. The combined weekly total for crude of 17.0 million barrels is the highest on record! Inventories are a key determinant for price and high inventories, at roughly 520 million barrels as tracked in the black line, correlate with low prices as tracked in the red line. Oil prices may be turning up and look to be giving near-term data a lift, but further gains will be limited by ever-building inventories.
 It was a light week for economic data with the only other key report turning out quite positive and offering a reminder of how strong the labor market has been. The first indication on March employment is very favorable with initial jobless claims down a very steep 18,000 in the March 5th week to 259,000 which is the lowest level since October. The 4-week average is also the lowest since October, down 2,500 to a 267,500 level that is down a very sizable 15,000 from this time last month. Continuing claims round out the good news, down 32,000 in lagging data for the February 27 week to 2.225 million for the second lowest reading of the year. The unemployment rate for insured workers, down 1 tenth to only 1.6 percent, is also very positive. This report will be offering arguments on the employment side to raise rates at the March FOMC. It was a light week for economic data with the only other key report turning out quite positive and offering a reminder of how strong the labor market has been. The first indication on March employment is very favorable with initial jobless claims down a very steep 18,000 in the March 5th week to 259,000 which is the lowest level since October. The 4-week average is also the lowest since October, down 2,500 to a 267,500 level that is down a very sizable 15,000 from this time last month. Continuing claims round out the good news, down 32,000 in lagging data for the February 27 week to 2.225 million for the second lowest reading of the year. The unemployment rate for insured workers, down 1 tenth to only 1.6 percent, is also very positive. This report will be offering arguments on the employment side to raise rates at the March FOMC.
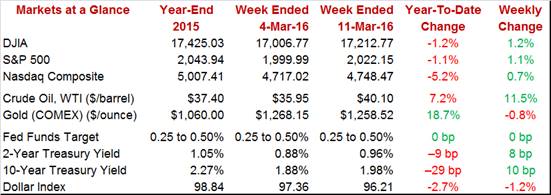
 There was no measurable reaction in the week to the election drama but there was a big reaction to what was in fact an unsurprising rate cut by the European Central Bank. The ECB issued a host of stimulus actions and could not possibly be blamed for once again not correctly signaling their intentions. But what in fact didn't live up to expectations was the press conference where ECB head Mario Draghi sent a counter signal, that the ECB cannot be relied on to extend such liberal stimulus in the future. Low rates and stimulus should be negatives for the euro which however rallied strongly and left the dollar index, not up in a week that the ECB eased, but down by 1.2 percent. One good thing is that the weakness of the dollar, down 2.7 percent year-to-date, will help the Fed in its efforts to stimulate inflation. Oil was the week's standout, rising 11.5 percent and back at $40 for WTI. Gains here fed gains for the stock market, where the Dow rose 1.2 percent, and pushed money back out of the safety of the Treasury market where the 10-year yield jumped 10 basis points in the week to 1.98 percent. There was no measurable reaction in the week to the election drama but there was a big reaction to what was in fact an unsurprising rate cut by the European Central Bank. The ECB issued a host of stimulus actions and could not possibly be blamed for once again not correctly signaling their intentions. But what in fact didn't live up to expectations was the press conference where ECB head Mario Draghi sent a counter signal, that the ECB cannot be relied on to extend such liberal stimulus in the future. Low rates and stimulus should be negatives for the euro which however rallied strongly and left the dollar index, not up in a week that the ECB eased, but down by 1.2 percent. One good thing is that the weakness of the dollar, down 2.7 percent year-to-date, will help the Fed in its efforts to stimulate inflation. Oil was the week's standout, rising 11.5 percent and back at $40 for WTI. Gains here fed gains for the stock market, where the Dow rose 1.2 percent, and pushed money back out of the safety of the Treasury market where the 10-year yield jumped 10 basis points in the week to 1.98 percent.
The labor market has held steady and solid since the last FOMC in January but there has been a favorable change for prices, one that mostly points to targeted gains ahead for inflation. The hawks at this month's FOMC will no doubt warn against acting too late on inflation while the doves, stressing market troubles and global risks, will likely want further proof.
The Fed, focused on market stress and global weakness, isn't expected to raise rates at this week's FOMC but the upturn underway for inflation and continued strength for the labor market will have to addressed. Inflation will get two important updates heading into Wednesday's statement, first producer prices on Tuesday followed by consumer prices on Wednesday where core rates for each are expected to show gains. Consumer spending gets an update on Tuesday with retail sales where core sales are expected to show continued strength. Permits will be the week's biggest data out of housing but are not expected to improve in what would be the latest disappointment for the sector. The factory sector has been a clear disappointment with no strength expected for either the industrial production report on Wednesday nor the Philly Fed report on Thursday. But it's the consumer that is the economy's strength and whether the election is affecting confidence could be signaled at the close of the week with Friday's consumer sentiment report.
Pulled down by extending declines for oil and commodities, the headline for February's producer prices report is expected to slip 0.2 percent following a 0.1 percent rise in January. Excluding food and energy, the core rate is expected to show less weakness, at a consensus plus 0.1 percent gain. Service readings in this report were very strong in the January report, underscoring the strength of domestic demand. Year-on-year, producer prices were down 0.2 percent in January with the core rate up at plus 0.6 percent.
PPI-FD - Consensus for February: -0.2%
Range: -0.5% to 0.0%
PPI-FD Less Food & Energy - Consensus for February: +0.1%
Range: -0.1% to +0.2%
PPI-FD Less Food, Energy & Trade Services - Consensus for February: +0.1%
Range: 0.0% to +0.3%
Weakness for auto sales and also for gasoline sales are expected to hold down retail sales which are otherwise expected to show solid strength, at plus 0.3 percent for February's ex-auto ex-gas core reading. This core rate has been holding up well and pointing to a continued solid contribution from consumer spending. Total sales are expected to fall 0.1 percent with ex-auto sales down 0.2 percent.
Retail Sales - Consensus for February: -0.1%
Range: -0.6% to +0.4%
Retail Sales Ex-Autos - Consensus for February: -0.2%
Range: -0.6% to +0.5%
Retail Sales Ex-Autos Ex-Gas - Consensus for February: +0.3%
Range: +0.1% to +0.6%
The Empire State report has been signaling weakness for the factory sector since way back in August with February's minus 16.64 one of the deeper disappointments. New orders have fallen for nine months in a row with employment down for eight months in a row. Forecasters see only marginal relief for March with the Econoday consensus at minus 11.25.
Empire State Index - Consensus Forecast for March: -11.25
Range: -15.00 to -7.00
Business inventories have been flat but not flat enough relative to sales which have been declining. Unwanted inventories are negatives for the production and employment outlooks.
Business Inventories - Consensus for December: 0.0%
Range: -0.1% to +0.3%
The housing market index has been losing steam but is nevertheless signaling that confidence among the nation's home builders is strong. The Econoday consensus is calling for a 1 point rebound in March to 59.0 following February's 3-point dip. The traffic component of this report, reflecting lack of first-time buyers, has been lagging badly.
Housing Market Index - Consensus Forecast for March: 59
Range: 58 to 60
Pulled down by February's contraction for gasoline prices, consumer prices are expected to fall 0.3 percent with the core rate however doing better at a 0.2 percent gain. Service-based gains were widespread in January and similar strength in February would further point to price recovery for the economy.
Consumer Price Index, M/M Chg - Consensus Forecast for February: -0.3%
Range: -0.3% to +0.1%
CPI Less Food & Energy, M/M Chg - Consensus Forecast for February +0.2%
Range: +0.1% to +0.2%
Housing starts & permits have been volatile month-to-month and, after showing prior strength, eased back in February. Econoday forecasters do see strength for starts, to a 1.146 million annualized rate in February from January's 1.099 million, but no change for permits at 1.202 million. Lack of strength for permits would be a new disappointment for the housing sector.
Housing Starts - Consensus Forecast for February: 1.146 million
Range: 1.110 to 1.177 million
Housing Permits - Consensus Forecast for February: 1.202 million
Range: 1.150 to 1.225 million
Gains in auto production and also capital goods production gave a strong 0.5 percent lift to manufacturing production back in January. But forecasters do not see strength extending into February where the consensus for this struggling sector is at zero. When including utilities and mining, a 0.2 percent decline is expected for the industrial production headline which in turn is expected to shave the capacity utilization rate by 2 tenths to 76.9 percent.
Industrial Production, M/M Chg - Consensus Forecast for February: -0.2%
Range: -0.8% to +0.2%
Manufacturing Production, M/M Chg - Consensus Forecast for January: 0.0%
Range: -0.1% to +0.3%
Capacity Utilization Rate - Consensus Forecast for January: 76.9%
Range: 76.5% to 77.5%
The Federal funds rate target is expected to remain unchanged at a range between 0.25 to 0.50 percent, where it was set at the December FOMC. Though some Fed officials have been pointing to the strength of recent inflation data, there are no expectations among Econoday's 12 forecasters for any change at the March meeting. Global risks were not cited in the December statement but they were called up at the January meeting and are expected to be pointed to again, as the pivotal reason for not raising rates. Today's statement will include quarterly economic forecasts and will be followed by Janet Yellen's press conference.
Federal Funds Rate Target - Consensus Forecast for March 15 & 16 Meeting: 0.25 to 0.50%
Range: 0.25 to 0.50% to 0.25 to 0.50%
Initial jobless claims are expected to bounce back to trend at 270,000 in the March 12th week after falling sharply in the prior week. Trends in this report have been moving lower after an unwanted rise at year end.
Initial Jobless Claims - Consensus Forecast for March 12 week: 270,000
Range: 265,000 to 279,000
The Philadelphia Fed manufacturing index is expected to extend a long series of declines with the Econoday forecast calling for a minus 1.4 March headline. At minus 2.8 in February, last month's reading was the sixth negative score in a row with the new orders index falling back to minus 5.3. Inventories have been down in this report and the six-month outlook has been easing, both pointing to defensive business expectations.
Philadelphia Fed Manufacturing Index - Consensus Forecast for March: -1.4
Range: -4.0 to +0.9
Boosted by improvements in income balances, the current account deficit is expected to narrow in the fourth quarter to $115.0 billion vs $124.1 billion in the third quarter.
Current Account Deficit - Consensus Forecast for Fourth Quarter: -$115.0 billion
Range: -$119.6 to -$110.0 billion
The index of leading indicators is expected to end two straight declines with a modest 0.2 percent gain for February. Building permits have been holding this index down but are expected to give February a push. Stock prices will also be a positive as will the report's yield spread and credit components.
Index of Leading Economic Indicators - Consensus Forecast for February: +0.2%
Range: +0.1% to +0.3%
The election campaign has yet to have measurable impact on the consumer sentiment index which, like other readings on consumer confidence, has been holding steady and reflecting strength in the labor market. Forecasters see a 5 tenths gain to 92.2 for the February flash.
Consumer Sentiment, Preliminary - Consensus for March: 92.2
Range: 90.0 to 93.0
|
