|
As other central banks increase stimulus, the Federal Reserve is holding stimulus steady which is a testament of sorts to the strength of the U.S. economy. But the Fed has now formally cut in half the expected number of incremental rate hikes for this year, from four to two. And given the touchy atmosphere of a presidential campaign, only one of these two is likely to occur, if at all, before the November election. Though still strong, the health of the economy has been downgraded by the Fed, to moderate in the March statement from solid in the January statement. But inflation was given a marginal upgrade, to low from moving lower. The latter doesn't sound like much but it was, along with the FOMC's generally dovish shift, apparently enough to trip the first dissent this year as Kansas City President Esther George lived up to her hawkish reputation and called for an immediate 25 basis point hike.
Inflation led the week's economic data, headlined by a 0.2 percent decline in the consumer price index for February where the year-on-year rate is far from terrifying, down 4 tenths to only plus 1.0 percent. But looking beyond the headline we find that the core rate, which strips out food and most importantly energy, rose 0.3 percent in the month which is much stronger than trend and nearly a five-year high. The year-on-year rate for this reading moved up 1 tenth and further beyond the Fed's 2.0 percent line, to 2.3 percent for a nearly three-year high. But it's not the CPI core, rather it is the PCE core which is strictly subject to the Fed's target, though this too has been on the increase, up 3 tenths in January's data to 1.7 percent which isn't that far at all from 2.0 percent.
 An unlikely one-time surge of 1.6 percent in apparel prices was a main factor in the rise for the core, an oddity which turns our attention to perhaps the most important area of inflation and that's services. The dark line in the graph tracks year-on-year service prices at the consumer level which as you can see have been on a climb, to just above the 2.5 percent line. Medical costs, especially for prescription drugs, are a key factor behind the inflation as, to a lesser extent, are housing costs. Note the consistency of the pressure at the service level, evident in the columns of the graph which track monthly change. The lack of variation here offers policy makers, as well as the rest of us, a base line for inflation expectations. An unlikely one-time surge of 1.6 percent in apparel prices was a main factor in the rise for the core, an oddity which turns our attention to perhaps the most important area of inflation and that's services. The dark line in the graph tracks year-on-year service prices at the consumer level which as you can see have been on a climb, to just above the 2.5 percent line. Medical costs, especially for prescription drugs, are a key factor behind the inflation as, to a lesser extent, are housing costs. Note the consistency of the pressure at the service level, evident in the columns of the graph which track monthly change. The lack of variation here offers policy makers, as well as the rest of us, a base line for inflation expectations.
 The counter weight to service prices has been commodity prices which have been in long contraction and led backwards, of course, by the collapse of oil prices. Services, once again the dark line, is flattened out in this graph because the vertical axis had to be extended downward (from minus 0.5 percent to minus 5.0 percent) to capture the deeply negative run for commodities, which is tracked in the light line. Commodities had been recovering back to the zero line until the oil collapse in February led to a retreat. But, importantly, oil this month has definitely been on the rise and the possibility of continued recovery, together with the consistency of service prices, would very likely point to the successful achievement of the Fed's inflation goal. The counter weight to service prices has been commodity prices which have been in long contraction and led backwards, of course, by the collapse of oil prices. Services, once again the dark line, is flattened out in this graph because the vertical axis had to be extended downward (from minus 0.5 percent to minus 5.0 percent) to capture the deeply negative run for commodities, which is tracked in the light line. Commodities had been recovering back to the zero line until the oil collapse in February led to a retreat. But, importantly, oil this month has definitely been on the rise and the possibility of continued recovery, together with the consistency of service prices, would very likely point to the successful achievement of the Fed's inflation goal.
 The consumer is especially sensitive to changes in oil prices, specifically changes in pump prices as Janet Yellen stressed at her press conference following the FOMC meeting. The dark line of the graph tracks 1-year expectations as measured by the University of Michigan and, in its flash for March already shows a significant uptick, from 2.5 percent to 2.7 percent. This directly reflects this month's gain in gasoline prices where the average, as measured by Automobile Association of America, is at $1.97 per gallon, up a very steep 25 cents from the February average. Business expectations, however, are less sensitive to changes in fuel prices as seen in the light line which tracks 1-year expectations as measured by the Atlanta Federal Reserve. Over the last two years, inflation expectations among businesses, in contrast to expectations among consumers, have remained nearly unchanged. The consumer is especially sensitive to changes in oil prices, specifically changes in pump prices as Janet Yellen stressed at her press conference following the FOMC meeting. The dark line of the graph tracks 1-year expectations as measured by the University of Michigan and, in its flash for March already shows a significant uptick, from 2.5 percent to 2.7 percent. This directly reflects this month's gain in gasoline prices where the average, as measured by Automobile Association of America, is at $1.97 per gallon, up a very steep 25 cents from the February average. Business expectations, however, are less sensitive to changes in fuel prices as seen in the light line which tracks 1-year expectations as measured by the Atlanta Federal Reserve. Over the last two years, inflation expectations among businesses, in contrast to expectations among consumers, have remained nearly unchanged.
 The government's central measure for inflation at the business level is the producer price report which was also released during the week. And here too, as indicated by the Atlanta Fed's expectations, prices are not showing as much life as on the consumer side. Year-on-year, the producer price index, at dead zero, is a full 1 percentage point below the CPI while the producer core rate, at plus 1.2 percent, is 1.1 percentage point behind the CPI core. Keeping our focus on the dichotomy between services and commodities, the breakdown at the wholesale level, as tracked in the graph, shows monthly weakness for both with services ending three months of gains with no change and goods prices down for a third time in a row and the seventh time of the last eight months. All together, these inflation readings are subdued though led by service inflation at the consumer level and including what looks to be an oil-based commodity gain for March, they do hint at an upward climb. This, perhaps with full employment and the reasonable risk of wage inflation, may have been what Kansas City's George felt uncomfortable with. The government's central measure for inflation at the business level is the producer price report which was also released during the week. And here too, as indicated by the Atlanta Fed's expectations, prices are not showing as much life as on the consumer side. Year-on-year, the producer price index, at dead zero, is a full 1 percentage point below the CPI while the producer core rate, at plus 1.2 percent, is 1.1 percentage point behind the CPI core. Keeping our focus on the dichotomy between services and commodities, the breakdown at the wholesale level, as tracked in the graph, shows monthly weakness for both with services ending three months of gains with no change and goods prices down for a third time in a row and the seventh time of the last eight months. All together, these inflation readings are subdued though led by service inflation at the consumer level and including what looks to be an oil-based commodity gain for March, they do hint at an upward climb. This, perhaps with full employment and the reasonable risk of wage inflation, may have been what Kansas City's George felt uncomfortable with.
 Retail sales were also posted in the week and were mixed. Total sales in February were held down by a big dollar drop in gasoline sales, the result of the month's price collapse for oil. Vehicle sales, where sales have been very strong, eased slightly in the month in what was another negative for total sales. Outside gasoline and vehicles, however, retail sales did show some life with a 0.3 percent gain which, as tracked in the red line of the graph, lifted the year-on-year rate by a very sizable 7 tenths to plus 4.3 percent. If vehicle sales, which have been flat the last several months, start picking back up again, we can expect core retail sales to further pick up, perhaps enough for the Fed to upgrade the economy back to "solid" from "moderate". Retail sales were also posted in the week and were mixed. Total sales in February were held down by a big dollar drop in gasoline sales, the result of the month's price collapse for oil. Vehicle sales, where sales have been very strong, eased slightly in the month in what was another negative for total sales. Outside gasoline and vehicles, however, retail sales did show some life with a 0.3 percent gain which, as tracked in the red line of the graph, lifted the year-on-year rate by a very sizable 7 tenths to plus 4.3 percent. If vehicle sales, which have been flat the last several months, start picking back up again, we can expect core retail sales to further pick up, perhaps enough for the Fed to upgrade the economy back to "solid" from "moderate".
 The biggest surprise of the week came from the economy's trouble spot, the factory sector. The Philly Fed index ended six months of straight and sometimes very heavy losses with a stunning 12.4 surge back into positive territory for March. The gain was supported by similar strength in new orders, a gain that hints at recovery for exports and perhaps even for energy equipment. And the Philly Fed report is not isolated as the Empire State report also posted a sudden move into positive ground. Here too new orders are the big highlight, one that points to widening strength for both production and employment in the months ahead. The biggest surprise of the week came from the economy's trouble spot, the factory sector. The Philly Fed index ended six months of straight and sometimes very heavy losses with a stunning 12.4 surge back into positive territory for March. The gain was supported by similar strength in new orders, a gain that hints at recovery for exports and perhaps even for energy equipment. And the Philly Fed report is not isolated as the Empire State report also posted a sudden move into positive ground. Here too new orders are the big highlight, one that points to widening strength for both production and employment in the months ahead.
 The Philly Fed and Empire State reports are the first signals for factory activity during the month, and a look back at February shows definitive evidence of recovery. The manufacturing component of the industrial production report posted a surprising 2 tenths gain which came on top of January's stunning gain of 0.5 percent. Exports aren't specifically tracked in any of these reports but the implication is clear, that this year's steep and early decline in the dollar, down 3.8 percent on the dollar index, is making our exports less expensive to our foreign customers. The graph tracks the index value of the manufacturing component against monthly dollar totals for exports. These totals, as you can see, have been sinking sharply for more than a year in what, by contrast, underscores the isolated and formidable strength of domestic demand. Yet the drop in the dollar has been accelerating, falling more than 1 percent in reaction to the week's dovish FOMC and what hints at, perhaps, a long-needed recovery for exports. The Philly Fed and Empire State reports are the first signals for factory activity during the month, and a look back at February shows definitive evidence of recovery. The manufacturing component of the industrial production report posted a surprising 2 tenths gain which came on top of January's stunning gain of 0.5 percent. Exports aren't specifically tracked in any of these reports but the implication is clear, that this year's steep and early decline in the dollar, down 3.8 percent on the dollar index, is making our exports less expensive to our foreign customers. The graph tracks the index value of the manufacturing component against monthly dollar totals for exports. These totals, as you can see, have been sinking sharply for more than a year in what, by contrast, underscores the isolated and formidable strength of domestic demand. Yet the drop in the dollar has been accelerating, falling more than 1 percent in reaction to the week's dovish FOMC and what hints at, perhaps, a long-needed recovery for exports.
 Retail sales may be on the rise and the factory sector may be set to move higher, but the outlook for housing unfortunately isn't so great. Housing starts did rise in February to a 1.178 million annualized rate as seen in the far right column of the graph but not permits which, as tracked in the line of the graph, extended recent weakness with a sharp 3.1 percent decline to a 1.167 million rate. The weakness in permits is centered in multi-family units which tumbled 8.4 percent in the month and which points to dwindling investment demand for rental properties. Retail sales may be on the rise and the factory sector may be set to move higher, but the outlook for housing unfortunately isn't so great. Housing starts did rise in February to a 1.178 million annualized rate as seen in the far right column of the graph but not permits which, as tracked in the line of the graph, extended recent weakness with a sharp 3.1 percent decline to a 1.167 million rate. The weakness in permits is centered in multi-family units which tumbled 8.4 percent in the month and which points to dwindling investment demand for rental properties.
 When stripping out multi-family units and looking solely at single-family homes, the news, at least for permits, is less downbeat. Permits for single-family homes, tracked in the line of the graph, rose 0.4 percent to an annualized rate of 731,000. But the slope of the line, following a steep upward run over the last year, has been flattening out which does not point, unfortunately, to much easing in the shortage of new homes. New home sales, tracked in the columns, have been struggling due in part to lack of supply and, looking beyond monthly volatility which is common for this series, really hasn't shown much improvement from this time last year. The housing sector, which was billed to be a positive force for the 2016 economy, is getting off to a slow start this year. When stripping out multi-family units and looking solely at single-family homes, the news, at least for permits, is less downbeat. Permits for single-family homes, tracked in the line of the graph, rose 0.4 percent to an annualized rate of 731,000. But the slope of the line, following a steep upward run over the last year, has been flattening out which does not point, unfortunately, to much easing in the shortage of new homes. New home sales, tracked in the columns, have been struggling due in part to lack of supply and, looking beyond monthly volatility which is common for this series, really hasn't shown much improvement from this time last year. The housing sector, which was billed to be a positive force for the 2016 economy, is getting off to a slow start this year.
 Given the universal revulsion toward the nation's labor market as expressed in this year's political campaign, you would never guess that unemployment claims are at or near historic lows – which simply means that layoffs are down and employment is up. Initial claims in the March 12th week, which is also the sample week for the monthly employment report, came in at only 265,000 with the 4-week average at 268,000. Both of these readings are very little changed from those taken last month during the sample week of the February employment report. What's the upshot? That the first indications for the March employment report are very positive, that the report should match the strong gains of the February report. Funny none of the candidates, in all their endless bluster, have yet to mention unemployment claims. Given the universal revulsion toward the nation's labor market as expressed in this year's political campaign, you would never guess that unemployment claims are at or near historic lows – which simply means that layoffs are down and employment is up. Initial claims in the March 12th week, which is also the sample week for the monthly employment report, came in at only 265,000 with the 4-week average at 268,000. Both of these readings are very little changed from those taken last month during the sample week of the February employment report. What's the upshot? That the first indications for the March employment report are very positive, that the report should match the strong gains of the February report. Funny none of the candidates, in all their endless bluster, have yet to mention unemployment claims.
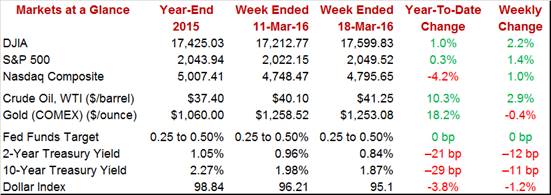
 A stimulative Fed together with respectable strength in the economy continue drove up risk appetite. The Dow ended the week with a gain of 2.2 percent to 17,599 and is suddenly up 1 percent on the year. But the pivotal move in the week was in the dollar which fell 1.2 percent on the dollar index to 95.10. The decline in the dollar, at 3.8 percent so far this year, points directly at a rebound for exports and, also perhaps, for some badly needed imported inflation. Oil ended the week with a 2.9 percent rise to $41.25 and, in an indication of inflation to come, is up 10.3 percent on the year. With no fear of a dovish Fed, rates moved sharply lower in the week with the 2-year yield down 12 basis points to 0.84 percent and the 10-year down 11 basis points to 1.87 percent. A stimulative Fed together with respectable strength in the economy continue drove up risk appetite. The Dow ended the week with a gain of 2.2 percent to 17,599 and is suddenly up 1 percent on the year. But the pivotal move in the week was in the dollar which fell 1.2 percent on the dollar index to 95.10. The decline in the dollar, at 3.8 percent so far this year, points directly at a rebound for exports and, also perhaps, for some badly needed imported inflation. Oil ended the week with a 2.9 percent rise to $41.25 and, in an indication of inflation to come, is up 10.3 percent on the year. With no fear of a dovish Fed, rates moved sharply lower in the week with the 2-year yield down 12 basis points to 0.84 percent and the 10-year down 11 basis points to 1.87 percent.
The economy is not nearly so fragile as the public apparently believes. Service inflation is a steady positive and commodity inflation looks to become a new positive. Consumer spending is solid and the factory sector may finally be poised for a push higher. These factors are probably not strong enough to signal a break out for economic growth but are enough to make some of the hawks among us a little edgy.
It will be light week for the calendar but one focused largely on housing with existing home sales posted on Monday and new home sales on Wednesday. Neither has shown much punch of late and forecasters see mixed results for the February reports. Tuesday will see the FHFA house price index which also hasn't been showing much strength, though here improvement is expected. The factory outlook is another focus of the week with updates on Tuesday from the manufacturing PMI and also the Richmond Fed followed on Thursday by the week's highlight: the durable goods report which, despite the prior week's strength in the manufacturing component of the industrial production report, is expected to show declines.
Both the employment report and the manufacturing component of the industrial production report showed strength in February and are expected to support the national activity index which is expected to come in at plus 0.25. This would be low by historical standard but not by recent standards.
National Activity Index for February:
Consensus Forecast: +0.25
Consensus Range: +0.25 to +0.28
Existing home sales have been solid but haven't been accelerating, basically holding at a mid-to-low 5 million unit annual rate for the last year. In one sign of strength, single-home sales have been accelerating relative to condo sales which hints at strength for household wealth. Prices have been rising but less so than sales which points to discounting. And prices haven't been high enough to bring homes into the market as available supply remains very low. Forecasters see existing home sales coming in at a 5.305 million annualized rate in February, down noticeably from January's 5.470 million.
Existing Home Sales, Annualized Rate for February:
Consensus Forecast 5.305 million
Consensus Range: 5.200 to 5.550 million
FHFA house price index did rise a monthly 0.4 percent in the prior report but year-on-year gain moved back from 6.0 percent. Fewer homeowners expect to see significant appreciation this year which, given weakness in wages, is a negative for the economy. The Econoday consensus, however, is calling for a sizable 0.6 percent monthly gain in the January report.
FHFA House Price Index for January:
Consensus Forecast: +0.6%
Consensus Range: +0.4% to +0.6%
Early indications on the March factory sector have been surprisingly solid with both the Empire State and Philly Fed reports emerging from a long run of contraction. And forecasters see a rebound for the flash manufacturing PMI which is expected to rise sharply to 52.4 vs an unusually low 51.3 in the final reading for February. Comparisons with February are easy as growth in new orders was at a 3-1/2 year low and with backlogs and exports also weak. Selling prices were also at a 3-1/2 low.
Manufacturing PMI, Flash for March:
Consensus Forecast 52.4
Consensus Range: 51.5 to 52.5
The Empire State and Philly Fed reports both ended long runs of contraction with positive indications for March, yet positives are not expected for the Richmond Fed's manufacturing index which is expected to come in at zero to indicate no change relative to February. Richmond had been holding up better than other regional reports but it did slide in February, to minus 4 with both new orders and backlog orders moving into contraction.
Richmond Fed Manufacturing Index for February:
Consensus Forecast: 0
Consensus Range: -2 to 3
Showing no momentum, new home sales have been struggling to hold above a 500,000 annualized pace over the past year. And price discounting may be accelerating with the year-on-year median down nearly 5 percent in the January report. Permits for new homes had been climbing but are now flattening out, not getting much boost from pricing but also reflecting lack of available lots as well as supply constraints in the construction sector. Forecasters see February sales at a 510,000 rate in what would be a small but still welcome gain from January's 494,000.
New Home Sales, Annualized Rate for February:
Consensus Forecast: 510,000
Consensus Range: 489,000 to 530,000
Indications on the factory sector had been weak going into 2016 but the manufacturing component of the industrial production report showed life in both January and February while durable goods orders showed broad gains in January. But forecasters do not see durable orders extending the improvement in February with the consensus at minus 3.0 percent and at minus 0.2 percent for ex-transportation orders. Core capital goods orders did bounce back solidly in January but a resumption of weakening is the call for February, weakening that could lower expectations for first-quarter business investment. Even if the report does prove weak, the ongoing decline in the dollar points to a lift ahead for exports.
Durable Goods Orders, M/M Chg for February:
Consensus Forecast: -3.0%
Consensus Range: -6.0% to +0.2%
Durable Goods Orders, Ex-Transportation, M/M Chg for February:
Consensus Forecast: -0.2%
Consensus Range: -1.0% to +0.8%
Initial jobless claims have been holding near record lows and are pointing to another month of solid employment growth. The Econoday consensus for the March 19th week is 268,000 vs 265,000 in the March 12th week. The March 12th week was the sample week for the March employment report and is also the reporting week for continuing claims in this report. Continuing claims, like initial claims, have been holding at historic lows.
Initial Jobless Claims for March 19 week:
Consensus Forecast: 268,000
Consensus Range: 260,000 to 272,000
The third estimate of fourth-quarter GDP is expected to come in unchanged from the second estimate at a plus 1.0 percent annualized rate. But gains for the quarterly services survey could give a boost to personal consumption expenditures which slipped to an annualized plus 2.0 percent in the second estimate vs 2.2 percent in the initial estimate. A gain here, even though it's data for the fourth quarter, could improve the outlook for consumer spending. Other readings in the fourth quarter included weakness in non-residential investment that was offset by strength on the residential side. The GDP price index is expected to remain unchanged at plus 0.9 percent.
Real GDP, 4th Quarter, 3rd Estimate, Annualized Rate:
Consensus Forecast: +1.0%
Consensus Range: +0.7% to +1.3%
GDP Price Index, 4th Quarter, 3rd Estimate:
Consensus Forecast: +0.9%
Consensus Range: +0.9% to +1.0%
|
