|
Most equity indices retreated in a week that was strewn with holidays in Asia and Europe. Global growth angst gave investors an excuse to be risk averse. And some economic data reinforced risk aversity. In Asia, the China watch continued and in Europe, Brexit along with a continuation of Greek woes addled investors. And globally, mixed earnings reports also weighed as the season draws to a close. Only the All Ordinaries (0.8 percent) managed to record a gain for the week. All other indexes retreated on the week.
The global equity rally appeared to be faltering as investors gauged prospects for higher U.S. interest rates amid persistent signs of tepid to slowing growth in the major developed economies. While Fed officials signaled in recent days that borrowing costs could rise as soon as June, futures traders assigned only a 10 percent probability for such a move after recent data indicated the U.S. economy remains sluggish.
| |
|
2015 |
2016 |
% Change |
|
Index |
Dec 31 |
Apr 29 |
May 6 |
Week |
2016 |
| Asia/Pacific |
|
|
|
|
|
|
| Australia |
All Ordinaries |
5344.6 |
5316.0 |
5358.57 |
0.8% |
0.3% |
| Japan |
Nikkei 225 |
19033.7 |
16666.1 |
16106.72 |
-3.4% |
-15.4% |
| Hong Kong |
Hang Seng |
21914.4 |
21067.1 |
20109.87 |
-4.5% |
-8.2% |
| S. Korea |
Kospi |
1961.3 |
1994.2 |
1976.71 |
-0.9% |
0.8% |
| Singapore |
STI |
2882.7 |
2838.5 |
2730.80 |
-3.8% |
-5.3% |
| China |
Shanghai Composite |
3539.2 |
2938.3 |
2913.25 |
-0.9% |
-17.7% |
|
|
|
|
|
|
|
| India |
Sensex 30 |
26117.5 |
25606.6 |
25228.50 |
-1.5% |
-3.4% |
| Indonesia |
Jakarta Composite |
4593.0 |
4838.6 |
4822.60 |
-0.3% |
5.0% |
| Malaysia |
KLCI |
1692.5 |
1672.7 |
1649.36 |
-1.4% |
-2.5% |
| Philippines |
PSEi |
6952.1 |
7159.3 |
6991.87 |
-2.3% |
0.6% |
| Taiwan |
Taiex |
8338.1 |
8377.9 |
8146.43 |
-2.8% |
-2.3% |
| Thailand |
SET |
1288.0 |
1404.6 |
1390.70 |
-1.0% |
8.0% |
|
|
|
|
|
|
|
| Europe |
|
|
|
|
|
|
| UK |
FTSE 100 |
6242.3 |
6241.9 |
6125.70 |
-1.9% |
-1.9% |
| France |
CAC |
4637.1 |
4429.0 |
4301.24 |
-2.9% |
-7.2% |
| Germany |
XETRA DAX |
10743.0 |
10039.0 |
9869.95 |
-1.7% |
-8.1% |
| Italy |
FTSE MIB |
21418.4 |
18600.6 |
17842.80 |
-4.1% |
-16.7% |
| Spain |
IBEX 35 |
9544.2 |
9025.7 |
8702.10 |
-3.6% |
-8.8% |
| Sweden |
OMX Stockholm 30 |
1446.8 |
1360.7 |
1309.17 |
-3.8% |
-9.5% |
| Switzerland |
SMI |
8818.1 |
7960.9 |
7735.60 |
-2.8% |
-12.3% |
|
|
|
|
|
|
|
| North America |
|
|
|
|
|
|
| United States |
Dow |
17425.0 |
17773.6 |
17740.63 |
-0.2% |
1.8% |
|
NASDAQ |
5007.4 |
4775.4 |
4736.16 |
-0.8% |
-5.4% |
|
S&P 500 |
2043.9 |
2065.3 |
2057.14 |
-0.4% |
0.6% |
| Canada |
S&P/TSX Comp. |
13010.0 |
13951.5 |
13701.47 |
-1.8% |
5.3% |
| Mexico |
Bolsa |
42977.5 |
45784.8 |
45209.850 |
-1.3% |
5.2% |
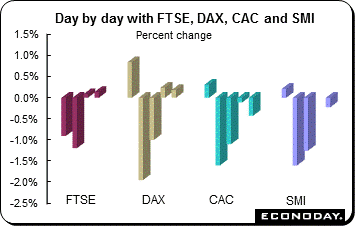 Equities retreated in a holiday shortened trading week for the SMI and FTSE. The FTSE was down for a third consecutive week while the DAX, CAC and SMI were down for a second. The FTSE tumbled 1.9 percent, the DAX retreated 1.7 percent, the CAC lost 2.9 percent and the SMI declined 2.8 percent. Trading during the week was light with growth fears stalking investors and sending shares lower. On Friday, the (disappointing) U.S. employment report headline also weighed on risk-takers. However, the markets then rallied and entered positive territory with mixed results. U.S. job growth (up 160,000) appears to have cemented the opinion among investors that the Federal Reserve will leave interest rate unchanged in June. Equities retreated in a holiday shortened trading week for the SMI and FTSE. The FTSE was down for a third consecutive week while the DAX, CAC and SMI were down for a second. The FTSE tumbled 1.9 percent, the DAX retreated 1.7 percent, the CAC lost 2.9 percent and the SMI declined 2.8 percent. Trading during the week was light with growth fears stalking investors and sending shares lower. On Friday, the (disappointing) U.S. employment report headline also weighed on risk-takers. However, the markets then rallied and entered positive territory with mixed results. U.S. job growth (up 160,000) appears to have cemented the opinion among investors that the Federal Reserve will leave interest rate unchanged in June.
Most of the week's regional economic data revolved around the April manufacturing, services and composite PMIs. For the Eurozone composite in April (53.0), there was a minimal deceleration in growth from March (53.1). The final service sector PMI was unchanged from March while manufacturing edged up to 51.7 from 51.6. Regionally in terms of the composite output index, the best performer was Spain (55.2) ahead of Germany (53.6) and Italy (53.1). France (50.2) at least moved back above the 50 mark but still lagged well behind the Eurozone average.
The European Central Bank said the economic recovery is expected to proceed on domestic demand and investment, but cautioned that the recovery is weighed down by ongoing balance sheet adjustments. The ECB said that domestic demand in particular continues to be supported by the ECB's monetary policy measures. Their favorable impact on financing conditions along with improvements in corporate profitability is underpinning investment. At the same time, accommodative monetary policy stance and employment gains together with low oil prices lift household disposable income. Nonetheless, the ECB said the recovery is still dampened by the balance sheet adjustments in a number of sectors. The risks to the euro area growth outlook still remain tilted to the downside.
The executive arm of the European Union cut the euro area growth forecast for this year to 1.6 percent from 1.7 percent in its spring 2016 Economic Forecast. The growth projection for the EU for this year was reduced to 1.8 percent from 1.9 percent. The outlook for the next year was cut to 1.9 percent from 2 percent. Eurozone growth and inflation is expected to be less than what was projected earlier as high debt levels and insufficient structural reforms on a domestic level and the deteriorating global environment could hurt the economic prospects. The inflation forecast for this year was lowered to 0.2 percent from 0.5 percent. The outlook for the next year was cut to 1.4 percent from 1.5 percent.
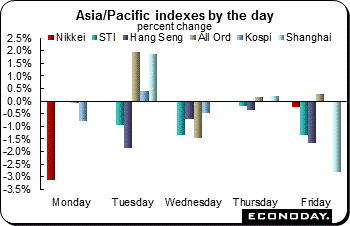 Equities declined in a week that saw the key markets closed for holidays throughout the week. Only the All Ordinaries managed to increase (0.8 percent) for the week. Traders were wary as they waited for the U.S. employment report which would be released after markets here were closed for the week. Weekly losses ranged from 0.3 percent (Jakarta Composite) to 4.5 percent (Hang Seng). In addition the Nikkei, which only traded for two days during the week, lost 3.4 percent and the STI was 3.8 percent lower. Equities declined in a week that saw the key markets closed for holidays throughout the week. Only the All Ordinaries managed to increase (0.8 percent) for the week. Traders were wary as they waited for the U.S. employment report which would be released after markets here were closed for the week. Weekly losses ranged from 0.3 percent (Jakarta Composite) to 4.5 percent (Hang Seng). In addition the Nikkei, which only traded for two days during the week, lost 3.4 percent and the STI was 3.8 percent lower.
The Shanghai Composite lost 0.9 percent on the week after a string of disappointing economic data including manufacturing and services PMIs for April. The Markit manufacturing PMI slipped further into contraction with a reading of 49.4, down from 49.7 in March. And the 'official' CFLP PMI barely clung to growth with a reading of 50.1, down from 50.2.
In Japan, the PMI for April contracted to 48.2 in April down from 49.1 in March, in part due to the mid-month earthquakes in southern Japan's manufacturing region.
Reserve Bank of Australia
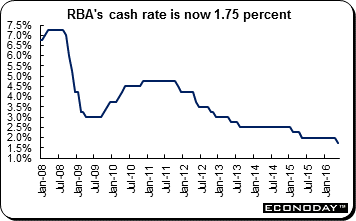 The Reserve Bank of Australia Board decided to lower its cash rate by 25 basis points to 1.75 percent. The move follows first quarter consumer price data that indicated inflationary pressures are lower than expected. In its statement, the RBA said that the Board took careful note of developments in the housing market, where indications are that the effects of supervisory measures are strengthening lending standards and that price pressures have tended to abate. The Board noted that the potential risks of lower interest rates in this area are less than they were a year ago. Therefore, the Board judged that prospects for sustainable growth with inflation returning to target of 2 percent to 3 percent over time would be improved by easing monetary policy at this meeting. The Reserve Bank of Australia Board decided to lower its cash rate by 25 basis points to 1.75 percent. The move follows first quarter consumer price data that indicated inflationary pressures are lower than expected. In its statement, the RBA said that the Board took careful note of developments in the housing market, where indications are that the effects of supervisory measures are strengthening lending standards and that price pressures have tended to abate. The Board noted that the potential risks of lower interest rates in this area are less than they were a year ago. Therefore, the Board judged that prospects for sustainable growth with inflation returning to target of 2 percent to 3 percent over time would be improved by easing monetary policy at this meeting.
Monetary policy has been accommodative for quite some time. Low interest rates have been supporting demand and the lower exchange rate overall has helped the traded sector. Credit growth to households continues at a moderate pace, while that to businesses has picked up over the past year or so. These factors are all assisting the economy to make the necessary economic adjustments, though an appreciating exchange rate could complicate this.
The RBA released its latest quarterly Statement on Monetary Policy (SoMP) for May at the end of the week. While its growth and unemployment forecasts were left unchanged compared to its February report, the Banks' inflation forecasts are more dovish. There is always considerable interest in the Bank's SoMP forecasts as they offer the clearest guidance to its policy inclinations. That is even more the case this month given the May rate cut and the somewhat limited guidance in the Governor's statement accompanying the move.
The Reserve Bank of Australia cut its inflation forecast for 2016 triggering a drop in the Australian dollar even though economic growth forecasts were left unchanged. The RBA expects underlying inflation to be between 1 to 2 percent this year, rising to between 1.5 and 2.5 percent in 2017. That is down from the 2 percent originally envisaged for 2016. Its official target range for headline inflation is between 2 and 3 percent. The most recent data showed that headline inflation was 1.3 percent from a year ago in the March quarter, down from 1.7 percent in the final three months of 2015. Core inflation was running at annualized pace of 1.5 percent in the first three months of this year.
Philip Lowe will replace Glenn Stevens as governor of the Reserve Bank of Australia for a seven-year term on September 18. Lowe inherits the post with diminished interest rate ammunition after the central bank eased policy to a record low to cushion the end of a mining investment boom and combat disinflation.
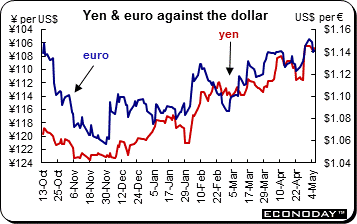 The U.S. dollar advanced against all of its major counterparts including the yen, euro, pound sterling, Swiss franc and the Canadian and Australian dollars. The dollar has weakened this year as the Federal Reserve pared back its expectations for Fed funds rate increases, citing sluggish domestic growth and risks from abroad. Expectations for lower rates weighed on the dollar by making it less attractive to yield-seeking investors. Analysts say the Fed needs to see continued improvement in economic data and evidence that inflation is firming before it resumes tightening. The U.S. dollar advanced against all of its major counterparts including the yen, euro, pound sterling, Swiss franc and the Canadian and Australian dollars. The dollar has weakened this year as the Federal Reserve pared back its expectations for Fed funds rate increases, citing sluggish domestic growth and risks from abroad. Expectations for lower rates weighed on the dollar by making it less attractive to yield-seeking investors. Analysts say the Fed needs to see continued improvement in economic data and evidence that inflation is firming before it resumes tightening.
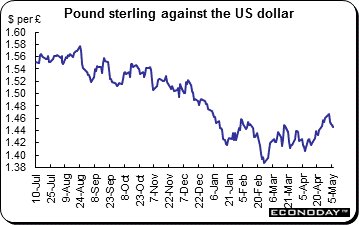 The pound suffered its biggest decline in six weeks as a raft of data added to signs the economy is stagnating before the referendum on June 23 that will decide Britain's relationship with the European Union. As well as posting its first five-day loss against the U.S. dollar since April 8, sterling had back-to-back weekly declines against the euro. One reason is that economic data have disappointed given the increasing uncertainty about Brexit. The pound suffered its biggest decline in six weeks as a raft of data added to signs the economy is stagnating before the referendum on June 23 that will decide Britain's relationship with the European Union. As well as posting its first five-day loss against the U.S. dollar since April 8, sterling had back-to-back weekly declines against the euro. One reason is that economic data have disappointed given the increasing uncertainty about Brexit.
The pound is bearing the brunt of concern that a potential exit from the European Union is already hurting the economy. Gilts have been supported as a haven and by speculation a Brexit would prompt the Bank of England to keep rates at a record-low for longer. The BoE and the government are among those to have warned that the vote next month is weighing on confidence and investment.
|
|
2015 |
2016 |
% Change |
|
|
Dec 31 |
Apr 29 |
May 6 |
Week |
2016 |
| U.S. $ per currency |
|
|
|
|
|
|
| Australia |
A$ |
0.7288 |
0.761 |
0.737 |
-3.2% |
1.1% |
| New Zealand |
NZ$ |
0.6833 |
0.698 |
0.684 |
-2.0% |
0.1% |
| Canada |
C$ |
0.7231 |
0.797 |
0.774 |
-2.9% |
7.0% |
| Eurozone |
euro (€) |
1.0871 |
1.145 |
1.140 |
-0.4% |
4.9% |
| UK |
pound sterling (£) |
1.4742 |
1.461 |
1.443 |
-1.3% |
-2.1% |
|
|
|
|
|
|
|
| Currency per U.S. $ |
|
|
|
|
|
|
| China |
yuan |
6.4937 |
6.478 |
6.496 |
-0.3% |
0.0% |
| Hong Kong |
HK$* |
7.7501 |
7.757 |
7.761 |
-0.1% |
-0.1% |
| India |
rupee |
66.1537 |
66.330 |
66.555 |
-0.3% |
-0.6% |
| Japan |
yen |
120.2068 |
106.410 |
107.120 |
-0.7% |
12.2% |
| Malaysia |
ringgit |
4.2943 |
3.905 |
4.004 |
-2.5% |
7.2% |
| Singapore |
Singapore $ |
1.4179 |
1.345 |
1.362 |
-1.2% |
4.1% |
| South Korea |
won |
1175.0600 |
1139.400 |
1169.720 |
-2.6% |
0.5% |
| Taiwan |
Taiwan $ |
32.8620 |
32.270 |
32.390 |
-0.4% |
1.5% |
| Thailand |
baht |
36.0100 |
34.880 |
35.120 |
-0.7% |
2.5% |
| Switzerland |
Swiss franc |
1.0014 |
0.9591 |
0.9720 |
-1.3% |
3.0% |
| *Pegged to U.S. dollar |
|
|
|
|
|
|
| Source: Bloomberg |
|
|
|
|
|
|
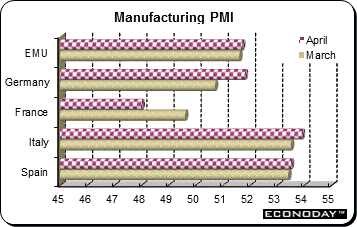 April Eurozone manufacturing PMI reading was 51.7, 0.1 points above its final March print. However, the index is still consistent with only sluggish growth of business activity. Despite the near-stable headline index, rates of expansion for both production and new orders were down compared with the end of the first quarter. Nonetheless, manufacturers still saw a modest accumulation of backlogs and, particularly promisingly, an increase in employment was the sharpest since January. Job creation has now been positive for some 20 consecutive months. However, inflation news remains negative. Input costs dropped, albeit at the slowest pace in four months, and a decline in aggregate factory gate prices reflected widespread decreases among the member states. Regionally, the best performing country was Italy (53.9) ahead of Spain (53.5) and the Netherlands (52.6). Germany (51.8) at least returned another reading above 50 but the contraction in French industry (48.0) was the most marked in a year. April Eurozone manufacturing PMI reading was 51.7, 0.1 points above its final March print. However, the index is still consistent with only sluggish growth of business activity. Despite the near-stable headline index, rates of expansion for both production and new orders were down compared with the end of the first quarter. Nonetheless, manufacturers still saw a modest accumulation of backlogs and, particularly promisingly, an increase in employment was the sharpest since January. Job creation has now been positive for some 20 consecutive months. However, inflation news remains negative. Input costs dropped, albeit at the slowest pace in four months, and a decline in aggregate factory gate prices reflected widespread decreases among the member states. Regionally, the best performing country was Italy (53.9) ahead of Spain (53.5) and the Netherlands (52.6). Germany (51.8) at least returned another reading above 50 but the contraction in French industry (48.0) was the most marked in a year.
 March retail sales declined a monthly 0.5 percent, the first decline since October last year and the steepest since July 2014. Annual workday adjusted growth was 2.1 percent, down from 2.7 percent last time. Weakness was relatively broad-based. Purchases of food, drink & tobacco dropped 1.3 percent, effectively reversing gains of the previous three months. Excluding auto fuel, non-food sales decreased 0.5 percent. Auto fuel was down 0.4 percent, its second contraction in the last three months. Regionally nearly all Eurozone member states saw monthly declines. Germany (minus 1.1 percent) and France (minus 0.7 percent) weighed particularly heavily but the steepest fall was in Portugal (minus 5.2 percent), albeit after a cumulative increase of more than 9 percent in January/February. March retail sales declined a monthly 0.5 percent, the first decline since October last year and the steepest since July 2014. Annual workday adjusted growth was 2.1 percent, down from 2.7 percent last time. Weakness was relatively broad-based. Purchases of food, drink & tobacco dropped 1.3 percent, effectively reversing gains of the previous three months. Excluding auto fuel, non-food sales decreased 0.5 percent. Auto fuel was down 0.4 percent, its second contraction in the last three months. Regionally nearly all Eurozone member states saw monthly declines. Germany (minus 1.1 percent) and France (minus 0.7 percent) weighed particularly heavily but the steepest fall was in Portugal (minus 5.2 percent), albeit after a cumulative increase of more than 9 percent in January/February.
 March retail sales were up 0.4 percent on the month after increasing 0.1 percent in February. Retail turnover was up 2.6 percent when compared with the same month a year ago. Among the subcategories that increased on the month were food (0.6 percent), clothing, footwear & personal accessory (1.1 percent), other retailing (0.4 percent) and household goods (0.1 percent). Turnover in cafes, restaurants & takeaway food services was relatively unchanged while department stores were down 0.5 percent. In seasonally adjusted volume terms, turnover rose 0.5 percent in the March quarter 2016, following an increase of 0.6 percent in the December quarter 2015. The largest contributor to the increase was clothing, footwear & personal accessories retailing. March retail sales were up 0.4 percent on the month after increasing 0.1 percent in February. Retail turnover was up 2.6 percent when compared with the same month a year ago. Among the subcategories that increased on the month were food (0.6 percent), clothing, footwear & personal accessory (1.1 percent), other retailing (0.4 percent) and household goods (0.1 percent). Turnover in cafes, restaurants & takeaway food services was relatively unchanged while department stores were down 0.5 percent. In seasonally adjusted volume terms, turnover rose 0.5 percent in the March quarter 2016, following an increase of 0.6 percent in the December quarter 2015. The largest contributor to the increase was clothing, footwear & personal accessories retailing.
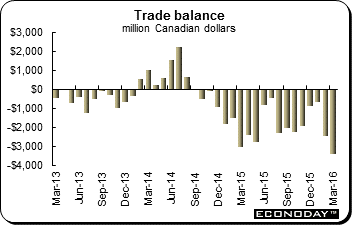 The March merchandise trade deficit was a record C$3.41 billion after a significantly larger revised deficit of C$2.47 billion in February. Exports were down 4.8 percent from February while imports were off 2.4 percent. Sales to the U.S. tumbled 6.3 percent which, with imports 4.8 percent lower, reduced the bilateral surplus from C$2.12 billion to C$1.53 billion, its smallest print since December 1993. The widening in the nominal shortfall was mirrored in the real trade balance where a 2.9 percent monthly decline in export volumes easily more than offset a 0.3 percent dip in imports. Among the major export product categories, 10 of the 11 subsectors posted monthly losses. Notable among these were motor vehicles & parts (6.0 percent), consumer goods (4.6 percent) and metal & non-metallic mineral products (5.4 percent). Industrial parts & machinery (down 7.1 percent), electronic & electrical equipment & parts (down 4.6 percent) and metal ores & non-metallic minerals (down 15.1 percent) also had a bad month. At the same time, imports were hit especially hard by aircraft & other transportation equipment & parts (down 20.4 percent). The March merchandise trade deficit was a record C$3.41 billion after a significantly larger revised deficit of C$2.47 billion in February. Exports were down 4.8 percent from February while imports were off 2.4 percent. Sales to the U.S. tumbled 6.3 percent which, with imports 4.8 percent lower, reduced the bilateral surplus from C$2.12 billion to C$1.53 billion, its smallest print since December 1993. The widening in the nominal shortfall was mirrored in the real trade balance where a 2.9 percent monthly decline in export volumes easily more than offset a 0.3 percent dip in imports. Among the major export product categories, 10 of the 11 subsectors posted monthly losses. Notable among these were motor vehicles & parts (6.0 percent), consumer goods (4.6 percent) and metal & non-metallic mineral products (5.4 percent). Industrial parts & machinery (down 7.1 percent), electronic & electrical equipment & parts (down 4.6 percent) and metal ores & non-metallic minerals (down 15.1 percent) also had a bad month. At the same time, imports were hit especially hard by aircraft & other transportation equipment & parts (down 20.4 percent).
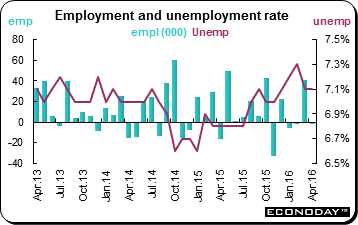 April employment was down 2,100 after gaining 40,600 in March. The participation rate slipped to 65.8 percent holding the unemployment rate steady at 7.1 percent. Full time positions declined 2,400 while the part-time headcount edged just 400 higher. Private sector payrolls actually increased a respectable 14,400 and government was up 8,400 but gains here were more than offset by a 24,900 drop in the number of self-employed. In terms of main output categories, weakness was concentrated in goods producing industries where employment was down a broad-based 37,100. Within this, manufacturing shed 16,500 and construction was off 5,700. Natural resources (down 7,800) and agriculture (down 7,000) also had a poor month. By contrast, services created 35,000 net new jobs. These came largely from trade (26,800) and accommodation & food (21,900) alongside smaller contributions from public administration (6,100), information, culture & recreation (6,400) and professional, scientific & technical services (4,700). Losses were reported in business, building & other support services (16,000) and other services (11,900). April employment was down 2,100 after gaining 40,600 in March. The participation rate slipped to 65.8 percent holding the unemployment rate steady at 7.1 percent. Full time positions declined 2,400 while the part-time headcount edged just 400 higher. Private sector payrolls actually increased a respectable 14,400 and government was up 8,400 but gains here were more than offset by a 24,900 drop in the number of self-employed. In terms of main output categories, weakness was concentrated in goods producing industries where employment was down a broad-based 37,100. Within this, manufacturing shed 16,500 and construction was off 5,700. Natural resources (down 7,800) and agriculture (down 7,000) also had a poor month. By contrast, services created 35,000 net new jobs. These came largely from trade (26,800) and accommodation & food (21,900) alongside smaller contributions from public administration (6,100), information, culture & recreation (6,400) and professional, scientific & technical services (4,700). Losses were reported in business, building & other support services (16,000) and other services (11,900).
The Reserve Bank of Australia surprised most and cut its cash rate by 25 basis points to 1.75 percent. Equities retreated thanks to disappointing earnings and uninspiring economic data including U.S. employment and manufacturing and composite PMIs.
The Bank of England meets on Thursday and announces its monetary policy decision. And at the same time, it publishes its Quarterly Inflation Report. The BoE is in a tough spot given the looming Brexit vote next month with signs that the uncertainty surrounding the vote is already negatively affecting the economy. Germany posts its critical manufacturers' orders and industrial production data. The Eurozone and members post their first estimates of first quarter gross domestic product.
| Central Bank activities |
|
| May 12 |
UK |
Bank of England Monetary Policy Announcement |
|
|
Bank of England Publishes Quarterly Inflation Report |
| |
|
|
| The following indicators will be released this week... |
| Europe |
|
|
| May 9 |
Germany |
Manufacturers' Orders (March) |
| May 10 |
Germany |
Industrial Production (March) |
|
|
Merchandise Trade (March) |
|
France |
Industrial Production (March) |
|
UK |
Merchandise Trade (March) |
| May 11 |
UK |
Industrial Production (March) |
| May 12 |
Eurozone |
Industrial Production (March) |
| May 13 |
Eurozone |
Gross Domestic Product (Q1.2016 second estimate) |
|
Germany |
Gross Domestic Product (Q1.2016 preliminary) |
|
Italy |
Gross Domestic Product (Q1.2016 preliminary) |
| |
|
|
| Asia/Pacific |
|
|
| May 10 |
China |
Consumer Price Index (April) |
|
|
Producer Price Index (April) |
| |
|
|
| Americas |
|
|
| May 9 |
Canada |
Housing Starts (April) |
Anne D Picker is the author of International Economic Indicators and Central Banks.
|
