|
Doomsdayers had plenty to enjoy in the latest week of economic data, that is at least on the headline level. Working past headlines, however, shows an economy that is still moving forward and creating jobs.
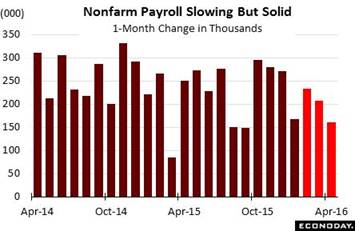 The labor market isn't red hot but still remains the economy's central strength. Nonfarm payrolls rose a lower-than-expected 160,000 in April, down from 208,000 in March and 233,000 in February and the smallest gain since September last year. Over the last year, monthly payroll growth has averaged 226,000. April's disappointment, by the way, was correctly forecast by Wednesday's estimate from ADP which, following a nearly 6 month run of accurate forecasts, may be increasingly less ignored in the future. However soft, the 160,000 gain in April is still well above the breakeven 100,000 mark, the level that Federal Reserve Chair Janet Yellen believes is the minimum necessary to absorb newcomers into the labor market and keep the unemployment rate from rising. The labor market isn't red hot but still remains the economy's central strength. Nonfarm payrolls rose a lower-than-expected 160,000 in April, down from 208,000 in March and 233,000 in February and the smallest gain since September last year. Over the last year, monthly payroll growth has averaged 226,000. April's disappointment, by the way, was correctly forecast by Wednesday's estimate from ADP which, following a nearly 6 month run of accurate forecasts, may be increasingly less ignored in the future. However soft, the 160,000 gain in April is still well above the breakeven 100,000 mark, the level that Federal Reserve Chair Janet Yellen believes is the minimum necessary to absorb newcomers into the labor market and keep the unemployment rate from rising.
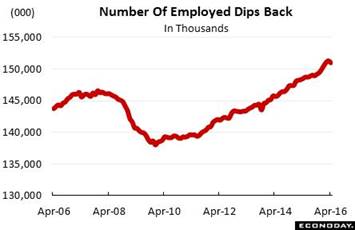 April's unemployment rate, which is calculated not on payrolls but on a house-to-house survey to capture the self-employed, is unchanged at 5.0 percent. Unfortunately, however, the mix of the components in this reading is taking a negative turn. The number of unemployed in the household survey did fall slightly, which of course is positive, but is offset by a decline in the number of those employed. The accompanying graph tracks the widest gauge of the nation's employment, at 151.0 million Americans in April but down from March's record at 151.3 million. In perspective, April's dip is the first in six months for this reading which, on a trend basis, is still favorable. April's unemployment rate, which is calculated not on payrolls but on a house-to-house survey to capture the self-employed, is unchanged at 5.0 percent. Unfortunately, however, the mix of the components in this reading is taking a negative turn. The number of unemployed in the household survey did fall slightly, which of course is positive, but is offset by a decline in the number of those employed. The accompanying graph tracks the widest gauge of the nation's employment, at 151.0 million Americans in April but down from March's record at 151.3 million. In perspective, April's dip is the first in six months for this reading which, on a trend basis, is still favorable.
Let's turn back again to the payroll data which are gathered not home-to-home but from establishments employing insured workers. Here the total is 143.9 million Americans with April's results pulled down by government payrolls which fell 11,000, which is sizable and reflects a monthly contraction at the postal service. Retail, a low paying sector where payroll growth has been very strong, stepped back in April with a 3,000 decline. Mining & logging extended its dismal trail, down 7,000 for the 18th straight decline in a streak that began with the 2014 collapse of energy and commodity prices. The ongoing strike of 40,000 Verizon workers, which started at the beginning of April, is a possible wildcard for future employment data but do not appear to have affected the latest report.
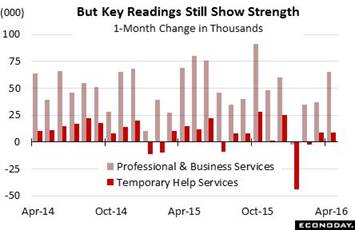 There is, however, definitely strength in the payroll breakdown, especially for the closely watched professional & business services reading, up a very strong 65,000 in a gain that hints at strength for general business activity. And the temporary help subcomponent of this reading is up a respectable 9,000 for a second month in a row. The Labor Department highlights temporary help as a leading indicator for permanent staff additions in the months ahead. Financial activities also show strength, up a very solid 20,000 with manufacturing back in the plus column but not by much with a 4,000 gain and reflecting a snap-back for the auto industry. A clear plus is a 54,000 rise in education & health, a component that continues to lead the jobs market with an outstanding average monthly gain of 58,000 over the last year. There is, however, definitely strength in the payroll breakdown, especially for the closely watched professional & business services reading, up a very strong 65,000 in a gain that hints at strength for general business activity. And the temporary help subcomponent of this reading is up a respectable 9,000 for a second month in a row. The Labor Department highlights temporary help as a leading indicator for permanent staff additions in the months ahead. Financial activities also show strength, up a very solid 20,000 with manufacturing back in the plus column but not by much with a 4,000 gain and reflecting a snap-back for the auto industry. A clear plus is a 54,000 rise in education & health, a component that continues to lead the jobs market with an outstanding average monthly gain of 58,000 over the last year.
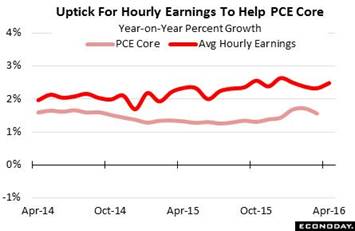 Earnings are another positive in the April report, up 0.3 percent in the month with the year-on-year rate back on the climb at 2.5 percent for a 2 tenths gain. And the annualized rate so far this year is over 3 percent, the critical line above which points to upward pull for overall prices. The graph tracks the dark line of worker earnings with the light line of the PCE core, which is the definitive reading that the Fed is trying to pull over 2 percent. April's gain for earnings points to gains for the core and also underscores higher costs that employers are now paying. The employment cost index, released last month, is definitely showing an upward creep, with quarter-to-quarter gains averaging nearly 0.6 percent since the second half of last year. Earnings are another positive in the April report, up 0.3 percent in the month with the year-on-year rate back on the climb at 2.5 percent for a 2 tenths gain. And the annualized rate so far this year is over 3 percent, the critical line above which points to upward pull for overall prices. The graph tracks the dark line of worker earnings with the light line of the PCE core, which is the definitive reading that the Fed is trying to pull over 2 percent. April's gain for earnings points to gains for the core and also underscores higher costs that employers are now paying. The employment cost index, released last month, is definitely showing an upward creep, with quarter-to-quarter gains averaging nearly 0.6 percent since the second half of last year.
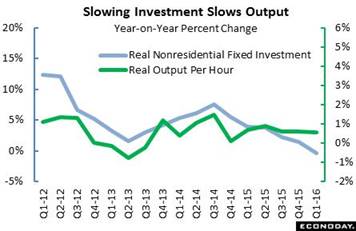 The nation's businesses, less than confident in their outlook, have not been investing as they should in new equipment, equipment that would increase the output of their employees. Instead they appear to be relying on ordinary hands & feet, so to speak, to do the work of machines which not only pulls down output growth but, in the long run, corporate profitability as well. Productivity & costs was another not-so-sizzling report issued in the week. Productivity fell at an annualized 1.0 percent rate in the first quarter for the fourth decline of the last six quarters. Output inched only 0.4 percent higher at an annualized rate in the quarter despite a 1.5 percent rise in hours worked -- this is not a productive formula. Weak output raises the relative cost of labor, up 1.4 percent for unit labor costs and the largest gain since fourth-quarter 2014. The graph compares the dark line of year-on-year inflation-adjusted output against inflation-adjusted nonresidential fixed investment, a category that includes structures, equipment, and intellectual property and is being pulled down especially by the energy sector. Weakness in nonresidential investment, falling steadily for six straight quarters and released with the prior week's GDP report, points with little doubt to lack of punch ahead for total output. The nation's businesses, less than confident in their outlook, have not been investing as they should in new equipment, equipment that would increase the output of their employees. Instead they appear to be relying on ordinary hands & feet, so to speak, to do the work of machines which not only pulls down output growth but, in the long run, corporate profitability as well. Productivity & costs was another not-so-sizzling report issued in the week. Productivity fell at an annualized 1.0 percent rate in the first quarter for the fourth decline of the last six quarters. Output inched only 0.4 percent higher at an annualized rate in the quarter despite a 1.5 percent rise in hours worked -- this is not a productive formula. Weak output raises the relative cost of labor, up 1.4 percent for unit labor costs and the largest gain since fourth-quarter 2014. The graph compares the dark line of year-on-year inflation-adjusted output against inflation-adjusted nonresidential fixed investment, a category that includes structures, equipment, and intellectual property and is being pulled down especially by the energy sector. Weakness in nonresidential investment, falling steadily for six straight quarters and released with the prior week's GDP report, points with little doubt to lack of punch ahead for total output.
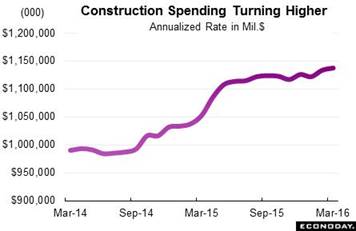 But some of the week's news was unquestionably positive including motor vehicle sales, which rose a very sharp 4.8 percent in April and are strongly pointing to a long-awaited gain for the motor vehicle component of the monthly retail sales report, a component that last posted an increase way back in November. And a striking plus in the week came from construction which, boosted by building of both homes and business structures, continues to push higher. Residential spending rose 1.6 percent in the March report driven by gains for multi-family homes. Private non-residential spending rose 0.7 percent led by transportation and including a respectable gain for manufacturing, both hinting at better results for capital spending as the coming structures are filled with new equipment. Year-on-year, total construction spending is up 8.0 percent, which includes a 7.8 percent gain on the residential side and a 9.3 percent gain on the non-residential side. These are down from 10 percent rates in prior reports but are still standouts -- perhaps deserving the description of "robust" -- and are hard to match anywhere else in the economy. The accompanying graph tracks monthly change in total spending, last at an annualized rate of $1.14 trillion. But some of the week's news was unquestionably positive including motor vehicle sales, which rose a very sharp 4.8 percent in April and are strongly pointing to a long-awaited gain for the motor vehicle component of the monthly retail sales report, a component that last posted an increase way back in November. And a striking plus in the week came from construction which, boosted by building of both homes and business structures, continues to push higher. Residential spending rose 1.6 percent in the March report driven by gains for multi-family homes. Private non-residential spending rose 0.7 percent led by transportation and including a respectable gain for manufacturing, both hinting at better results for capital spending as the coming structures are filled with new equipment. Year-on-year, total construction spending is up 8.0 percent, which includes a 7.8 percent gain on the residential side and a 9.3 percent gain on the non-residential side. These are down from 10 percent rates in prior reports but are still standouts -- perhaps deserving the description of "robust" -- and are hard to match anywhere else in the economy. The accompanying graph tracks monthly change in total spending, last at an annualized rate of $1.14 trillion.
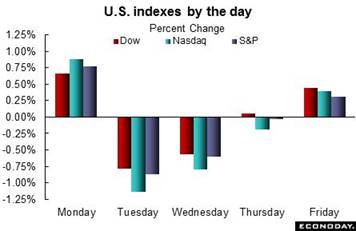 Demand for risk was not very strong in the week with the Dow posting a slight 0.2 percent loss and the Nasdaq a larger 0.8 percent loss. But the other side of the coin, demand for safety, showed a tangible increase with money moving once again into the Treasury market where the 2-year yield fell 5 basis points to 0.74 percent and back near February's lows. The 10-year yield, down 8 basis points at 1.78 percent, is right at February's lows, lows made at the time on uncertainty over China where concerns and market gyrations have since eased. Separately, comments by presidential candidate Donald Trump have not, at least initially, shaken confidence in the Treasury market or the nation's credit standing. Trump said on Thursday that, "I've borrowed knowing that you can pay back with discounts. I've done very well with that." He added, that if the economy crashes, "you could make a deal." Trump's comments also failed to shake up the dollar as the dollar index, though down 5.1 percent on the year, did rise 0.8 percent in the week. Demand for risk was not very strong in the week with the Dow posting a slight 0.2 percent loss and the Nasdaq a larger 0.8 percent loss. But the other side of the coin, demand for safety, showed a tangible increase with money moving once again into the Treasury market where the 2-year yield fell 5 basis points to 0.74 percent and back near February's lows. The 10-year yield, down 8 basis points at 1.78 percent, is right at February's lows, lows made at the time on uncertainty over China where concerns and market gyrations have since eased. Separately, comments by presidential candidate Donald Trump have not, at least initially, shaken confidence in the Treasury market or the nation's credit standing. Trump said on Thursday that, "I've borrowed knowing that you can pay back with discounts. I've done very well with that." He added, that if the economy crashes, "you could make a deal." Trump's comments also failed to shake up the dollar as the dollar index, though down 5.1 percent on the year, did rise 0.8 percent in the week.
The April jobs report has without a doubt completely shelved whatever expectations there were for a rate hike at the June meeting of the Federal Open Market Committee. But there's still the May employment report to be posted ahead of the meeting, and a snapback for payroll growth, combined perhaps with a dip in the employment rate and further improvement for wages, could revive the outlook for second-quarter growth and with it the chances, or at least a meaningful discussion, of a June rate hike after all.
| Markets at a Glance |
Year-End |
Week Ended |
Week Ended |
Year-To-Date |
Weekly |
|
2015 |
29-Apr-16 |
6-May-16 |
Change |
Change |
| DJIA |
17,425.03 |
17,773.64 |
17,740.63 |
1.8% |
-0.2% |
| S&P 500 |
2,043.94 |
2,065.30 |
2,057.14 |
0.6% |
-0.4% |
| Nasdaq Composite |
5,007.41 |
4,775.36 |
4,736.16 |
-5.4% |
-0.8% |
|
|
|
|
|
|
| Crude Oil, WTI ($/barrel) |
$37.40 |
$45.94 |
$44.61 |
19.3% |
-2.9% |
| Gold (COMEX) ($/ounce) |
$1,060.00 |
$1,288.69 |
$1,293.16 |
22.0% |
0.3% |
|
|
|
|
|
|
| Fed Funds Target |
0.25 to 0.50% |
0.25 to 0.50% |
0.25 to 0.50% |
0 bp |
0 bp |
| 2-Year Treasury Yield |
1.05% |
0.79% |
0.74% |
–31 bp |
–5 bp |
| 10-Year Treasury Yield |
2.27% |
1.86% |
1.78% |
–49 bp |
–8 bp |
| Dollar Index |
98.84 |
93.05 |
93.83 |
-5.1% |
0.8% |
The prior week's rush of key economic indicators that was capped by the April employment report should not take away too much from the current week's calendar where the focus will be inflation data and also retail sales. But the week won't get running until Thursday with import & export prices followed on Friday by producer prices. Both are expected to get a lift from higher oil prices, excluding which, however, the outlook is for continued price weakness. Higher gasoline prices, along with a snapback for vehicle sales, are expected to give Friday's retail sales report a major lift though core prices are also expected to show strength, strength that could revive confidence in the second-quarter outlook.
Small Business Optimism Index for April
Consensus Forecast: 93.1
Consensus Range: 92.5 to 93.5
The small business optimism index has been on the decline, hitting a two-year low of 92.9 in the March report. Employment readings have held up though have been inching lower. But earnings trends are very weak and, in perhaps a positive indication for future inflation, have been getting hit by higher labor costs that have yet to be passed through to selling prices. Forecasters see a moderate bounce for the index in April to 93.1.
Wholesale Inventories for March
Consensus Forecast, Month-to-Month Change: +0.3%
Consensus Range: 0.0% to +0.5%
Wholesale inventories fell in the prior two reports in response to declining sales. But a bounce is expected for the March report with forecasters looking for a 0.3 percent build. Still, if a rise inventories is not matched with a rebound in sales, concern will increase that unwanted inventories could prove to be a major negative for future production and employment.
Initial Jobless Claims for May 7 week
Consensus Forecast: 267,000
Consensus Range: 263,000 to 275,000
Forecasters see a dip back for initial jobless claims after they jumped higher in the April 30 week. But initial claims nevertheless remain near historic lows as do continuing claims which are reported with a week's lag. The Econoday consensus for initial claims in the May 7 week is 267,000 which would make for a 7,000 decline.
Import & Export Prices for April
Consensus Forecast for Import Prices, M/M Chg: +0.6%
Consensus Range: +0.1% to +1.7%
Consensus Forecast for Export Prices, M/M Chg: 0.0%
Consensus Range: -0.3% to +0.5%
Import & export prices ended a long run of contraction in March and are, at least on the import side, expected to show a sizable increase in April, at a consensus 0.6 percent. The strength of the dollar together with deflationary pressures among trading partners have been major factors behind the decline in import prices and the dollar's recent depreciation is expected to begin to have an inflationary effect. The rise in oil prices should also help reflate the import side. Export prices, which have been held down by weak global demand, are expected to come in unchanged and match March as the best result since May last year.
PPI-FD for April
Consensus Forecast: +0.3%
Consensus Range: +0.2% to +0.5%
PPI-FD Less Food & Energy
Consensus Forecast: +0.1%
Consensus Range: +0.1% to +0.3%
March gains for oil prices did little to boost producer prices in March but are expected to have a positive effect in April with the consensus looking for a 0.3 percent gain. Excluding oil, however, and also excluding food, core prices are expected to show much less strength at only plus 0.1 percent. Service prices in this report showed no strength at all March, down 0.2 percent for the first decline since October. Another drop for service prices, regardless of strength at the headline level, would not improve the inflationary outlook.
Retail Sales for April
Consensus Forecast: +0.9%
Consensus Range: +0.4% to +1.2%
Retail Sales Ex-Autos
Consensus Forecast: +0.5%
Consensus Range: +0.3% to +0.8%
Retail Sales Ex-Autos Ex-Gas
Consensus Forecast: +0.4%
Consensus Range: +0.2% to +0.4%
Strength in auto sales is expected to fuel a 0.9 percent jump in retail sales for April which are also expected to get help from higher prices at gasoline stations. Yet these two components aside, ex-auto ex-gas core sales are expected to rise 0.4 percent in what would be a very solid gain for this reading. Consumer spending, though still the economy's central strength, has been a disappointment so far this year and improvement in this report, especially any dramatic improvement, could revive confidence in the second-quarter outlook and with it talk of a Federal Reserve rate hike.
Business Inventories for March
Consensus Forecast: +0.2%
Consensus Range: +0.1% to +0.3%
Business inventories have been edging lower as businesses scramble to keep down unwanted stocks in a low sales environment. But a 0.2 percent gain is expected for March inventories which however, if not matched by a similar gain for sales, could increase concerns that overhang will hold down future production and employment.
Consumer Sentiment, Preliminary May
Consensus Forecast: 89.7
Consensus Range: 88.0 to 92.0
Hurt by questions over future job and income prospects, the consumer sentiment index has been steadily moving lower this year but still has held at respectable levels. Forecasters see the preliminary May reading coming in at 89.7 for a 7 tenths gain from final May. Inflation expectations, which are closely followed in this report, fell back sizably in April despite the rise underway in gasoline prices.
|
