|
It's been up and down for the doomsdayers. They were looking pretty good, that is until the latest week's data where the consumer sector, which had been looking a bit tired, came on strong to throw down some very serious numbers. And the gains seem to correlate, if only in time and not cause and effect, with certain election developments.
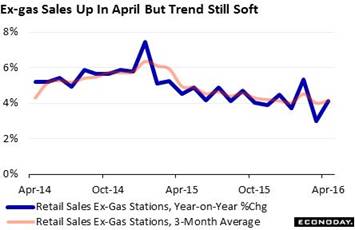 As if jolted awake, the consumer has gone from looking dead to looking good. Retail sales simply surged in April, up a much higher-than-expected 1.3 percent for the best showing since March last year. The strength is broad based and includes auto sales which finally show some life for the first time this year, with a 3.2 percent monthly jump. Excluding autos, retail sales rose 0.8 percent, also the best gain since March last year. Gasoline sales, up 2.2 percent in the month, also gave a boost to the report though the gain reflects price increases not necessarily stronger demand. The graph strips out gasoline and tracks the data, not on a bumpy up-and-down monthly basis, but on a smooth yearly trend, one that has been sloping steadily lower for more than a year. Growth in year-on-year ex-gas sales is currently tracking at no better than 4 percent, well down from the 6 percent line in late 2014. As if jolted awake, the consumer has gone from looking dead to looking good. Retail sales simply surged in April, up a much higher-than-expected 1.3 percent for the best showing since March last year. The strength is broad based and includes auto sales which finally show some life for the first time this year, with a 3.2 percent monthly jump. Excluding autos, retail sales rose 0.8 percent, also the best gain since March last year. Gasoline sales, up 2.2 percent in the month, also gave a boost to the report though the gain reflects price increases not necessarily stronger demand. The graph strips out gasoline and tracks the data, not on a bumpy up-and-down monthly basis, but on a smooth yearly trend, one that has been sloping steadily lower for more than a year. Growth in year-on-year ex-gas sales is currently tracking at no better than 4 percent, well down from the 6 percent line in late 2014.
Still the April report reads very well with gains across nearly all components including apparel sales and sales at nonstore retailers. The year-on-year rate for nonstore retailers is at plus 10.2 percent to lead all components and point to further acceleration in ecommerce. Furniture sales and sales at electronics & appliance stores are both up as are restaurant sales.
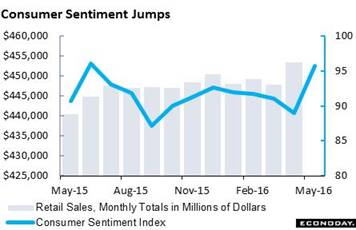 But the retail sales report is only half the story. The other half is the closely watched consumer sentiment index which is simply surging, up nearly 7 points for the mid-month flash to 95.8. Expectations, the component of the report that has been lagging, jumped nearly 10 points to 87.5 for the biggest one-month gain since 2006. The gain reflects greater confidence in the jobs outlook, a reminder of the labor market's solidly consistent strength. But the retail sales report is only half the story. The other half is the closely watched consumer sentiment index which is simply surging, up nearly 7 points for the mid-month flash to 95.8. Expectations, the component of the report that has been lagging, jumped nearly 10 points to 87.5 for the biggest one-month gain since 2006. The gain reflects greater confidence in the jobs outlook, a reminder of the labor market's solidly consistent strength.
Wait a minute! The labor market has been solid all along, right? So why the sudden surge in the consumer? Could it be (and this is just thinking out loud) that the jump in retail sales during April and the jump in sentiment so far this month are tied to Donald Trump? That this is a cause and effect relationship? His New York victory came right in the middle of April (which didn't hurt retail sales any) while his Indiana victory, the one that sealed his nomination, came right at the beginning of May (which didn't hurt consumer sentiment). And there's no doubt that Trump's numbers are surging, pulling nearly even with Hillary Clinton in the latest polls. But stop!! Retail sales after all were long overdue for a bounce and not all confidence readings are on the climb. The weekly consumer comfort index has been in retreat, and in deep retreat in fact with a two-week 1.7 point slide to under 42 at 41.7 in the latest reading for the May 8th week. This index had been holding over 44 until recently. And consumer confidence, a rival to the sentiment index, hasn't shown any life either, falling not rising in April's data. No, the signals aren't yet strong enough to know for sure what the Trump factor is or what it isn't.
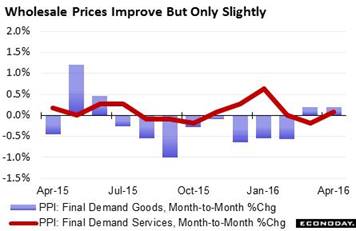 Inflation data are also at the top of the week's news, or more likely laying lifeless at the bottom of the news. Producer prices did improve but not very much, up 0.2 percent in April and doing very little for the year-on-year rate which is back at zero, that's right — no inflation at all. The core rate rose only 0.1 percent on the month with the year-on-year rate falling back to plus 0.9 percent. Goods prices did rise slightly for a second month, which is the first back-to-back gain since this time last year, while service prices edged back into the plus column for the first time this year. There's improvement, yes, but as you can see from the graph, inflation isn't actually raging out of control. Inflation data are also at the top of the week's news, or more likely laying lifeless at the bottom of the news. Producer prices did improve but not very much, up 0.2 percent in April and doing very little for the year-on-year rate which is back at zero, that's right — no inflation at all. The core rate rose only 0.1 percent on the month with the year-on-year rate falling back to plus 0.9 percent. Goods prices did rise slightly for a second month, which is the first back-to-back gain since this time last year, while service prices edged back into the plus column for the first time this year. There's improvement, yes, but as you can see from the graph, inflation isn't actually raging out of control.
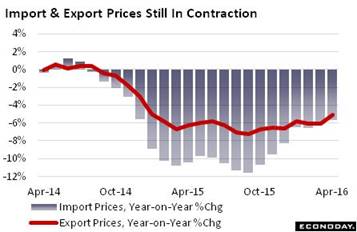 Other data also showing less than staggering improvement are import and export prices. Import prices have yet to show much boost from this year's dollar depreciation, which makes imports more expensive, or this year's recovery in oil prices which makes gasoline more expensive. Import prices rose 0.3 percent to match March's gain for, in an echo of the retail sales data, the first back-to-back gain since this time last year. And the year-on-year change is the best since December the year before, 2014. Yet the year-on-year change itself, at minus 5.7 percent, is still deeply negative. Export prices are showing a little less weakness, down 5.0 percent on the year. Other data also showing less than staggering improvement are import and export prices. Import prices have yet to show much boost from this year's dollar depreciation, which makes imports more expensive, or this year's recovery in oil prices which makes gasoline more expensive. Import prices rose 0.3 percent to match March's gain for, in an echo of the retail sales data, the first back-to-back gain since this time last year. And the year-on-year change is the best since December the year before, 2014. Yet the year-on-year change itself, at minus 5.7 percent, is still deeply negative. Export prices are showing a little less weakness, down 5.0 percent on the year.
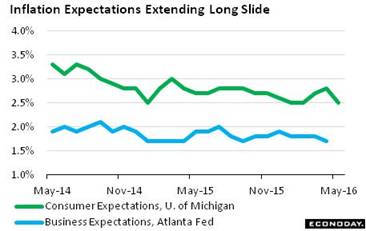 One of the oddest of all the week's data came once again from the week's biggest surprise, the consumer sentiment report where inflation expectations fell a very steep 3 tenths to 2.5 percent. The drop here comes completely out of the blue as gas prices, which usually lead this indicator by the nose, have been rising, not falling. The average gallon of gas is up more than 10 cents this month to roughly $2.20. The decline in inflation expectations among consumers follows last month's unwanted dip in business inflation expectations as tracked by the Atlanta Fed, down 1 tenth to a year-on-year 1.7 percent. The Fed had been counting on inflation expectations, not going down, but going up as the price of gasoline moves higher and as the cost of imports go up. But so far, no luck. Watch for the May edition of the Atlanta Fed inflation report in the coming week, on Wednesday, May 18. One of the oddest of all the week's data came once again from the week's biggest surprise, the consumer sentiment report where inflation expectations fell a very steep 3 tenths to 2.5 percent. The drop here comes completely out of the blue as gas prices, which usually lead this indicator by the nose, have been rising, not falling. The average gallon of gas is up more than 10 cents this month to roughly $2.20. The decline in inflation expectations among consumers follows last month's unwanted dip in business inflation expectations as tracked by the Atlanta Fed, down 1 tenth to a year-on-year 1.7 percent. The Fed had been counting on inflation expectations, not going down, but going up as the price of gasoline moves higher and as the cost of imports go up. But so far, no luck. Watch for the May edition of the Atlanta Fed inflation report in the coming week, on Wednesday, May 18.
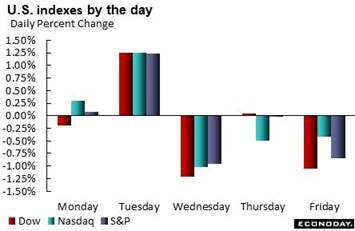 Demand for risk hasn't been very strong as the stock market has failed to extend its recovery. And movement in the Treasury market is lopsided, tilted to shorter maturities that speak to outright demand for safety and no fear anywhere of an economic breakout, to say the least. The dollar has been on the retreat but did rise in the latest week, up 0.8 percent on the dollar index to 94.56 which is part of the week's safety theme. Oil, at nearly $47 for WTI, is the big mover, up more than 5 percent in the week and more than 25 percent year-to-date. But the gain for oil has yet to help inflation much and couldn't help the Dow which, at 17,740, fell 1.2 percent on the week to trim its year-to-date appreciation to a very thin 0.6 percent, still well ahead of the Nasdaq which is in the red by 5.8 percent. The spread between 2- and 10-year Treasury yields continues to narrow, from 122 basis points at the start the year to 95 points now. Demand for risk hasn't been very strong as the stock market has failed to extend its recovery. And movement in the Treasury market is lopsided, tilted to shorter maturities that speak to outright demand for safety and no fear anywhere of an economic breakout, to say the least. The dollar has been on the retreat but did rise in the latest week, up 0.8 percent on the dollar index to 94.56 which is part of the week's safety theme. Oil, at nearly $47 for WTI, is the big mover, up more than 5 percent in the week and more than 25 percent year-to-date. But the gain for oil has yet to help inflation much and couldn't help the Dow which, at 17,740, fell 1.2 percent on the week to trim its year-to-date appreciation to a very thin 0.6 percent, still well ahead of the Nasdaq which is in the red by 5.8 percent. The spread between 2- and 10-year Treasury yields continues to narrow, from 122 basis points at the start the year to 95 points now.
| Markets at a Glance |
Year-End |
Week Ended |
Week Ended |
Year-To-Date |
Weekly |
|
2015 |
6-May-16 |
13-May-16 |
Change |
Change |
| DJIA |
17,425.03 |
17,740.63 |
17,535.32 |
0.6% |
-1.2% |
| S&P 500 |
2,043.94 |
2,057.14 |
2,046.61 |
0.1% |
-0.5% |
| Nasdaq Composite |
5,007.41 |
4,736.16 |
4,717.68 |
-5.8% |
-0.4% |
|
|
|
|
|
|
| Crude Oil, WTI ($/barrel) |
$37.40 |
$44.61 |
$46.95 |
25.5% |
5.2% |
| Gold (COMEX) ($/ounce) |
$1,060.00 |
$1,293.16 |
$1,270.40 |
19.8% |
-1.8% |
|
|
|
|
|
|
| Fed Funds Target |
0.25 to 0.50% |
0.25 to 0.50% |
0.25 to 0.50% |
0 bp |
0 bp |
| 2-Year Treasury Yield |
1.05% |
0.74% |
0.75% |
–30 bp |
1 bp |
| 10-Year Treasury Yield |
2.27% |
1.78% |
1.70% |
–57 bp |
–8 bp |
| Dollar Index |
98.84 |
93.83 |
94.56 |
-4.3% |
0.8% |
The consumer is suddenly speaking up, brightening the outlook from dark gloom to, well perhaps not quite sunshine, but to solid and respectable second-quarter growth, perhaps as high as 3 percent. The week's news has opened the door, at least slightly, for a rate hike at the June FOMC, or at least the chance of a meaningful discussion.
Manufacturing and housing are major themes, both getting a fast start to the week on Monday with both the Empire State and housing market indexes expected to show strength. Industrial production and housing starts follow on Tuesday with strength for both starts and permits expected. Consumer prices are also out on Tuesday and are expected to show some traction, the result of higher oil prices and perhaps rebounds for both housing costs and services. Wednesday's focus will be the FOMC minutes from the April meeting when the committee, citing wide softness, downgraded the strength of the economy. Jobless claims will be Thursday's highlight as initial claims cover the sample week of the May employment report. The Philly Fed will round out the week's factory data on Thursday while existing home sales will round out the housing data on Friday. Strength for both reports is expected.
Empire State Index for May
Consensus Forecast: +7.00
Consensus Range: +2.50 to +11.20
The Empire State report showed strength in March and April led by new orders which may be getting a boost from emerging gains for exports, gains tied to this year's depreciation for the dollar, and less weakness in energy equipment where oil prices have firmed. Shipments also posted gains in March and April and employment popped back over zero. Forecasters see continued expansion with the Econoday consensus at plus 7.00.
Housing Market Index for May
Consensus Forecast: 59
Consensus Range: 58 to 60
The housing market index has been holding solidly above breakeven 50 but has been not accelerating. Though buyer traffic remains very weak, holding well below 50 and reflecting lack of participation from first-time buyers, home builders nevertheless report very strong buying interest with both current sales and future sales holding above 60. A tick higher for the composite index, which is expected at 59, would boost confidence in the new home sector and underscore the strength of construction spending which has been a leading driver for the economy.
Consumer Price Index for April
Consensus Forecast, Month-to-Month Change: +0.3%
Consensus Range: +0.3% to +0.5%
CPI Core, Less Food & Energy
Consensus Forecast: +0.2%
Consensus Range: +0.1% to +0.3%
The Econoday consensus is calling for a snapback for consumer prices, at a consensus plus 0.3 percent overall and plus 0.2 percent for the core rate. The overall rate looks to get a boost from gas prices while the core may get a boost from both shelter prices, which have been flattening out this year, and also from service prices which slowed sharply in March. The year-on-year rate for the core, at only plus 2.2 percent in the last report, fell 1 tenth and a gain in April would help build confidence that Federal Reserve efforts to stimulate inflation may finally be showing some traction. General gains in this report would also hint at the possible effects of wage inflation where signs of strength in other reports, though limited, have been emerging.
Housing Starts for April
Consensus Forecast, Adjusted Annualized Rate: 1.135 million
Consensus Range: 1.100 to 1.185 million
Housing Permits
Consensus Forecast: 1.130 million
Consensus Range: 1.110 to 1.180 million
Housing starts & permits are expected to bounce back sharply in April, up 4.2 percent for starts to an annualized 1.135 million rate and up 4.1 percent for permits to 1.130 million. Both starts and permits fell sharply in March and raised questions over momentum going into the Spring housing season. One area of particular concern has been permit weakness in the West which is a key sector for new building. Still, trends in this report, expressed in year-on-year growth rates, are very positive, in the low double digits for starts and the mid-single digits for permits.
Industrial Production for April
Consensus Forecast, Month-to-Month Change: +0.2%
Consensus Range: 0.0% to +0.6%
Manufacturing Production
Consensus Forecast, Month-to-Month Change: +0.2%
Consensus Range: 0.0% to +0.3%
Capacity Utilization Rate
Consensus Forecast: 74.9%
Consensus Range: 74.5% to 75.2%
Weakness for vehicles has been a major factor holding down industrial production this year, especially in the last report for March. But even vehicles aside, this report has been very soft with many readings in decline especially mining where, hit hard by low commodity prices, year-on-year contraction has been in the low double digits. But oil prices have firmed and the dollar has been depreciating, both pluses for demand with the lower dollar a special plus for exports. A snapback in April is expected with the Econoday consensus calling for a 0.2 percent gain overall and a 0.2 percent gain for the manufacturing component. The capacity utilization rate, which has been depressed and in turn keeping down the cost of goods, is expected to rise 1 tenths to 74.9 percent.
Initial Jobless Claims for May 14 week
Consensus Forecast: 275,000
Consensus Range: 261,000 to 280,000
Big improvement is expected for initial jobless claims which spiked higher in the prior two reports. Forecasters see claims falling 19,000 in the May 14 week to 275,000. The latest week will be watched closely as a leading indicator for the May employment report as the May 14 week was also the sample week for the monthly report. But a comparison with the April sample week is very tough, a week when initial claims came in at an historic low of 248,000. Yet a comparison of 4-week averages is also valuable and here May has a chance with the April comparison at a less imposing 260,750 and still within reach of May's trend.
Philadelphia Fed Manufacturing Index for May
Consensus Forecast: +3.0
Consensus Range: 0.0 to +6.5
The Philadelphia Fed manufacturing index has been showing some resilience this year but less than the Empire State report. The Philly measure in April inched back into contraction at minus 1.6 but a move back to positive ground is expected for May, at an Econoday consensus of plus 3.0. But new orders, at zero, showed no change in April while backlog orders fell into deeper contraction at minus 6.3. But May is a new month, giving time for improvement in exports (based on the decline in the dollar) and also for energy equipment (based on higher oil prices).
Index of Leading Economic Indicators for April
Consensus Forecast, Month-to-Month Change: +0.4%
Consensus Range: +0.1% to +0.6%
The index of leading indicators is expected to rise 0.4 percent in April following a 0.2 percent gain in March. April is expected to be pulled higher by the decline in initial unemployment claims and a modest gain in the stock market. Negatives in April will be slowing growth in new orders and easing in that month's consumer confidence report. Building permits, which will be released earlier in the week, are always a wildcard.
Existing Home Sales for April
Consensus Forecast, Adjusted Annualized Rate: 5.400 million
Consensus Range: 5.350 to 5.460 million
A 5.1 percent surge in sales of existing homes during March improved the outlook for the housing sector but still failed to reverse a 7.3 percent plunge in February. A gain in prices brought more homes into the market during March though supply remained very thin and a negative for sales. Econoday forecasters are calling for another of strength for April, a 1.3 percent gain to a 5.400 million annualized rate.
|
