|
With a lackluster earnings season winding down, investors' focus will inevitably be switching back to economic data. But a laundry list of issues is confronting them besides economic data that are heightening risk and sending investors to the sidelines. Right now, with the vote on Brexit five and a half weeks away, the rhetoric has picked up from both sides. The question is should the UK leave the European Union and strike out on its own. In Greece, where 'Grexit' has been considered in the past, a new round of negotiations to relieve the country's debt problems is taking place. China's growth is an ongoing issue and continues to concern investors.
In the United States, a spate of weak economic data is giving rise to fears that the economy is faltering. But this past week's data should provide some comfort. The economy's performance is mirrored in Federal Reserve policy decisions. As a result, virtually every new piece of economic data is weighed against the probabilities of when the Fed will next increase interest rates at a time when other central banks — the Reserve Bank of Australia most recently — are cutting interest rates. The Bank of Japan, the Swiss National Bank and European Central Bank now have negative rates.
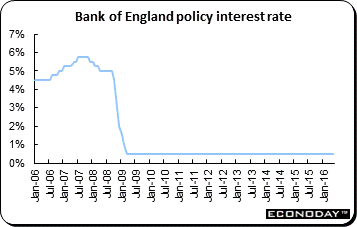 As universally anticipated, the Bank of England's monetary policy committee announced that it would hold the Bank Rate at 0.5 percent and the asset purchase ceiling at £375 billion. The vote was unanimous. The Bank's Quarterly Inflation Report was released simultaneously. However, as the minutes of the discussions make clear, the BoE's main focus at the moment is Brexit and its potential fallout should June's referendum produce a vote to leave the European Union. The Bank, as it did in April, again highlighted the difficulties in assessing underlying economic trends because of the distortions to the data caused by uncertainty ahead of the poll. As a result, the MPC is reacting more cautiously to current statistics than would normally be the case. As universally anticipated, the Bank of England's monetary policy committee announced that it would hold the Bank Rate at 0.5 percent and the asset purchase ceiling at £375 billion. The vote was unanimous. The Bank's Quarterly Inflation Report was released simultaneously. However, as the minutes of the discussions make clear, the BoE's main focus at the moment is Brexit and its potential fallout should June's referendum produce a vote to leave the European Union. The Bank, as it did in April, again highlighted the difficulties in assessing underlying economic trends because of the distortions to the data caused by uncertainty ahead of the poll. As a result, the MPC is reacting more cautiously to current statistics than would normally be the case.
June's MPC meeting will conclude just a week before the referendum on the 23rd. In the interim, the Bank will be monitoring UK financial markets especially closely for any signs of undue strain and provide additional liquidity as and when required. Assuming that the outcome is in favor of staying in the EU, policy should be able to return to normal quite quickly. However, a win for the 'out' camp would almost certainly prompt high levels of volatility across a range of asset classes and make the implementation of policy significantly more complicated. In particular, given a probable slide in the pound, the monetary authority would face a trade-off between stabilizing inflation on the one hand and output and employment on the other.
The BoE's updated Quarterly Inflation Report (QIR) showed few changes of any note from the previous edition released in February. However, with the economic outlook likely to be heavily impacted by the outcome of the June EU referendum, the latest forecasts are surrounded by even greater uncertainty than usual. As a starting point the Bank has assumed that much of the 9 percent slide in the pound since last November is attributable to Brexit worries and should be reversed in the event of a vote to stay in the EU.
In his press conference, BoE governor Mark Carney warned that the risks of leaving "could possibly include a technical recession". Vote Leave campaigners have strongly criticized Mr Carney. But a spokesman for Mr Carney rejected the call, saying the Bank had "a duty" to make its judgements known. Mr Carney said the Bank had not compiled formal forecasts about the possibility of a recession — defined as two consecutive quarters of negative growth — that would result from a Brexit vote.
| |
|
2015 |
2016 |
% Change |
|
Index |
Dec 31 |
May 6 |
May 13 |
Week |
2016 |
| Asia/Pacific |
|
|
|
|
|
|
| Australia |
All Ordinaries |
5344.6 |
5358.6 |
5396.26 |
0.7% |
1.0% |
| Japan |
Nikkei 225 |
19033.7 |
16106.7 |
16412.21 |
1.9% |
-13.8% |
| Hong Kong |
Hang Seng |
21914.4 |
20109.9 |
19719.29 |
-1.9% |
-10.0% |
| S. Korea |
Kospi |
1961.3 |
1976.7 |
1966.99 |
-0.5% |
0.3% |
| Singapore |
STI |
2882.7 |
2730.8 |
2734.91 |
0.2% |
-5.1% |
| China |
Shanghai Composite |
3539.2 |
2913.3 |
2827.11 |
-3.0% |
-20.1% |
|
|
|
|
|
|
|
| India |
Sensex 30 |
26117.5 |
25228.5 |
25489.57 |
1.0% |
-2.4% |
| Indonesia |
Jakarta Composite |
4593.0 |
4822.6 |
4761.71 |
-1.3% |
3.7% |
| Malaysia |
KLCI |
1692.5 |
1649.4 |
1628.26 |
-1.3% |
-3.8% |
| Philippines |
PSEi |
6952.1 |
6991.9 |
7436.79 |
6.4% |
7.0% |
| Taiwan |
Taiex |
8338.1 |
8146.4 |
8053.69 |
-1.1% |
-3.4% |
| Thailand |
SET |
1288.0 |
1390.7 |
1394.69 |
0.3% |
8.3% |
|
|
|
|
|
|
|
| Europe |
|
|
|
|
|
|
| UK |
FTSE 100 |
6242.3 |
6125.7 |
6138.50 |
0.2% |
-1.7% |
| France |
CAC |
4637.1 |
4301.2 |
4319.99 |
0.4% |
-6.8% |
| Germany |
XETRA DAX |
10743.0 |
9870.0 |
9952.90 |
0.8% |
-7.4% |
| Italy |
FTSE MIB |
21418.4 |
17842.8 |
17729.45 |
-0.6% |
-17.2% |
| Spain |
IBEX 35 |
9544.2 |
8702.1 |
8721.50 |
0.2% |
-8.6% |
| Sweden |
OMX Stockholm 30 |
1446.8 |
1309.2 |
1323.18 |
1.1% |
-8.5% |
| Switzerland |
SMI |
8818.1 |
7735.6 |
7925.76 |
2.5% |
-10.1% |
|
|
|
|
|
|
|
| North America |
|
|
|
|
|
|
| United States |
Dow |
17425.0 |
17740.6 |
17535.32 |
-1.2% |
0.6% |
|
NASDAQ |
5007.4 |
4736.2 |
4717.68 |
-0.4% |
-5.8% |
|
S&P 500 |
2043.9 |
2057.1 |
2046.61 |
-0.5% |
0.1% |
| Canada |
S&P/TSX Comp. |
13010.0 |
13701.5 |
13748.58 |
0.3% |
5.7% |
| Mexico |
Bolsa |
42977.5 |
45209.9 |
45402.470 |
0.4% |
5.6% |
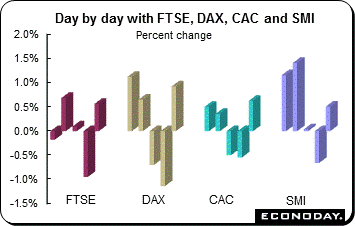 Friday's gains erased losses incurred earlier in the week and — with the exception of the MIB — indexes advanced for the week. U.S. retail sales and consumer sentiment data were better than anticipated and boosted optimism that the U.S. economy is indeed chugging along. The star performer for the week was the Swiss SMI — the index jumped 2.5 percent. The FTSE edged up 0.2 percent, the CAC added 0.4 percent and the DAX advanced 0.8 percent. Friday's gains erased losses incurred earlier in the week and — with the exception of the MIB — indexes advanced for the week. U.S. retail sales and consumer sentiment data were better than anticipated and boosted optimism that the U.S. economy is indeed chugging along. The star performer for the week was the Swiss SMI — the index jumped 2.5 percent. The FTSE edged up 0.2 percent, the CAC added 0.4 percent and the DAX advanced 0.8 percent.
Growth in the first quarter was pretty much as expected with Eurozone GDP up 0.5 percent on the quarter while France grew 0.5 percent and Germany's growth more than doubled to 0.7 percent. Italy's growth improved to 0.3 percent and although Spain was only steady, at 0.8 percent it was again the best performer. However, March industrial output data disappointed with declines in Germany and the Eurozone.
On Thursday, the Bank of England downgraded its growth projections on heightened uncertainty over the EU referendum. The Bank cautioned that any decision to exit the EU would lead to a materially lower growth path and a notably higher path for inflation. Brexit is not the only worry confronting the financial markets in Europe and the UK. The ongoing situation with Greece continues to fester.
A primer on Greece
After receiving three bailouts in five years and accepting a series of austerity measures, Greece now needs new aid to make a July debt payment and to avoid defaulting on its debt. The terms of the most recent bailout from last summer include commitments by Athens to put in place budget cuts and economic overhauls. Greek lawmakers approved those measures, which covered several of the changes sought by the country's international creditors, last year. They included raising the retirement age, cutting pensions, liberalizing the energy market, opening up cosseted professions, expanding a property tax that Greeks already revile and pushing forward a stalled program to privatize state assets.
The money was supposed to buy Greece time to stabilize its finances and quell market fears that the euro union itself could break up. While it has helped, Greece's economic problems have not gone away. The economy has shrunk by a quarter in five years and unemployment is about 25 percent. The bailout money mainly goes toward paying off Greece's international loans rather than making its way into the economy. And the government still has a staggering debt load that it cannot begin to pay down unless a recovery takes hold. First quarter GDP retreated 0.4 percent on the quarter.
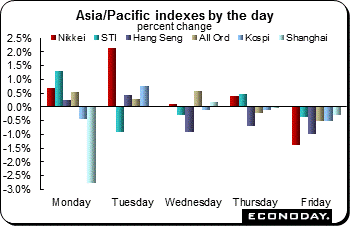 Equities tumbled Friday to end the week on a down note. However, the weekly results were a mixed picture. A higher value of the yen against the U.S. dollar, fluctuating oil prices, disappointing earnings reports and caution ahead of a deluge of European, U.S. and Chinese data that were released after markets here were closed for the week weighed on sentiment. The Philippine's PSEi, up 6.4 percent, was the best performer as markets responded to election results. Rodrigo Duterte won the Philippine presidential elections following the withdrawal of his opponents. The Nikkei was up 1.9 percent on the week. On the down side, the Shanghai Composite and Hang Seng lost 3.0 percent and 1.9 percent respectively on the week. Equities tumbled Friday to end the week on a down note. However, the weekly results were a mixed picture. A higher value of the yen against the U.S. dollar, fluctuating oil prices, disappointing earnings reports and caution ahead of a deluge of European, U.S. and Chinese data that were released after markets here were closed for the week weighed on sentiment. The Philippine's PSEi, up 6.4 percent, was the best performer as markets responded to election results. Rodrigo Duterte won the Philippine presidential elections following the withdrawal of his opponents. The Nikkei was up 1.9 percent on the week. On the down side, the Shanghai Composite and Hang Seng lost 3.0 percent and 1.9 percent respectively on the week.
Japanese stocks and yen are linked together inversely. A weaker yen helps the competitiveness of Japanese exporters, thereby supporting their shares. Foreign investors have been snapping up Japanese shares recently, buying a net ¥1.1 trillion ($10.1 billion) worth of equities in April, after three months of net selling, according to the latest data from Japan's Ministry of Finance. Traders also say the Japanese government has been buying stocks to support the market. Investors have been closely watching the Japanese currency's movements after Finance Minister Taro Aso repeatedly warned earlier in the week that the government could intervene in the foreign exchange market given the yen's recent strength.
China's equities closed at their lowest level in two months Friday, with the Shanghai Composite registering its fourth week of declines amid increasing concerns that a recent pick-up in economic activity may be fizzling out. Investor confidence had been reviving on signs of economic improvement in March, but doubts set in after a People's Daily article on Monday which described the economic trend as being "L-shaped", implying little pick-up in growth momentum. The article also appeared to signal that Beijing will be more cautious about loose monetary policies, especially the use of excessive debt, to stimulate growth. This apparent policy shift away from rapid credit expansion seen early in the year is supported by data showing China's fiscal expenditures rose 4.5 percent in April from a year earlier, slowing sharply from a 20.1 percent jump in March.
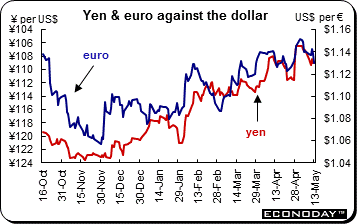 The U.S. dollar advanced against all of its major counterparts including the yen, euro, pound sterling, Swiss franc and the Canadian and Australian dollars. The yen declined for a second straight week on renewed speculation monetary policy in Japan and the U.S. will diverge further, driven by their economic prospects. Japan's currency slumped about 1.6 percent, the worst performer among 16 major peers, as Bank of Japan Governor Haruhiko Kuroda reiterated Friday there is room to ease monetary policy further. Meanwhile, in the U.S., two regional Federal Reserve presidents made the case for higher interest rates. The yen pared some of its losses Friday as Asian stocks dropped along with those in European markets (in early trading), boosting demand for the currency as a haven. The U.S. dollar advanced against all of its major counterparts including the yen, euro, pound sterling, Swiss franc and the Canadian and Australian dollars. The yen declined for a second straight week on renewed speculation monetary policy in Japan and the U.S. will diverge further, driven by their economic prospects. Japan's currency slumped about 1.6 percent, the worst performer among 16 major peers, as Bank of Japan Governor Haruhiko Kuroda reiterated Friday there is room to ease monetary policy further. Meanwhile, in the U.S., two regional Federal Reserve presidents made the case for higher interest rates. The yen pared some of its losses Friday as Asian stocks dropped along with those in European markets (in early trading), boosting demand for the currency as a haven.
The yen has depreciated about 3 percent since touching an 18-month high on May 3 as Japanese policy makers including Finance Minister Taro Aso reiterated this week that the government can intervene to stabilize foreign exchange markets if necessary. A former official in charge of intervention said Thursday that U.S. scrutiny of Japan's currency strategy won't prevent the government from selling the yen. A weaker exchange rate has been a key ingredient of Kuroda's efforts to boost inflation to 2 percent through monetary stimulus.
Finance Minister Taro Aso threatened to intervene in currency markets, after the yen has strengthened more than 10 percent against the dollar this year. He made the comments to be "decisive and prevent it from advancing further in that direction." Mr Aso has managed to nudge the yen a bit weaker, recently trading at 109 per dollar. But this is likely temporary. Ironically, the best course isn't Mr Aso following through on his threats to intervene. Japan's history of interventions going back to the 1980s shows success isn't easy to assess. There is an unknowable counterfactual nature to the exercise. If Japan hadn't intervened, would the yen have been that much stronger (or weaker in some cases)'
Uncoordinated intervention, in which Japan goes it alone without the help of the Federal Reserve and other big central banks supporting the trades, tends to provide a fleeting effect. The U.S. seems in no mood to help this time around. And even with other central banks' help, as in the post-2011 earthquake and tsunami intervention, turning the yen's direction around, rather than just slowing its ascent, is a tough task.
|
|
2015 |
2016 |
% Change |
|
|
Dec 31 |
May 6 |
May 13 |
Week |
2016 |
| U.S. $ per currency |
|
|
|
|
|
|
| Australia |
A$ |
0.7288 |
0.737 |
0.727 |
-1.3% |
-0.2% |
| New Zealand |
NZ$ |
0.6833 |
0.684 |
0.677 |
-1.0% |
-0.9% |
| Canada |
C$ |
0.7231 |
0.774 |
0.773 |
-0.1% |
6.9% |
| Eurozone |
euro (€) |
1.0871 |
1.140 |
1.131 |
-0.8% |
4.1% |
| UK |
pound sterling (£) |
1.4742 |
1.443 |
1.437 |
-0.4% |
-2.5% |
|
|
|
|
|
|
|
| Currency per U.S. $ |
|
|
|
|
|
|
| China |
yuan |
6.4937 |
6.496 |
6.532 |
-0.6% |
-0.6% |
| Hong Kong |
HK$* |
7.7501 |
7.761 |
7.764 |
0.0% |
-0.2% |
| India |
rupee |
66.1537 |
66.555 |
66.774 |
-0.3% |
-0.9% |
| Japan |
yen |
120.2068 |
107.120 |
108.650 |
-1.4% |
10.6% |
| Malaysia |
ringgit |
4.2943 |
4.004 |
4.031 |
-0.7% |
6.5% |
| Singapore |
Singapore $ |
1.4179 |
1.362 |
1.372 |
-0.8% |
3.4% |
| South Korea |
won |
1175.0600 |
1169.720 |
1171.470 |
-0.1% |
0.3% |
| Taiwan |
Taiwan $ |
32.8620 |
32.390 |
32.606 |
-0.7% |
0.8% |
| Thailand |
baht |
36.0100 |
35.120 |
35.710 |
-1.7% |
0.8% |
| Switzerland |
Swiss franc |
1.0014 |
0.9720 |
0.9748 |
-0.3% |
2.7% |
| *Pegged to U.S. dollar |
|
|
|
|
|
|
| Source: Bloomberg |
|
|
|
|
|
|
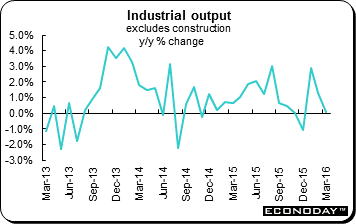
 March industrial production (excluding construction) dropped 0.8 percent on the month following a steeper revised 1.2 percent decline in February. The latest drop saw annual workday adjusted growth decrease from 1.0 percent to 0.2 percent, its worst performance since last December. Weakness was broad-based and production would have fallen significantly further but for a 2.0 percent monthly increase in energy output. Otherwise capital goods were down 1.1 percent, consumer non-durables off 1.9 percent and durables 0.4 percent lower. Intermediates matched the headline decline. Regionally among the four larger countries, France was down 0.3 percent and Germany 1.0 percent while Italy was unchanged. Only Spain (1.3 percent) managed positive growth. March industrial production (excluding construction) dropped 0.8 percent on the month following a steeper revised 1.2 percent decline in February. The latest drop saw annual workday adjusted growth decrease from 1.0 percent to 0.2 percent, its worst performance since last December. Weakness was broad-based and production would have fallen significantly further but for a 2.0 percent monthly increase in energy output. Otherwise capital goods were down 1.1 percent, consumer non-durables off 1.9 percent and durables 0.4 percent lower. Intermediates matched the headline decline. Regionally among the four larger countries, France was down 0.3 percent and Germany 1.0 percent while Italy was unchanged. Only Spain (1.3 percent) managed positive growth.
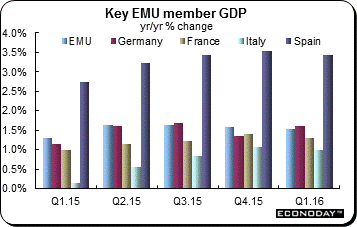 Flash first quarter gross domestic product was up 0.5 percent on the quarter, slightly below the preliminary flash estimate of 0.6 percent. On the year, GDP was up 1.5 percent, down from the preliminary 1.6 percent. The release still provides no GDP expenditure components but it does offer more in terms of a geographical breakdown. This showed stronger gains in total output in three of the four larger member states. Quarterly growth in France provisionally climbed 0.2 percentage points to 0.5 percent while Germany's rate more than doubled to 0.7 percent. Italy edged a tick higher to 0.3 percent and although Spain was only steady, at 0.8 percent it was again the best performer. Among the smaller countries, Slovakia (1.7 percent) had a very good quarter (although the data here do not include calendar adjustments) as did Cyprus (0.9 percent) and Lithuania (0.8 percent). At the other end of the growth spectrum, Greece contracted 0.4 percent and a 0.1 percent fall in Latvia put the economy into recession. Flash first quarter gross domestic product was up 0.5 percent on the quarter, slightly below the preliminary flash estimate of 0.6 percent. On the year, GDP was up 1.5 percent, down from the preliminary 1.6 percent. The release still provides no GDP expenditure components but it does offer more in terms of a geographical breakdown. This showed stronger gains in total output in three of the four larger member states. Quarterly growth in France provisionally climbed 0.2 percentage points to 0.5 percent while Germany's rate more than doubled to 0.7 percent. Italy edged a tick higher to 0.3 percent and although Spain was only steady, at 0.8 percent it was again the best performer. Among the smaller countries, Slovakia (1.7 percent) had a very good quarter (although the data here do not include calendar adjustments) as did Cyprus (0.9 percent) and Lithuania (0.8 percent). At the other end of the growth spectrum, Greece contracted 0.4 percent and a 0.1 percent fall in Latvia put the economy into recession.
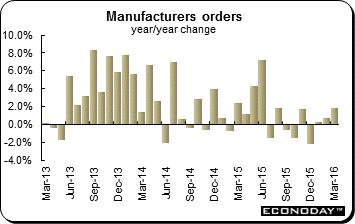 March manufacturing orders rebounded 1.9 percent following a smaller revised 0.8 percent drop in February. This was their best performance since June 2015. Compared with a year ago, growth was 1.8 percent, up from 0.7 percent in mid-quarter and the most marked since last August. The monthly advance reflected a 4.0 percent increase in capital goods although consumer goods were up 1.6 percent. Basics were 1.2 percent lower. The recovery was wholly attributable to stronger overseas demand which expanded a solid 4.3 percent on the month and reversing February's 2.1 percent decline. By contrast, domestic orders contracted 1.2 percent, their third decrease since November. The home component is now at its lowest level in half a year. March manufacturing orders rebounded 1.9 percent following a smaller revised 0.8 percent drop in February. This was their best performance since June 2015. Compared with a year ago, growth was 1.8 percent, up from 0.7 percent in mid-quarter and the most marked since last August. The monthly advance reflected a 4.0 percent increase in capital goods although consumer goods were up 1.6 percent. Basics were 1.2 percent lower. The recovery was wholly attributable to stronger overseas demand which expanded a solid 4.3 percent on the month and reversing February's 2.1 percent decline. By contrast, domestic orders contracted 1.2 percent, their third decrease since November. The home component is now at its lowest level in half a year.
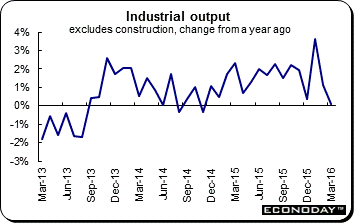
 March industrial production excluding construction dropped 1.0 percent on the month after a sharper revised 1.1 percent drop in February. Annual growth slumped from 1.3 percent to just 0.1 percent, its weakest reading so far in 2016. This was the first back-to-back decline in production since September/August 2015. March's contraction reflected broad-based declines among the major product groups. Consumer goods output was down 0.2 percent, intermediates decreased 1.3 percent and capital goods were off 1.4 percent, and that following a 2.1 percent tumble in February. Total manufacturing output fell 1.2 percent after a 1.0 percent decline in mid-quarter and with construction tumbling 3.0 percent, the only category to register a rise was energy (0.3 percent). March industrial production excluding construction dropped 1.0 percent on the month after a sharper revised 1.1 percent drop in February. Annual growth slumped from 1.3 percent to just 0.1 percent, its weakest reading so far in 2016. This was the first back-to-back decline in production since September/August 2015. March's contraction reflected broad-based declines among the major product groups. Consumer goods output was down 0.2 percent, intermediates decreased 1.3 percent and capital goods were off 1.4 percent, and that following a 2.1 percent tumble in February. Total manufacturing output fell 1.2 percent after a 1.0 percent decline in mid-quarter and with construction tumbling 3.0 percent, the only category to register a rise was energy (0.3 percent).
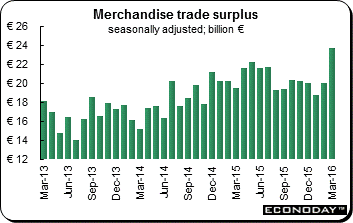 The March seasonally adjusted merchandise trade balance returned a record surplus of €23.7 billion, up from a larger revised €20.0 billion in February. The unadjusted surplus was €26.0 billion, up from €20.2 billion in mid-quarter. The buoyant headline print reflected a 1.9 percent monthly gain in exports and a 2.3 percent drop in imports. The increase in the former followed a 1.3 percent rise in February and put exports at a new high. However, the decline in the latter left imports at their lowest level since January 2015. Compared with a year ago, unadjusted exports were up 0.7 percent and imports 0.3 percent. The March seasonally adjusted merchandise trade balance returned a record surplus of €23.7 billion, up from a larger revised €20.0 billion in February. The unadjusted surplus was €26.0 billion, up from €20.2 billion in mid-quarter. The buoyant headline print reflected a 1.9 percent monthly gain in exports and a 2.3 percent drop in imports. The increase in the former followed a 1.3 percent rise in February and put exports at a new high. However, the decline in the latter left imports at their lowest level since January 2015. Compared with a year ago, unadjusted exports were up 0.7 percent and imports 0.3 percent.
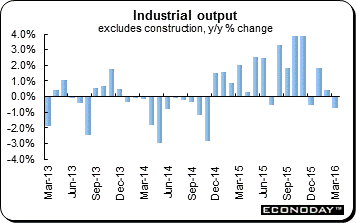
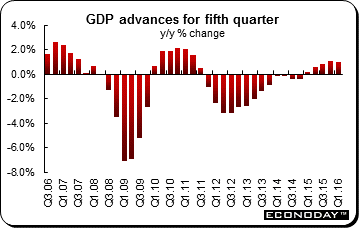
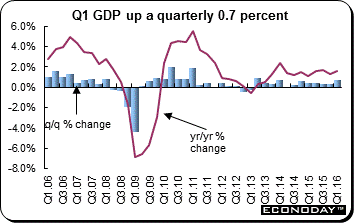 First quarter real gross domestic product provisionally expanded by 0.7 percent on the quarter following an unrevised 0.3 percent gain in the fourth quarter of 2015. The latest increase in total output lifted annual workday adjusted growth by 0.3 percentage points to 1.6 percent. Unadjusted the yearly increase was 1.3 percent, down from 2.1 percent last time. The first quarter advance was the largest since the second quarter of 2013 and, while details of the GDP expenditure components are not available in the flash report, reflected broad-based improvement in domestic demand. However, Destatis warned that capital and construction spending were especially robust and may have been biased up by unseasonably warm weather. If so, some of the expansion here may have been at the expense of the current period. Net exports had a negative impact. First quarter real gross domestic product provisionally expanded by 0.7 percent on the quarter following an unrevised 0.3 percent gain in the fourth quarter of 2015. The latest increase in total output lifted annual workday adjusted growth by 0.3 percentage points to 1.6 percent. Unadjusted the yearly increase was 1.3 percent, down from 2.1 percent last time. The first quarter advance was the largest since the second quarter of 2013 and, while details of the GDP expenditure components are not available in the flash report, reflected broad-based improvement in domestic demand. However, Destatis warned that capital and construction spending were especially robust and may have been biased up by unseasonably warm weather. If so, some of the expansion here may have been at the expense of the current period. Net exports had a negative impact.
 Excluding construction, industrial production was down 0.3 percent in March after a steeper revised 1.3 percent monthly drop in February — its fourth contraction in the last five months. Weakness was broad-based and outside of energy (3.7 percent) and refining (1.8 percent), March was a poor period for all of the other major production subsectors. Food & agriculture fell a monthly 1.0 percent while electronics & machines dropped 1.9 percent and both the transport equipment and the other manufactured goods categories declined 0.7 percent. Construction was up 1.2 percent. Excluding construction, industrial production was down 0.3 percent in March after a steeper revised 1.3 percent monthly drop in February — its fourth contraction in the last five months. Weakness was broad-based and outside of energy (3.7 percent) and refining (1.8 percent), March was a poor period for all of the other major production subsectors. Food & agriculture fell a monthly 1.0 percent while electronics & machines dropped 1.9 percent and both the transport equipment and the other manufactured goods categories declined 0.7 percent. Construction was up 1.2 percent.
 First quarter gross domestic product provisionally expanded 0.3 percent from the fourth quarter of 2015 when it grew a revised 0.2 percent. However, annual workday adjusted growth still slipped a tick to 1.0 percent. As usual with the flash report, Istat provided no details of the GDP expenditure components. However, from the supply side it indicated that there were gains in both goods production and service sector output but a contraction in agriculture. Despite its latest increase, total output is still 8 percent below the peak level it achieved before the onset of the Great Recession. First quarter gross domestic product provisionally expanded 0.3 percent from the fourth quarter of 2015 when it grew a revised 0.2 percent. However, annual workday adjusted growth still slipped a tick to 1.0 percent. As usual with the flash report, Istat provided no details of the GDP expenditure components. However, from the supply side it indicated that there were gains in both goods production and service sector output but a contraction in agriculture. Despite its latest increase, total output is still 8 percent below the peak level it achieved before the onset of the Great Recession.
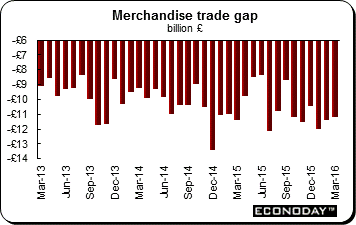 March deficit on global trade in goods narrowed from a smaller revised Stg11.43 billion in February to Stg11.20 billion. However, despite the dip in the red ink, the first quarter trade gap was Stg34.69 billion, up from Stg33.26 billion in February and a new record. The minor headline improvement reflected a 1.9 percent monthly increase in exports that eclipsed a 0.6 percent gain in imports. Excluding oil and other erratic items, the March shortfall was essentially flat at Stg10.88 billion. Regionally deficit on trade with other EU countries was little changed at Stg8.09 billion and with the rest of the world, 7.1 percent smaller at Stg7.1 percent. March deficit on global trade in goods narrowed from a smaller revised Stg11.43 billion in February to Stg11.20 billion. However, despite the dip in the red ink, the first quarter trade gap was Stg34.69 billion, up from Stg33.26 billion in February and a new record. The minor headline improvement reflected a 1.9 percent monthly increase in exports that eclipsed a 0.6 percent gain in imports. Excluding oil and other erratic items, the March shortfall was essentially flat at Stg10.88 billion. Regionally deficit on trade with other EU countries was little changed at Stg8.09 billion and with the rest of the world, 7.1 percent smaller at Stg7.1 percent.
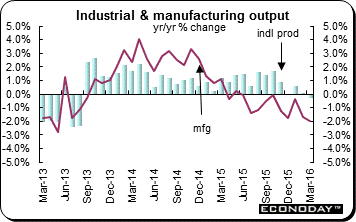 March industrial production was up 0.3 percent on the month following a marginally smaller revised 0.2 percent drop in February. From a year ago, output declined from plus 0.1 percent to minus 0.3 percent. Manufacturing output expanded just 0.1 percent from February when it tumbled a shallower revised 0.9 percent. Compared with a year ago output was off 1.9 percent, steepening the 1.6 percent slide posted last time. Five of the reporting subsectors recorded increases. Transport equipment which was up 2.7 percent was the strongest and alone added 0.2 percentage points to the overall change. At the other end of the spectrum, food & beverages (down 1.4 percent) had the most marked negative impact. Elsewhere within total industrial production, mining & quarrying slipped 0.4 percent on the month but electricity, gas, steam & air conditioning jumped 3.3 percent and water supply & waste management edged 0.2 percent higher. March industrial production was up 0.3 percent on the month following a marginally smaller revised 0.2 percent drop in February. From a year ago, output declined from plus 0.1 percent to minus 0.3 percent. Manufacturing output expanded just 0.1 percent from February when it tumbled a shallower revised 0.9 percent. Compared with a year ago output was off 1.9 percent, steepening the 1.6 percent slide posted last time. Five of the reporting subsectors recorded increases. Transport equipment which was up 2.7 percent was the strongest and alone added 0.2 percentage points to the overall change. At the other end of the spectrum, food & beverages (down 1.4 percent) had the most marked negative impact. Elsewhere within total industrial production, mining & quarrying slipped 0.4 percent on the month but electricity, gas, steam & air conditioning jumped 3.3 percent and water supply & waste management edged 0.2 percent higher.
 April consumer price index was up 2.3 percent as expected from a year ago for a third consecutive month. The CPI was down 0.2 percent on the month after declining 0.4 percent in March. For the four months through April, the CPI was up 2.2 percent on the year compared with only a 1.3 percent increase for the four months in 2015. Food prices were up 7.4 percent on the year while nonfood prices were up 1.1 percent. The Urban CPI was up 2.3 percent while the rural CPI was up 2.4 percent. Most of the categories were little changed from March. Transportation & communication prices were down 2.4 percent on the year after sinking 2.6 percent in March. Clothing was up 1.5 percent for a second month. Household articles & services were 0.5 percent higher after gaining 0.4 percent in March. April consumer price index was up 2.3 percent as expected from a year ago for a third consecutive month. The CPI was down 0.2 percent on the month after declining 0.4 percent in March. For the four months through April, the CPI was up 2.2 percent on the year compared with only a 1.3 percent increase for the four months in 2015. Food prices were up 7.4 percent on the year while nonfood prices were up 1.1 percent. The Urban CPI was up 2.3 percent while the rural CPI was up 2.4 percent. Most of the categories were little changed from March. Transportation & communication prices were down 2.4 percent on the year after sinking 2.6 percent in March. Clothing was up 1.5 percent for a second month. Household articles & services were 0.5 percent higher after gaining 0.4 percent in March.
 April producer price index was 3.4 percent lower on the year, an improvement from 4.3 percent in March. In April, the PPI was up 0.7 percent. For the four months through April the PPI was down 4.5 percent when compared with a year ago, about the same as in 2015. Raw materials procurement, fuel & power prices were down 4.4 percent on the year while production materials were 4.5 percent. Mining & exploration tumbled 13.0 percent – an improvement from the most recent months when the subindex plunged as much as 19.9 percent. Consumer goods prices slipped 0.2 percent for a second month. Prices for food & related product and clothing & related products both were up 0.7 percent on the year and the only two categories to show an increase. April producer price index was 3.4 percent lower on the year, an improvement from 4.3 percent in March. In April, the PPI was up 0.7 percent. For the four months through April the PPI was down 4.5 percent when compared with a year ago, about the same as in 2015. Raw materials procurement, fuel & power prices were down 4.4 percent on the year while production materials were 4.5 percent. Mining & exploration tumbled 13.0 percent – an improvement from the most recent months when the subindex plunged as much as 19.9 percent. Consumer goods prices slipped 0.2 percent for a second month. Prices for food & related product and clothing & related products both were up 0.7 percent on the year and the only two categories to show an increase.
Economic data were mixed last week in Europe and Asia but were mostly positive in the U.S. The Bank of England left its monetary policy unchanged ahead of the June 23 vote on whether the UK will leave the European Union. Concerns about Greece surfaced once again.
The Reserve Bank of Australia, European Central Bank and the Federal Reserve will all publish minutes from their respective policy meetings. Japan will report first quarter gross domestic product. The UK releases consumer and producer price indexes along with its labour market report and retail sales. Finance ministers and central bank governors will meet in Akiu, Sendai Japan on May 20 and 21 as a prelude to the Group of Seven summit scheduled for May 26 and 27 which will be held in Shima, Mie Pref. Japan.
| Central Bank activities |
|
| May 18 |
United States |
FOMC Meeting Minutes |
| |
|
|
| The following indicators will be released this week... |
| Europe |
|
|
| May 17 |
Eurozone |
Merchandise Trade (March) |
|
Italy |
Merchandise Trade (March) |
|
UK |
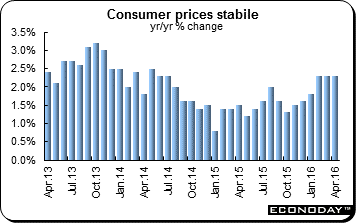
Consumer Price Index (April) |
|
|
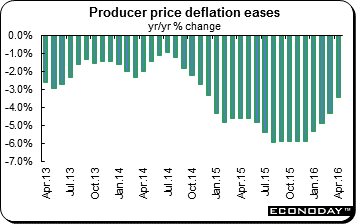
Producer Price Index (April) |
| May 18 |
Eurozone |
Harmonized Index of Consumer Prices (April final) |
|
UK |
Labour Market Report (April) |
| May 19 |
UK |
Retail Sales (April) |
| May 20 |
Germany |
Producer Price Index (April) |
| |
|
|
| Asia/Pacific |
|
|
| May 16 |
Japan |
Producer Price Index (April) |
| May 18 |
Japan |
Gross Domestic Product (Q1.2016 first estimate) |
| May 19 |
Japan |
Machinery Orders (March) |
| |
|
|
| Americas |
|
|
| May 17 |
Canada |
Manufacturing Sales (March) |
| May 20 |
Canada |
Consumer Price Index (April) |
|
|
Retail Sales (March) |
Anne D Picker is the author of International Economic Indicators and Central Banks.
|
