|
After the May employment report we can completely forget about a rate hike at this month's FOMC. And the roughly 40 percent chance that the Treasury market is still pricing in for a hike at the July FOMC looks a bit overstated perhaps based, not only on employment, but on the week's other data as well. Back in April, FOMC policy makers were confident that the second quarter would be a big positive for the economy. Their optimism has not played out. Crying towels are suggested before reading further.
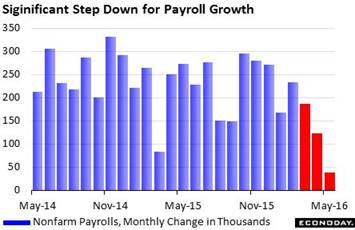 The biggest dud in the week, that is apart from the employment report, was a downbeat Beige Book where the description of the consumer sector, instead of getting an upgrade as expected, was left in the moderate range. There wasn't much market reaction on Wednesday to the news but, given what transpired on Friday, there definitely should have been. The word shock is far too timid to describe Friday's employment report where nonfarm payroll rose only 38,000 for the smallest gain of the economic cycle, since September 2010. This could have been cast out as an outlier, tied to a strike-related drop of 37,000 in Verizon payrolls that will soon reverse, but the data include downward revisions to the two prior months totaling 59,000. Putting May aside, the 123,000 total for April and the 186,000 for March aren't really that great. The three-month average, at 116,000, is the weakest since July 2012. Separate data on jobless claims did climb briefly in early May but there was nothing to prepare anyone for the latest results. The biggest dud in the week, that is apart from the employment report, was a downbeat Beige Book where the description of the consumer sector, instead of getting an upgrade as expected, was left in the moderate range. There wasn't much market reaction on Wednesday to the news but, given what transpired on Friday, there definitely should have been. The word shock is far too timid to describe Friday's employment report where nonfarm payroll rose only 38,000 for the smallest gain of the economic cycle, since September 2010. This could have been cast out as an outlier, tied to a strike-related drop of 37,000 in Verizon payrolls that will soon reverse, but the data include downward revisions to the two prior months totaling 59,000. Putting May aside, the 123,000 total for April and the 186,000 for March aren't really that great. The three-month average, at 116,000, is the weakest since July 2012. Separate data on jobless claims did climb briefly in early May but there was nothing to prepare anyone for the latest results.
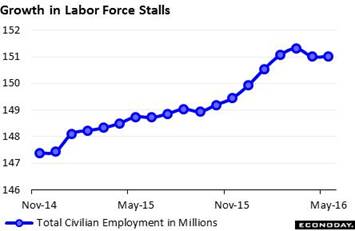 The labor force as measured by the household survey shrank sharply, in turn driving down the unemployment rate by 3 tenths to a 4.7 percent level that is an expression of weakness, not strength. The labor force participation rate, after having shown life in prior months, fell 2 tenths to 62.6 percent. The latter, in light of prior improvement this year, is especially disappointing, indicating that discouraged workers, who had been coming back and looking for jobs, are discouraged once more. The accompanying graph tracks total employment including the self-employed which is used to calculate the unemployment and participation rates. The slope through late last year and early this year was very encouraging. But it is less encouraging now. The labor force as measured by the household survey shrank sharply, in turn driving down the unemployment rate by 3 tenths to a 4.7 percent level that is an expression of weakness, not strength. The labor force participation rate, after having shown life in prior months, fell 2 tenths to 62.6 percent. The latter, in light of prior improvement this year, is especially disappointing, indicating that discouraged workers, who had been coming back and looking for jobs, are discouraged once more. The accompanying graph tracks total employment including the self-employed which is used to calculate the unemployment and participation rates. The slope through late last year and early this year was very encouraging. But it is less encouraging now.
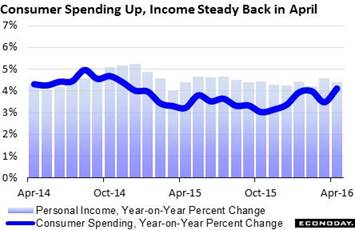 It's our job to go through the week's data and this includes a look back at the great expectations that were never met, happy times that are now gone. Way back at the beginning of the Spring the assumption was that weakness in the first quarter, when GDP grew at an annualized and pathetic 0.8 percent, would only be temporary, the result perhaps of uncertain adjustments to Winter's economic numbers. And April, to its shame, encouraged these false hopes. Consumer spending, as definitively tracked in the personal income & outlays report, surged 1.0 percent during the month and reflected an outsized gain for vehicle sales and another solid gain for service spending. The income side was also strong, up 0.4 percent and including a very promising 0.5 percent rise for wages & salaries. Year-on-year, as in the graph, spending rose 6 tenths to 4.1 percent with income steady at 4.4 percent. Consumers were so upbeat in the month that they drained their savings to fund their spending spree as the savings rate fell 5 tenths to 5.4 percent. This dip is the third biggest month-to-month downturn for the savings rate of the cycle, a downturn that may very well reverse and quickly if consumers lose confidence in the jobs market and start stuffing their mattresses again. It's our job to go through the week's data and this includes a look back at the great expectations that were never met, happy times that are now gone. Way back at the beginning of the Spring the assumption was that weakness in the first quarter, when GDP grew at an annualized and pathetic 0.8 percent, would only be temporary, the result perhaps of uncertain adjustments to Winter's economic numbers. And April, to its shame, encouraged these false hopes. Consumer spending, as definitively tracked in the personal income & outlays report, surged 1.0 percent during the month and reflected an outsized gain for vehicle sales and another solid gain for service spending. The income side was also strong, up 0.4 percent and including a very promising 0.5 percent rise for wages & salaries. Year-on-year, as in the graph, spending rose 6 tenths to 4.1 percent with income steady at 4.4 percent. Consumers were so upbeat in the month that they drained their savings to fund their spending spree as the savings rate fell 5 tenths to 5.4 percent. This dip is the third biggest month-to-month downturn for the savings rate of the cycle, a downturn that may very well reverse and quickly if consumers lose confidence in the jobs market and start stuffing their mattresses again.
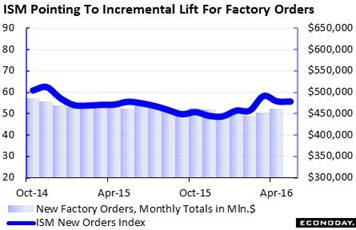 Let's throw out the composite and all the details and the swarm of conflicting signals and look at what really counts in the ISM manufacturing report: New Orders. And here we have new hope, at least some that the factory sector may be coming back to life. This index, which remember is one of the 10 components of the index of leading economic indicators, is holding its own, coming in at 55.7 in May and only 1 tenth slower than April. This index is solidly over breakeven 50 to indicate monthly growth and is doing as well as it has since the factory sector, hit by a collapse in energy and mining equipment, first broke lower in late 2014. Order breadth was very strong in May with 14 of 18 industries reporting a monthly gain. Let's throw out the composite and all the details and the swarm of conflicting signals and look at what really counts in the ISM manufacturing report: New Orders. And here we have new hope, at least some that the factory sector may be coming back to life. This index, which remember is one of the 10 components of the index of leading economic indicators, is holding its own, coming in at 55.7 in May and only 1 tenth slower than April. This index is solidly over breakeven 50 to indicate monthly growth and is doing as well as it has since the factory sector, hit by a collapse in energy and mining equipment, first broke lower in late 2014. Order breadth was very strong in May with 14 of 18 industries reporting a monthly gain.
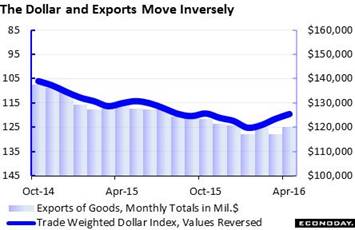 New export orders have been a strength of the last three ISM reports, signaling what may be strength ahead for actual exports as measured by the government. International trade data, released on Friday along with the employment report, were among the week's good news, showing a 1.5 percent gain for exports which is the second gain in three months for this otherwise depressed reading. In fact, the 1.5 percent gain is the largest since March 2014 and among the very best of the whole cycle. And gains were widespread including strength for industrial supplies, autos, food, consumer goods and even for capital goods which have been hit hard by foreign disinvestment in new business equipment. This year's depreciation in the dollar, down about 5 percent on the dollar index, is a major plus for the factory sector as seen in the accompanying graph. When the dollar goes down, exports go up (at least it does initially, but that's another story and one best told probably by Adam Smith). New export orders have been a strength of the last three ISM reports, signaling what may be strength ahead for actual exports as measured by the government. International trade data, released on Friday along with the employment report, were among the week's good news, showing a 1.5 percent gain for exports which is the second gain in three months for this otherwise depressed reading. In fact, the 1.5 percent gain is the largest since March 2014 and among the very best of the whole cycle. And gains were widespread including strength for industrial supplies, autos, food, consumer goods and even for capital goods which have been hit hard by foreign disinvestment in new business equipment. This year's depreciation in the dollar, down about 5 percent on the dollar index, is a major plus for the factory sector as seen in the accompanying graph. When the dollar goes down, exports go up (at least it does initially, but that's another story and one best told probably by Adam Smith).
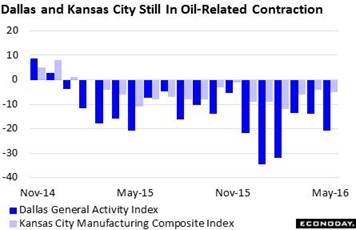 And even with the dollar's decline, the background music turns a bit morose. The dollar's depreciation together with the upturn for oil prices were supposed to, according to FOMC policy makers anyway, give a lift to the factory sector (not to mention inflation). But the nation's oil patch remains lifeless, actually in extended contraction despite the gain in oil. The graph tracks the Kansas City manufacturing index along with the Dallas general activity index, the latter starting out the week's dismal data run on Monday. Both regions are centers of the nation's energy sector and, based on these two reports, have been in uninterrupted contraction since February last year. There's been no let up and no reason for encouragement, at least not yet. Oil, now toying with $50 for West Texas Intermediate, has actually surged 60 percent since its February average of $30.60. The related benefit is bound to show up, sooner or later. And even with the dollar's decline, the background music turns a bit morose. The dollar's depreciation together with the upturn for oil prices were supposed to, according to FOMC policy makers anyway, give a lift to the factory sector (not to mention inflation). But the nation's oil patch remains lifeless, actually in extended contraction despite the gain in oil. The graph tracks the Kansas City manufacturing index along with the Dallas general activity index, the latter starting out the week's dismal data run on Monday. Both regions are centers of the nation's energy sector and, based on these two reports, have been in uninterrupted contraction since February last year. There's been no let up and no reason for encouragement, at least not yet. Oil, now toying with $50 for West Texas Intermediate, has actually surged 60 percent since its February average of $30.60. The related benefit is bound to show up, sooner or later.
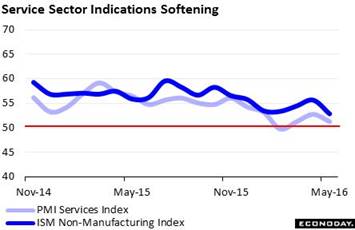 For the optimists who see the economy turning higher and the FOMC needing to raise rates there is yet more bad news to bear. The service sector, which feeds on the strength of the domestic consumer and is insulated to a large degree from global factors, is not turning higher, in fact is slowing noticeably based on two advance indications. The ISM non-manufacturing index fell 2.8 points to 52.9 to signal the lowest rate of monthly growth since January 2014. The report's employment index, in an echo of the government's employment report, was the weakest component, down 3.3 points to a sub-50 level of 49.7 that signals outright contraction, at least a slight contraction. The services PMI, based on a separate report, confirms the weakness, falling 1.5 points from April to 51.3 while new orders, in yet another one of the week's unwanted superlatives, is near its lowest level in the 7-year history of the report. Service is the nation's bread and butter, as it goes so goes the economy. For the optimists who see the economy turning higher and the FOMC needing to raise rates there is yet more bad news to bear. The service sector, which feeds on the strength of the domestic consumer and is insulated to a large degree from global factors, is not turning higher, in fact is slowing noticeably based on two advance indications. The ISM non-manufacturing index fell 2.8 points to 52.9 to signal the lowest rate of monthly growth since January 2014. The report's employment index, in an echo of the government's employment report, was the weakest component, down 3.3 points to a sub-50 level of 49.7 that signals outright contraction, at least a slight contraction. The services PMI, based on a separate report, confirms the weakness, falling 1.5 points from April to 51.3 while new orders, in yet another one of the week's unwanted superlatives, is near its lowest level in the 7-year history of the report. Service is the nation's bread and butter, as it goes so goes the economy.
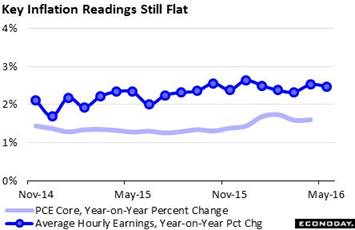 And for those who, despite everything, still hold out hope there is one more negative in the week, and a key one at that. Wages continue to lag and unless they pick up, inflation will also lag. Average hourly earnings, part of the monthly employment report, rose only 0.2 percent with the year-on-year rate unchanged at a less-than-inflationary 2.5 percent. Policy makers want this reading to move over 3 percent and approach 4 percent in order to stimulate an uptick for overall inflation. But, as seen in the dark line of the graph, this rate has really gone nowhere this year. The light line, which has also gone nowhere, is the FOMC's central price target, the PCE core index which, despite the rise in gasoline prices, has been unable to mount a challenge to the key 2 percent line. And for those who, despite everything, still hold out hope there is one more negative in the week, and a key one at that. Wages continue to lag and unless they pick up, inflation will also lag. Average hourly earnings, part of the monthly employment report, rose only 0.2 percent with the year-on-year rate unchanged at a less-than-inflationary 2.5 percent. Policy makers want this reading to move over 3 percent and approach 4 percent in order to stimulate an uptick for overall inflation. But, as seen in the dark line of the graph, this rate has really gone nowhere this year. The light line, which has also gone nowhere, is the FOMC's central price target, the PCE core index which, despite the rise in gasoline prices, has been unable to mount a challenge to the key 2 percent line.
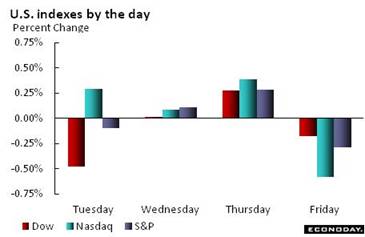 Times of slow economic growth and wide uncertainty point to the need for safety and liquid investments and hence demand for U.S. Treasuries, widely considered the safest investment on the planet. And Treasuries and bond traders have been tossed around the last several weeks, first with yields rising sharply at mid-month following April's FOMC minutes and the subsequent prospect for a big second-quarter economic bounce and June rate hike. Then the sea changed with the May employment report, sending yields back down as much as they had previously risen. The 2-year Treasury yield, which is especially sensitive to changes in FOMC expectations, fell 15 basis points in the week in what is an enormous move to 0.77 percent. Action is typically compressed in the bond market where definitive and sometimes extreme moves are made within minutes in contrast to the stock market where similar moves may take days to unfold. Stocks edged lower in the week with the Dow slipping fractionally on Friday for a weekly decline of 0.4 percent. Low Treasury rates, in the long run, push the dollar down and that's what happened in the short run this week as the dollar index fell 1.8 percent to 93.97. Times of slow economic growth and wide uncertainty point to the need for safety and liquid investments and hence demand for U.S. Treasuries, widely considered the safest investment on the planet. And Treasuries and bond traders have been tossed around the last several weeks, first with yields rising sharply at mid-month following April's FOMC minutes and the subsequent prospect for a big second-quarter economic bounce and June rate hike. Then the sea changed with the May employment report, sending yields back down as much as they had previously risen. The 2-year Treasury yield, which is especially sensitive to changes in FOMC expectations, fell 15 basis points in the week in what is an enormous move to 0.77 percent. Action is typically compressed in the bond market where definitive and sometimes extreme moves are made within minutes in contrast to the stock market where similar moves may take days to unfold. Stocks edged lower in the week with the Dow slipping fractionally on Friday for a weekly decline of 0.4 percent. Low Treasury rates, in the long run, push the dollar down and that's what happened in the short run this week as the dollar index fell 1.8 percent to 93.97.
| Markets at a Glance |
Year-End |
Week Ended |
Week Ended |
Year-To-Date |
Weekly |
|
2015 |
27-May-16 |
3-Jun-16 |
Change |
Change |
| DJIA |
17,425.03 |
17,873.22 |
17,807.06 |
2.2% |
-0.4% |
| S&P 500 |
2,043.94 |
2,099.86 |
2,099.13 |
2.7% |
0.0% |
| Nasdaq Composite |
5,007.41 |
4,933.51 |
4,942.52 |
-1.3% |
0.2% |
|
|
|
|
|
|
| Crude Oil, WTI ($/barrel) |
$37.40 |
$49.41 |
$48.79 |
30.5% |
-1.3% |
| Gold (COMEX) ($/ounce) |
$1,060.00 |
$1,207.70 |
$1,242.01 |
17.2% |
2.8% |
|
|
|
|
|
|
| Fed Funds Target |
0.25 to 0.50% |
0.25 to 0.50% |
0.25 to 0.50% |
0 bp |
0 bp |
| 2-Year Treasury Yield |
1.05% |
0.92% |
0.77% |
–28 bp |
–15 bp |
| 10-Year Treasury Yield |
2.27% |
1.85% |
1.70% |
–57 bp |
–15 bp |
| Dollar Index |
98.84 |
95.74 |
93.97 |
-4.9% |
-1.8% |
It was a week filled with superlatives, starting out with a cycle high for consumer spending and ending with a cycle low for employment. But when everything is worked out, it's only employment that really counts. Look for Janet Yellen, in her appearance on Monday, June 6, to offer an explanation for the sudden downgrade to the economic outlook. She has a lot of explaining to do.
The highlight of the week starts out on Monday and that will be Janet Yellen's speech on the economy and monetary policy to the World Affairs Council of Philadelphia. This will offer her a platform to reassess the outlook following last week's very soft employment report. A reminder of the economy's central weakness will be offered on Tuesday with the second estimate of first quarter productivity which is expected to contract though slightly less than the first estimate. Jobless claims did rise briefly in early May but never signaled the weakness of the month's labor market. Initial claims data for the June 4 week will be posted on Thursday. The week winds down on Friday with another report that also never signaled May's weakness, the consumer sentiment index which is expected to hold steady at a healthy 94.5.
Non-Farm Productivity, 2nd Estimate, First Quarter
Consensus Forecast, Annualized Rate: -0.6%
Consensus Range: -0.8% to 0.0%
Unit Labor Costs
Consensus Forecast, Annualized Rate: +4.1%
Consensus Range: +3.7% to +4.7%
Helped by a small upgrade to otherwise very weak output growth, the second estimate for non-farm productivity is expected to be revised to minus 0.6 percent vs minus 1.0 percent in the first estimate. Low output combined with rising compensation inflate unit labor costs which are expected to come in unchanged, at a revised rise of 4.1 percent. Troubles for productivity, described last month as "miserable" by Fed Chair Janet Yellen, reflect weak investment in new machinery and are a stubborn and central negative of the current economic cycle.
Consumer Credit for April
Consensus Forecast: +$18.0 billion
Consensus Range: +$14.0 to +$20.6 billion
Consumer credit is expected to rise $18.0 billion in April following a $29.7 billion surge in March. The revolving credit component, which has been weak this economic cycle, rose a very strong $11.1 billion in March to indicate less reluctance among consumers to run up their credit cards. Retail sales for April were very strong which points to another month of strength for this component.
Initial Jobless Claims for June 4 week
Consensus Forecast: 270,000
Consensus Range: 262,000 to 285,000
Initial jobless claims rose sharply in late April and through mid-May but have edged back since, to 267,000 in the May 28 week with forecasters calling for 270,000 in the June 4 week. Still, trends in this report, though historically very favorable, have nevertheless been edging up including trends in continuing claims. The increases aside, claims during May never signaled the severe weakness seen in the monthly employment report. The Verizon strike of 37,000 workers, which was resolved in late May, has yet to be cited as a special factor in this series.
Wholesale Inventories for April
Consensus Forecast, Month-to-Month Change: +0.1%
Consensus Range: -0.1% to +0.3%
Inventories have been flat this year reflecting destocking efforts in the face of soft demand. Forecasters see wholesale inventories little changed in April, at a consensus of plus 0.1 percent. Inventory builds are not wanted during times of slow economic growth, putting future production and employment at risk.
Consumer Sentiment Index, June Flash
Consensus Forecast: 94.5
Consensus Range: 90.5 to 96.9
The consumer sentiment index proved very strong in May, out performing by far other readings on consumer confidence. The sentiment index jumped 5.7 points during month to 94.7 for the best result since June last year and among the very strongest of the whole recovery. Gains in sentiment ultimately reflect confidence in the jobs market. Forecasters, despite the weakness of the May employment report, see the June flash coming in little changed at 94.5.
|
