|
Downplaying the significance of May's employment report, Janet Yellen opened the week saying one bad report is only one bad report and that other indications on the labor market are still solid. And sure enough, jobless claims entered on cue to re-affirm that layoffs are down and employment very high.
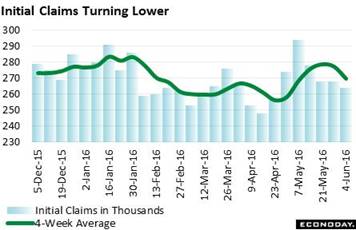 Thursday's jobless claims report was strong throughout with initial claims extending an impressive downtrend and offering an early hint of strength for the June employment report. Initial claims fell 4,000 in the June 4th week to what is a very low 264,000 level, in turn pulling down the 4-week average by a very sharp 7,500 to 269,500. If this improvement extends through the next two reports, then expectations are certain to build for a significant bounce back in June's employment data. Initial claims have now posted three straight readings below 270,000 and make a distant memory of the spike in early May over 290,000. Thursday's jobless claims report was strong throughout with initial claims extending an impressive downtrend and offering an early hint of strength for the June employment report. Initial claims fell 4,000 in the June 4th week to what is a very low 264,000 level, in turn pulling down the 4-week average by a very sharp 7,500 to 269,500. If this improvement extends through the next two reports, then expectations are certain to build for a significant bounce back in June's employment data. Initial claims have now posted three straight readings below 270,000 and make a distant memory of the spike in early May over 290,000.
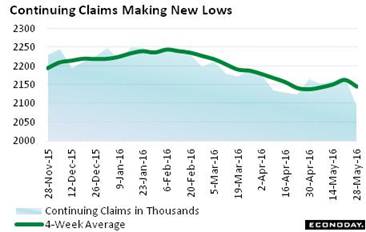 And the good news is backed up by continuing claims which fell a very sharp 77,000 in lagging data for the May 28 week. The 4-week average is down 18,000 to 2.145 million. The unemployment rate for insured workers is down 1 tenth to a new low of 1.5 percent. Data on continuing claims are at 15-year lows which is how far this series goes back. On the initial side of the report, claims are as low as they were way back in the early 1970s when the level of insured workers was about half of what is now, roughly 140 million vs 70 million. It's hard to exaggerate how low layoffs are right now. And the good news is backed up by continuing claims which fell a very sharp 77,000 in lagging data for the May 28 week. The 4-week average is down 18,000 to 2.145 million. The unemployment rate for insured workers is down 1 tenth to a new low of 1.5 percent. Data on continuing claims are at 15-year lows which is how far this series goes back. On the initial side of the report, claims are as low as they were way back in the early 1970s when the level of insured workers was about half of what is now, roughly 140 million vs 70 million. It's hard to exaggerate how low layoffs are right now.
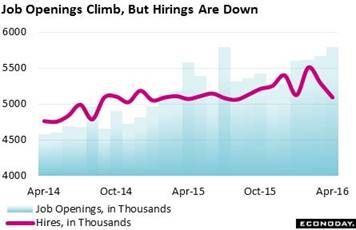 And there's more good news on the labor market as job openings in the JOLTS report rose 2.1 percent to 5.788 million, matching the high for this series posted back in July last year. The job openings rate also rose, up 1 tenth to 3.9 percent. But employers, however, are failing to fill these openings as hires fell a very steep 3.7 percent to 5.092 million. Hiring has been flat for the last year even while openings keep climbing, a disconnect that keeps payroll growth down and suggests that employers are having a hard time finding qualified applicants. In another less-than-robust indication, the quits rate fell 1 tenth to 2.0 percent suggesting that workers, despite low wage growth and lots of openings, are not shopping themselves around to other employers. And there's more good news on the labor market as job openings in the JOLTS report rose 2.1 percent to 5.788 million, matching the high for this series posted back in July last year. The job openings rate also rose, up 1 tenth to 3.9 percent. But employers, however, are failing to fill these openings as hires fell a very steep 3.7 percent to 5.092 million. Hiring has been flat for the last year even while openings keep climbing, a disconnect that keeps payroll growth down and suggests that employers are having a hard time finding qualified applicants. In another less-than-robust indication, the quits rate fell 1 tenth to 2.0 percent suggesting that workers, despite low wage growth and lots of openings, are not shopping themselves around to other employers.
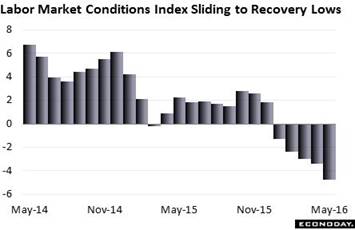 The week's worst news on the labor market came from the labor market conditions index where indications are sinking lower and lower, to minus 4.8 in May for the fifth straight negative reading and the lowest of this economic cycle, since May 2009. And April's index, at minus 3.4, is the second lowest of the cycle. This index is a massive composite of 19 separate indicators and suggests that labor market readings in total are moving lower ̶ and it stands in clear contrast to Yellen's efforts to downplay the May employment report as an outlier. The labor market conditions index is compiled by the Federal Reserve but is experimental in nature and is rarely cited by policy makers. The week's worst news on the labor market came from the labor market conditions index where indications are sinking lower and lower, to minus 4.8 in May for the fifth straight negative reading and the lowest of this economic cycle, since May 2009. And April's index, at minus 3.4, is the second lowest of the cycle. This index is a massive composite of 19 separate indicators and suggests that labor market readings in total are moving lower ̶ and it stands in clear contrast to Yellen's efforts to downplay the May employment report as an outlier. The labor market conditions index is compiled by the Federal Reserve but is experimental in nature and is rarely cited by policy makers.
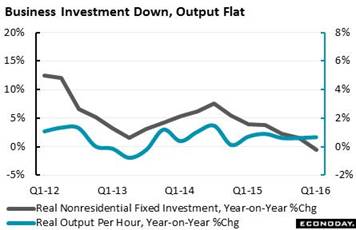 One of the factors that has been boosting employment, and this is an unfortunate negative, has been the nation's lack of investment in new machinery. Having old machines means employers need more hands and feet to increase output. The second revision to first-quarter productivity fell at a quarter-to-quarter annualized pace of 0.6 percent. It took a 1.5 percent rise in hours in the quarter to produce a 0.9 percent gain in output. With the labor market nearing full employment, this mismatch may very well become increasingly urgent for national policy. Not only did hours exceed output, compensation rose at the same time, up 3.9 percent to lift unit labor costs by an outsized 4.5 percent. Turning from an annualized pace to a straight year-on-year comparison, productivity is up 0.7 percent against a 1.6 percent rise in hours worked. Nonresidential fixed investment has been a major negative for the economy, pulling down GDP the last two quarters and by a very steep 0.8 percentage points in the first quarter. One of the factors that has been boosting employment, and this is an unfortunate negative, has been the nation's lack of investment in new machinery. Having old machines means employers need more hands and feet to increase output. The second revision to first-quarter productivity fell at a quarter-to-quarter annualized pace of 0.6 percent. It took a 1.5 percent rise in hours in the quarter to produce a 0.9 percent gain in output. With the labor market nearing full employment, this mismatch may very well become increasingly urgent for national policy. Not only did hours exceed output, compensation rose at the same time, up 3.9 percent to lift unit labor costs by an outsized 4.5 percent. Turning from an annualized pace to a straight year-on-year comparison, productivity is up 0.7 percent against a 1.6 percent rise in hours worked. Nonresidential fixed investment has been a major negative for the economy, pulling down GDP the last two quarters and by a very steep 0.8 percentage points in the first quarter.
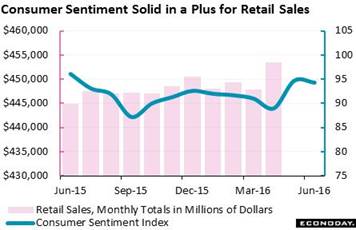 But the abundance in jobs, even if the pay isn't so great, is keeping American consumers happy, and perhaps surprisingly so. The consumer sentiment index is among the standouts right now on the calendar, holding on to the bulk of its May surge to a 94.3 reading for the June flash. Next to May, this is the best result since June last year. And there's acceleration underway this month in the current conditions component, up nearly 2 points to 111.7 in a gain that hints at month-to-month strength for consumer readings including retail sales which are tracked in the columns of the graph. But there is definitely bad news in the report, and that's inflation expectations which are sinking despite the ongoing jump in gasoline prices which would normally pull expectations higher. Though softening inflation expectations, and with it rising expectations for savings, are likely pluses for confidence they are not pluses for policy makers who want to see inflation move higher, not lower. But the abundance in jobs, even if the pay isn't so great, is keeping American consumers happy, and perhaps surprisingly so. The consumer sentiment index is among the standouts right now on the calendar, holding on to the bulk of its May surge to a 94.3 reading for the June flash. Next to May, this is the best result since June last year. And there's acceleration underway this month in the current conditions component, up nearly 2 points to 111.7 in a gain that hints at month-to-month strength for consumer readings including retail sales which are tracked in the columns of the graph. But there is definitely bad news in the report, and that's inflation expectations which are sinking despite the ongoing jump in gasoline prices which would normally pull expectations higher. Though softening inflation expectations, and with it rising expectations for savings, are likely pluses for confidence they are not pluses for policy makers who want to see inflation move higher, not lower.
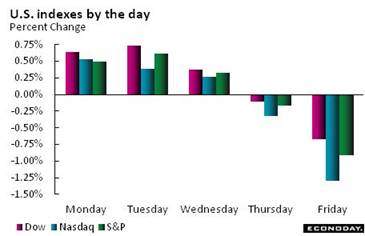 Rates continued to move lower in the week swelling what are giant declines so far this year in Treasury yields. The 2-year yield, at 0.74 percent, is down 31 basis points since the start of the year with the 10-year down 63 basis points at 1.64 percent. Warning! Anything sounding remotely hawkish in this month's FOMC statement could trigger a giant move out of Treasuries and an oversized uptick in yields. Rates may be down but demand for the dollar, getting a lift from Brexit concerns in Europe, is up with the dollar index gaining 0.7 percent. Still, dollar depreciation is in place with the year-to-date loss for the dollar at a tangible 4.3 percent which is good news for exporters and the factory sector. Stocks were flat in the week with the Dow, ending with a fractional gain to 17,865, unable to hold onto the 18,000 level that it broke on Wednesday. Oil was unable to hold onto its breach of $50, peaking briefly over $51 before settling back near $49 in what was also a fractional gain on the week. Rates continued to move lower in the week swelling what are giant declines so far this year in Treasury yields. The 2-year yield, at 0.74 percent, is down 31 basis points since the start of the year with the 10-year down 63 basis points at 1.64 percent. Warning! Anything sounding remotely hawkish in this month's FOMC statement could trigger a giant move out of Treasuries and an oversized uptick in yields. Rates may be down but demand for the dollar, getting a lift from Brexit concerns in Europe, is up with the dollar index gaining 0.7 percent. Still, dollar depreciation is in place with the year-to-date loss for the dollar at a tangible 4.3 percent which is good news for exporters and the factory sector. Stocks were flat in the week with the Dow, ending with a fractional gain to 17,865, unable to hold onto the 18,000 level that it broke on Wednesday. Oil was unable to hold onto its breach of $50, peaking briefly over $51 before settling back near $49 in what was also a fractional gain on the week.
| Markets at a Glance |
Year-End |
Week Ended |
Week Ended |
Year-To-Date |
Weekly |
|
2015 |
3-Jun-16 |
10-Jun-16 |
Change |
Change |
| DJIA |
17,425.03 |
17,807.06 |
17,865.34 |
2.5% |
0.3% |
| S&P 500 |
2,043.94 |
2,099.13 |
2,096.07 |
2.6% |
-0.1% |
| Nasdaq Composite |
5,007.41 |
4,942.52 |
4,894.55 |
-2.3% |
-1.0% |
|
|
|
|
|
|
| Crude Oil, WTI ($/barrel) |
$37.40 |
$48.79 |
$48.99 |
31.0% |
0.4% |
| Gold (COMEX) ($/ounce) |
$1,060.00 |
$1,242.01 |
$1,277.50 |
20.5% |
2.9% |
|
|
|
|
|
|
| Fed Funds Target |
0.25 to 0.50% |
0.25 to 0.50% |
0.25 to 0.50% |
0 bp |
0 bp |
| 2-Year Treasury Yield |
1.05% |
0.77% |
0.74% |
–31 bp |
–3 bp |
| 10-Year Treasury Yield |
2.27% |
1.70% |
1.64% |
–63 bp |
–6 bp |
| Dollar Index |
98.84 |
93.97 |
94.6 |
-4.3% |
0.7% |
The improvement in jobless claims is a plus for the employment outlook but a limited one nevertheless. Lack of layoffs has not resulted in any greater hiring. Economic data in total are not pointing to much second-quarter acceleration for the economy which, given that FOMC policy makers are data driven, seems to completely rule out a rate hike at this month's policy meeting. And the data are really not pointing, at least yet, to much of a chance for the July meeting either.
Retail sales on Tuesday open a very heavy and what is expected to be a soft week for economic news. Held back by vehicle sales and only moderate strength in ex-auto ex-gas sales, retail sales are not expected to show anything close to their strength in April. Price data are a theme of the week but, outside of an oil-related spike for import prices, no strength is expected in what could also lower the rate-hike outlook. A rate hike at the week's FOMC is out of the question with all forecasters calling for no change, putting the focus on Janet Yellen's press conference and whether she continues to cite confidence for a second-quarter rebound. Manufacturing is another focus with early hints on June from the Empire State and Philly Fed reports and the first definitive indications on May with the industrial production report. The outlooks for all these factory reports are weak. Housing ends the week with home builders expected to express continued optimism in their housing market index but with housing starts and permits expected to be no better than mixed.
Small Business Optimism Index for May
Consensus Forecast: 93.5
Consensus Range: 92.2 to 94.0
The small business optimism index moved up from two year lows in April to 93.6 but no additional strength is expected for May where forecasters are calling for 93.5. Employment readings improved in April though small business owners remained downbeat on the economic outlook.
Retail Sales for May
Consensus Forecast: +0.3%
Consensus Range: +0.2% to +0.6%
Retail Sales Ex-Autos
Consensus Forecast: +0.4%
Consensus Range: +0.2% to +0.6%
Retail Sales Ex-Autos Ex-Gas
Consensus Forecast: +0.3%
Consensus Range: 0.0% to +0.4%
Retail sales surged in April and first signaled what turned out to be strong overall results for the month's total data on consumer spending. The signal from May retail sales, however, is expected to less robust. Unit auto sales in May, though at a solid level, were flat compared to April though gasoline sales are certain to get a boost from another monthly climb in prices. The consensus gain for the overall headline is 0.3 percent with ex-auto sales at plus 0.4 percent. Core results, that is ex-auto ex-gas sales, have been very solid this year and a 0.3 percent gain is expected for May. Nonstore retailers, reflecting ecommerce sales, have been very strong this year as have sales at furniture stores and health & personal care stores.
Import & Export Prices for May
Consensus Forecast for Import Prices, Month-to-Month Change: +0.8%
Consensus Range: +0.2% to +1.4%
Consensus Forecast for Export Prices: +0.2%
Consensus Range: +0.1% to +0.4%
Import & export prices emerged from a long run of contraction in March and, getting an oversized boost from petroleum prices, are expected to jump 0.8 percent in May. Export prices, however, are not expected to show much strength with the consensus at only plus 0.2 percent. Key to this report will be the non-petroleum reading on the import side where the year-on-year rate has been in the negative low single digits, a trend that unfortunately is not inflationary.
Business Inventories for April
Consensus Forecast: +0.2%
Consensus Range: +0.1% to +0.4%
Business inventories have been subdued as businesses keep down stocks in a low sales environment. A 0.2 percent gain is expected for April inventories, one that may be especially small relative to business sales which will benefit from the month's strength in consumer spending.
PPI-FD for May
Consensus Forecast, Month-to-Month Change: +0.3%
Consensus Range: +0.2% to +0.5%
PPI-FD Less Food & Energy
Consensus Forecast: +0.2%
Consensus Range: +0.1% to +0.3%
Oil may be on the rise but producer prices, held back by stubborn weakness in service prices, have yet to show much benefit, rising 0.2 percent in April with only a 0.3 percent gain expected for May. April's core rate inched 0.1 percent higher and a 0.2 percent gain is expected for May. Year-on-year rates have been very subdued, unchanged for total producer prices and up only 0.9 percent for the core.
Empire State Index for June
Consensus Forecast: -3.50
Consensus Range: -6.00 to -2.00
The Empire State index emerged from the negative column but only briefly and just barely in April and March. May came in sizably negative, at minus 9.02, with a minus 3.50 result expected for June. Manufacturing, held down by generally weak foreign demand and wide weakness in capital goods demand, looks once again to be holding back the nation's economy.
Industrial Production for May
Consensus Forecast, Month-to-Month Change: -0.1%
Consensus Range: -0.5% to +0.1%
Manufacturing Production
Consensus Forecast: +0.1%
Consensus Range: -0.4% to +0.2%
Capacity Utilization Rate
Consensus Forecast: 75.2%
Consensus Range: 75.0% to 75.5%
Unusually big swings in utility output have been making for uneven readings in industrial production which is expected to slip 0.1 percent in May after jumping 0.7 percent in April. Mining has been a consistent negative while manufacturing has been a negative more times than not. Only a 0.1 percent increase in manufacturing production is expected for the April report, a result that would once again weigh on the factory outlook. The overall capacity utilization rate is expected to inch 2 tenths lower to 75.2 percent, a reading not consistent with price traction for goods.
Federal Funds Rate Target for June 14 & 15 Meeting:
Consensus Forecast, Midpoint: 0.375%
Consensus Forecast, Range: 0.25% to 0.50%
The Federal funds rate target is expected to remain unchanged at a midpoint of 0.375 percent between a range 0.25 to 0.50 percent, where they were set at the December FOMC and have yet to move. Weakness throughout the May employment report immediately ended any expectations for a rate hike at the June meeting. The perceived chances for a rate hike at the July meeting will depend on both the statement and also the press conference, especially Janet Yellen's assessment of the committee's expectations for second-quarter growth.
Consumer Price Index for May
Consensus Forecast, Month-to-Month Change: +0.3%
Consensus Range: +0.2% to +0.6%
CPI Core, Less Food & Energy
Consensus Forecast: +0.2%
Consensus Range: +0.1% to +0.3%
Gasoline prices climbed sharply in May but they aren't expected to inflate the consumer price index where the Econoday consensus is calling for only a moderate gain of 0.3 percent. Excluding energy and also food, the core rate is expected to show even less pressure, at a consensus plus 0.2 percent. Weakness in the core rate would underscore the persistently weak inflation picture and could further push back the outlook for the Federal Reserve's next rate hike.
Initial Jobless Claims for June 11 week
Consensus Forecast: 270,000
Consensus Range: 262,000 to 270,000
Initial jobless claims in the June 4th week, down 4,000 to 264,000, offered confirmation of strength following the weakness of the May employment report. But forecasters are expecting a move higher in the June 11th week to a 270,000 level that would, however, still be a favorable indication on the labor market. Continuing claims, where data lag by a week, have also been favorable.
Philadelphia Fed Manufacturing Index for June
Consensus Forecast: +0.8
Consensus Range: -3.4 to +3.9
The Philadelphia Fed manufacturing index held near zero in both May and April to indicate no significant change in the region's activity, a result that is also expected for June where the consensus is at only plus 0.8 percent. New orders posted a zero in April followed by minus 1.9 in May while contraction in unfilled orders deepened, to minus 8.8 in the May report. Similar results in the June report would likely lower the outlook once again for the nation's factory sector.
Current Account Deficit for First Quarter
Consensus Forecast: -$125.0 billion
Consensus Range: -$127.0 to -$116.0 billion
The first-quarter current account deficit is expected to show little change, at a consensus $125.0 billion vs a deficit of $125.3 billion in the fourth quarter. The current account as a percentage of GDP came in at a moderate 2.8 percent in the fourth quarter though an increase is likely given the weakness in first-quarter output.
Housing Market Index for June
Consensus Forecast: 59
Consensus Range: 58 to 60
The housing market index has come in unchanged at 58 for four months in a row but a fifth such result is not expected for June where forecasters are calling for a 1 point gain to 59. Though flat month-to-month, the index has been well over breakeven 50 this year to indicate a healthy though non-accelerating rate of growth. Both current sales and future sales have been trending in the mid to low 60s with traffic, held down by lack of first-time buyers, sharply depressed in the mid to low 40s.
Housing Starts for May
Consensus Forecast, Adjusted Annualized Rate: 1.150 million
Consensus Range: 1.090 to 1.205 million
Housing Permits
Consensus Forecast: 1.140 million
Consensus Range: 1.125 to 1.235 million
Housing starts bounced back sharply in May but a give back is expected in June, to a consensus 1.150 million annualized rate for what would be a 1.9 percent decline on the month. Housing permits, however, are expected to extend April's gain with a 2.2 percent increase to a 1.140 million rate. Despite strength in construction spending, trends in this report have been weak with starts at a year-on-year minus 1.7 percent in April and permits also in the negative column, at minus 7.2 percent.
|
