|
For those of you who correlate car sales with monthly employment change, stop doing it! Vehicle sales (reported in the prior week) were very weak in June while employment (reported in the latest week) was very strong. The weakness in vehicle sales may be bad news for June retail sales, but the strength in employment is good news for long-term consumer spending. Until the employment report, June as a month looked iffy, not only because of vehicle sales but also because of the June FOMC where everything came off dovish. June, in fact, proved more than strong, at least that's the case for June's most important set of data.
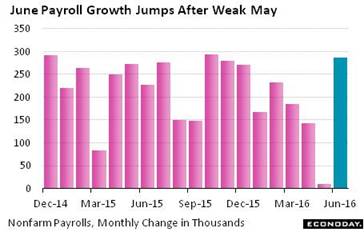 May thankfully proved to be an odd outlier in what is otherwise a still favorable trend for the labor market. June nonfarm payrolls surged a much stronger-than-expected 287,000 vs a downwardly revised and recovery low increase of only 11,000 in May. The unemployment rate rose 2 tenths to 4.9 percent but reflects strength, not weakness, in the labor market as discouraged workers, who stopped looking for work in May, started looking again in June to lift the labor participation rate 1 tenth to 62.7 percent. But there was a big plus missing in the report which was hinted at as a possibility by Janet Yellen, and that was a big upward revision to May -- which of course didn't happen. May thankfully proved to be an odd outlier in what is otherwise a still favorable trend for the labor market. June nonfarm payrolls surged a much stronger-than-expected 287,000 vs a downwardly revised and recovery low increase of only 11,000 in May. The unemployment rate rose 2 tenths to 4.9 percent but reflects strength, not weakness, in the labor market as discouraged workers, who stopped looking for work in May, started looking again in June to lift the labor participation rate 1 tenth to 62.7 percent. But there was a big plus missing in the report which was hinted at as a possibility by Janet Yellen, and that was a big upward revision to May -- which of course didn't happen.
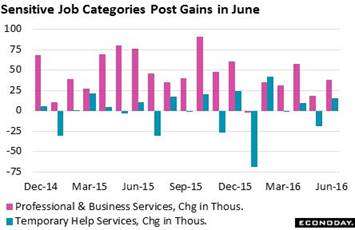 The mix of details is also positive, at least for the most part. June's strength is led by a 38,000 gain for professional & business services, a closely watched component that is especially sensitive to changes in labor demand. Temporary help, a subcomponent that is most sensitive of all, rose 15,000. Though soundly positive for June, the track records for these readings show less strength. Telecommunications employment is also a key to the June report, rising 28,000 to reverse a one-time Verizon-strike fall of 32,000 in May. And manufacturing is a special standout in the report, posting a rare gain and a sizable one at 14,000. But when standing back and looking at the big picture, the monthly average for the second quarter at only 147,300 doesn't look that great, especially against the first quarter's more substantial 195,700. The labor market is solid but perhaps slowing and is not signaling any urgency for a new Federal Reserve rate hike. The mix of details is also positive, at least for the most part. June's strength is led by a 38,000 gain for professional & business services, a closely watched component that is especially sensitive to changes in labor demand. Temporary help, a subcomponent that is most sensitive of all, rose 15,000. Though soundly positive for June, the track records for these readings show less strength. Telecommunications employment is also a key to the June report, rising 28,000 to reverse a one-time Verizon-strike fall of 32,000 in May. And manufacturing is a special standout in the report, posting a rare gain and a sizable one at 14,000. But when standing back and looking at the big picture, the monthly average for the second quarter at only 147,300 doesn't look that great, especially against the first quarter's more substantial 195,700. The labor market is solid but perhaps slowing and is not signaling any urgency for a new Federal Reserve rate hike.
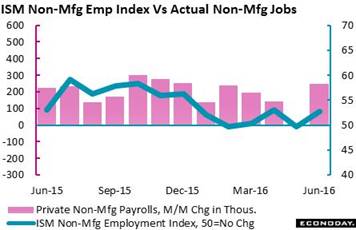 The big news for the June employment report was foretold (at least to a degree) by the ISM's non-manufacturing employment index which jumped 3 points to 52.7, a reading that is over 50 to indicate monthly growth for underlying employment. The accompanying graph strips out manufacturing from the government's payroll data (red columns) and compares the results with the ISM index (blue line). The index has been unusually weak most of this year, straddling the no-change 50 line even while payroll growth was more than 200,000 per month. But the ISM's calls for both May and June were very good. And of course for many in the market a two-month winning streak is pretty substantial! So don't be surprised if this index gets special attention heading into the July employment report. The big news for the June employment report was foretold (at least to a degree) by the ISM's non-manufacturing employment index which jumped 3 points to 52.7, a reading that is over 50 to indicate monthly growth for underlying employment. The accompanying graph strips out manufacturing from the government's payroll data (red columns) and compares the results with the ISM index (blue line). The index has been unusually weak most of this year, straddling the no-change 50 line even while payroll growth was more than 200,000 per month. But the ISM's calls for both May and June were very good. And of course for many in the market a two-month winning streak is pretty substantial! So don't be surprised if this index gets special attention heading into the July employment report.
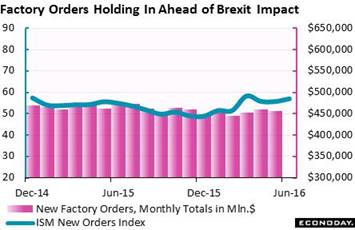 The new orders index for manufacturing is an even more closely watched reading from the ISM, the long name for which is the Institute For Supply Management, a trade organization that tracks purchasers across the economy. The new orders index, as tracked in the blue line of the graph, has been sloping slightly higher with the latest reading on June coming in at 57.0. The reading here that is consistent with underlying monthly growth is not a plain old 50 but exactly 52.2 as calculated by the Census Department. Actual factory orders, tracked in the columns, have also been sloping higher in recent months but less so and only just barely especially after May's 1.0 percent dip back toward the monthly $450 billion line. New orders for capital goods are a special concern but there's weakness elsewhere in manufacturing as well, a sector now facing the sudden risk of currency appreciation. The new orders index for manufacturing is an even more closely watched reading from the ISM, the long name for which is the Institute For Supply Management, a trade organization that tracks purchasers across the economy. The new orders index, as tracked in the blue line of the graph, has been sloping slightly higher with the latest reading on June coming in at 57.0. The reading here that is consistent with underlying monthly growth is not a plain old 50 but exactly 52.2 as calculated by the Census Department. Actual factory orders, tracked in the columns, have also been sloping higher in recent months but less so and only just barely especially after May's 1.0 percent dip back toward the monthly $450 billion line. New orders for capital goods are a special concern but there's weakness elsewhere in manufacturing as well, a sector now facing the sudden risk of currency appreciation.
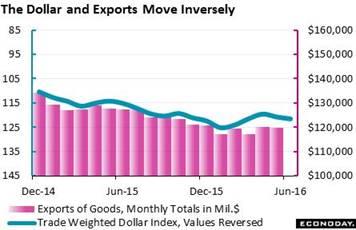 The dollar index has gained 3 percent since Brexit, cutting deeply into what had been a favorable year-to-date decline for the currency, a decline that has now been cut to 2.7 percent. The effects of the dollar's upswing will be slow to appear but are certain to appear, that is a new deflationary pull for import prices and slowing for the nation's exports. And exports were already soft before the dollar's ongoing climb, reflected in the nation's trade deficit in May which widened sharply to $41.1 billion from April's $37.4 billion. The net deficit for goods widened to $62.2 billion from April's $58.6 billion, offset by a net surplus for services which narrowed slightly to $21.1 billion. In a negative indication on global demand, exports of both goods and services fell slightly in the month. Exports of capital goods and also civilian aircraft are in contraction, two key readings for global business investment where weakness may be deepening. The dollar index has gained 3 percent since Brexit, cutting deeply into what had been a favorable year-to-date decline for the currency, a decline that has now been cut to 2.7 percent. The effects of the dollar's upswing will be slow to appear but are certain to appear, that is a new deflationary pull for import prices and slowing for the nation's exports. And exports were already soft before the dollar's ongoing climb, reflected in the nation's trade deficit in May which widened sharply to $41.1 billion from April's $37.4 billion. The net deficit for goods widened to $62.2 billion from April's $58.6 billion, offset by a net surplus for services which narrowed slightly to $21.1 billion. In a negative indication on global demand, exports of both goods and services fell slightly in the month. Exports of capital goods and also civilian aircraft are in contraction, two key readings for global business investment where weakness may be deepening.
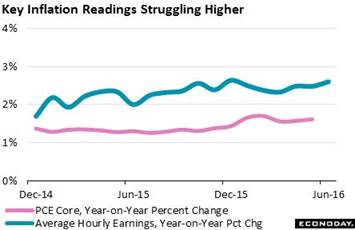 Turning back to the employment report for a look at inflation pressures makes for one more nail in the rate-hike coffin. Average hourly earnings rose a very stingy 0.1 percent in June with the year-on-year rate 1 tenth higher to a not-so-great plus 2.6 percent. Still the year-on-year rate is going in the right direction, though just barely and roughly in line with the Fed's most important price gauge, the PCE core which, at 1.6 percent, is also trying to climb. But the PCE core isn't expected to conquer the Fed's 2 percent target line until hourly earnings conquer the 3 percent line. Though available labor is shrinking, it hasn't been shrinking fast enough to raise wages where growth is still sub-par. Turning back to the employment report for a look at inflation pressures makes for one more nail in the rate-hike coffin. Average hourly earnings rose a very stingy 0.1 percent in June with the year-on-year rate 1 tenth higher to a not-so-great plus 2.6 percent. Still the year-on-year rate is going in the right direction, though just barely and roughly in line with the Fed's most important price gauge, the PCE core which, at 1.6 percent, is also trying to climb. But the PCE core isn't expected to conquer the Fed's 2 percent target line until hourly earnings conquer the 3 percent line. Though available labor is shrinking, it hasn't been shrinking fast enough to raise wages where growth is still sub-par.
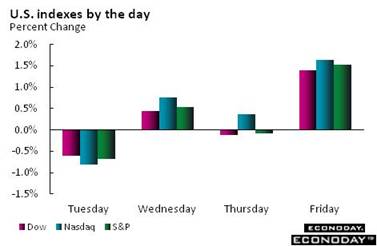 It's not easy to find anything nowadays that yields much over 1 percent -- and that includes the 10-year Treasury note which is yielding exactly 1.37 percent. This yield came down steadily through the first half of the year even as talk of a rate hike was building. And now that such talk is barely heard anymore, the yield continues to fall --7 basis points lower in the week for a year-to-date decline of 90 basis points. Money has been locked tightly into the Treasury market since the June 23rd Brexit vote, in contrast to stocks where heavy selling quickly turned into heavy bargain hunting. The Dow gained 1.1 percent on the week and, at 18,146, is just above where it was before the vote. Oil has been volatile to the downside, losing $4 in the week to just over $45 while gold has been a buy, up another 1.5 percent to 1,363 for a more than $100 post-Brexit surge. It's not easy to find anything nowadays that yields much over 1 percent -- and that includes the 10-year Treasury note which is yielding exactly 1.37 percent. This yield came down steadily through the first half of the year even as talk of a rate hike was building. And now that such talk is barely heard anymore, the yield continues to fall --7 basis points lower in the week for a year-to-date decline of 90 basis points. Money has been locked tightly into the Treasury market since the June 23rd Brexit vote, in contrast to stocks where heavy selling quickly turned into heavy bargain hunting. The Dow gained 1.1 percent on the week and, at 18,146, is just above where it was before the vote. Oil has been volatile to the downside, losing $4 in the week to just over $45 while gold has been a buy, up another 1.5 percent to 1,363 for a more than $100 post-Brexit surge.
| Markets at a Glance |
Year-End |
Week Ended |
Week Ended |
Year-To-Date |
Weekly |
|
2015 |
1-Jul-16 |
8-Jul-16 |
Change |
Change |
| DJIA |
17,425.03 |
17,949.37 |
18,146.74 |
4.1% |
1.1% |
| S&P 500 |
2,043.94 |
2,102.95 |
2,129.90 |
4.2% |
1.3% |
| Nasdaq Composite |
5,007.41 |
4,862.57 |
4,956.76 |
-1.0% |
1.9% |
|
|
|
|
|
|
| Crude Oil, WTI ($/barrel) |
$37.40 |
$49.19 |
$45.15 |
20.7% |
-8.2% |
| Gold (COMEX) ($/ounce) |
$1,060.00 |
$1,343.30 |
$1,363.30 |
28.6% |
1.5% |
|
|
|
|
|
|
| Fed Funds Target |
0.25 to 0.50% |
0.25 to 0.50% |
0.25 to 0.50% |
0 bp |
0 bp |
| 2-Year Treasury Yield |
1.05% |
0.60% |
0.62% |
–43 bp |
2 bp |
| 10-Year Treasury Yield |
2.27% |
1.44% |
1.37% |
–90 bp |
–7 bp |
| Dollar Index |
98.84 |
95.65 |
96.29 |
-2.6% |
0.7% |
Consumer spending has been very strong this year which allows room for economic slowing, gradual slowing that ultimately tracks the easing trend in the labor market. June's employment relief now puts the focus back on Brexit and its immediate effects on business plans and business spending. Whether a rate hike this year is even plausible, September or whenever, is an open question, but less in doubt for now is the stability of the economy's core strength -- nothing less than the labor market.
Inflation and the consumer are this week's two themes. Import & export prices as well as producer prices showed pressure in May tied mostly but not entirely to oil, and more of the same is expected for June. But upward effects on core consumer prices are expected to be as limited in June as they were in May. Retail sales on Friday will be the week's main focus and, due to weak vehicle sales, are expected to come down in June from very strong levels in April and May. But looking past the headline, expectations for retail sales are solid. Also on Friday will be the consumer sentiment flash for July which could offer the first indications, if any, of Brexit's impact on the consumer. More on Brexit, not to mention June's strong employment report, is certain to be heard from the week's long list of speakers that will include seven current FOMC members.
Small Business Optimism Index for June
Consensus Forecast: 94.0
Consensus Range: 93.0 to 94.1
The small business optimism index has been moving up from two-year lows, to 93.8 in May. Employment readings were positive in May and economic expectations, though still weak, did improve. This report for June could include an early Brexit effect but the consensus is positive, calling for a 2 tenths rise to 94.0.
Wholesale Inventories for May
Consensus Forecast, Month-to-Month Change: +0.2%
Consensus Range: +0.1% to +0.4%
Wholesale inventories rose a sharp 0.6 percent in April but wholesale sales also rose sharply, up 1.0 percent which made for a leaner inventory-to-sales ratio of 1.35. Forecasters see wholesale inventories rising a modest 0.2 percent in May. Note that this report is an input into the business inventories report which will be released Friday, July 15.
Import & Export Prices for June
Consensus Forecast for Import Prices, Month-to-Month Change: +0.5%
Consensus Range: +0.2% to +1.0%
Consensus Forecast for Export Prices: +0.3%
Consensus Range: -0.2% to +1.0%
A jump in petroleum prices gave a lift to much of the import & export price report in May and more of the same is expected for June where the consensus is calling for a 0.5 percent rise on the import side and a 0.3 percent rise on the export side. Deeper in the report, however, prices showed very little change especially for finished goods. Still, pressures in this report are welcome news for policy makers, particularly on the import side which points ahead to higher consumer prices.
Initial Jobless Claims for July 9 week
Consensus Forecast: 265,000
Consensus Range: 260,000 to 267,000
Initial jobless claims fell a very steep 16,000 in the July 2 week to 254,000 and was joined by a similar fall in continuing claims, both of which are at or near historic lows. Forecasters see claims giving some of the improvement back in the July 9 week, at a consensus 265,000 for what would be an 11,000 rise. Note that auto retooling in the summer can make for unexpected week-to-week swings in this data.
PPI-FD for June
Consensus Forecast, Month-to-Month Change: +0.3%
Consensus Range: 0.0% to +0.5%
PPI-FD Less Food & Energy
Consensus Forecast: +0.2%
Consensus Range: +0.1% to +0.3%
Producer prices showed strength in May, rising 0.4 percent for the best gain since May last year that was fed not only by petroleum but also by service prices. The 0.3 percent rise for the core rate (less food & energy) was also strong and further reason for optimism that price pressures may now be building at the base of the economy. Forecasters see another positive month for producer prices in June, at a consensus plus 0.3 percent for the overall rate and plus 0.2 percent for the core.
Consumer Price Index for June
Consensus Forecast, Month-to-Month Change: +0.3%
Consensus Range: +0.2% to +0.4%
CPI Core, Less Food & Energy
Consensus Forecast: +0.2%
Consensus Range: +0.1% to +0.3%
Despite gains in producer prices and import prices, consumer prices failed to show much pressure in May. But a little more pressure is expected for June with the consensus at plus 0.3 percent overall but the core at plus 0.2 percent again (less food & energy). Year-on-year rates have been not been moving higher, up about 1 percent overall and just over 2 percent for the core. Medical care has been showing the most pressure with a 3 percent rate with housing right behind at 2-1/2 percent. Food and apparel prices are under 1 percent each with energy prices, despite ongoing improvement, still down 10 percent on the year.
Retail Sales for June
Consensus Forecast: +0.1%
Consensus Range: -0.2% to +0.3%
Retail Sales Ex-Autos
Consensus Forecast: +0.5%
Consensus Range: +0.3% to +0.6%
Retail Sales Ex-Autos Ex-Gas
Consensus Forecast: +0.3%
Consensus Range: +0.3% to +0.5%
Weak vehicle sales are expected to headline what otherwise is expected to be respectable strength for the June retail sales report. Forecasters see overall sales inching only 0.1 percent higher but rising a very solid 0.5 percent when excluding vehicles. A major positive once again is certain to come from gasoline stations where sales will be inflated by higher prices. When excluding vehicles and gasoline, sales are expected to rise a still respectable 0.3 percent to extend recent gains. However unimpressive June may prove to be at the headline level, retail sales in April and May were outstanding and should support a solid rise for second-quarter GDP.
Empire State Index for July
Consensus Forecast: +5.00
Consensus Range: +2.00 to +10.20
The Empire State index has been trying to get into the air, posting a plus 6.01 in June for the third positive reading in four months. Forecasters see more of the same for July, at a consensus plus 5.00. New orders came in at a strong 10.90 in June which points to general strength through the July report. This report will offer the first anecdotal look at the immediate effects, if any, from Brexit on the U.S. factory sector. Of special interest will be the 6-month outlook which, at 34.84, was at its best level of the year in June.
Industrial Production for June
Consensus Forecast, Month-to-Month Change: +0.4%
Consensus Range: +0.1% to +0.5%
Manufacturing Production
Consensus Forecast: +0.3%
Consensus Range: +0.1% to +0.5%
Capacity Utilization Rate
Consensus Forecast: 75.0%
Consensus Range: 74.9% to 75.2%
A steep drop in vehicle production was a major negative for industrial production in May, falling 0.4 percent overall and also 0.4 percent for manufacturing where declines swept categories. But forecasters see a solid bounce back for June, at a consensus plus 0.4 percent overall and plus 0.3 percent for manufacturing. The factory sector has been held down all year by weak foreign markets, markets that are at risk of further retrenchment in reaction to Brexit.
Business Inventories for May
Consensus Forecast, Month-to-Month Change: +0.1%
Consensus Range: +0.1% to +0.3%
Despite the slow economic pace, business inventories have been kept in check by tight management. And forecasters see no tangible rise in May, at a consensus plus 0.1 percent.
Consumer Sentiment Index, July Flash
Consensus Forecast: 93.5
Consensus Range: 91.0 to 94.2
July's consumer sentiment index flash will offer an early reading of the effect, if any, from the Brexit vote. Forecasters see the flash holding unchanged at June's 93.5. This index has been very solid this year reflecting confidence in the jobs market. A plus for the June report was an uptick in inflation expectations, readings that are closely watched by policy makers.
|
