|
And that is exactly what we have now — lots of uncertainty. It will be a while before meaningful economic data will be available to judge reaction to the Brexit vote — knee jerk and otherwise. July data will not be available until sometime in August and even later for the most part. On the week, equities were mostly lower.
The Reserve Bank of Australia was the first of the major central banks to hold a policy meeting after the UK vote to leave the European Union. The Bank took no action, leaving its policy interest rate at 1.75 percent where it has been since May.
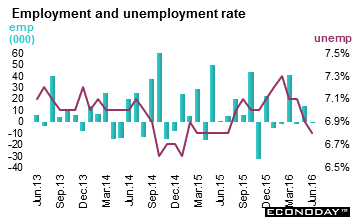
The week ended with upbeat news from the most watched economic indicator — the U.S. employment situation report. Employment after crawling up a revised 11,000 in May jumped 287,000 in June, relieving concerns about the strength of the U.S. economy. However, the unemployment rate climbed to 4.9 percent from 4.7 percent — more people entered the labor market but were still seeking jobs.
| |
|
2015 |
2016 |
% Change |
|
Index |
Dec 31 |
July 1 |
July 8 |
Week |
2016 |
| Asia/Pacific |
|
|
|
|
|
|
| Australia |
All Ordinaries |
5344.6 |
5327.0 |
5315.55 |
-0.2% |
-0.5% |
| Japan |
Nikkei 225 |
19033.7 |
15682.5 |
15106.98 |
-3.7% |
-20.6% |
| Hong Kong |
Hang Seng |
21914.4 |
20794.4 |
20564.17 |
-1.1% |
-6.2% |
| S. Korea |
Kospi |
1961.3 |
1987.3 |
1963.10 |
-1.2% |
0.1% |
| Singapore |
STI |
2882.7 |
2846.4 |
2847.04 |
0.0% |
-1.2% |
| China |
Shanghai Composite |
3539.2 |
2932.5 |
2988.09 |
1.9% |
-15.6% |
|
|
|
|
|
|
|
| India |
Sensex 30 |
26117.5 |
27144.9 |
27126.90 |
-0.1% |
3.9% |
| Indonesia |
Jakarta Composite |
4593.0 |
4971.6 |
4971.58 |
0.0% |
8.2% |
| Malaysia |
KLCI |
1692.5 |
1646.2 |
1644.54 |
-0.1% |
-2.8% |
| Philippines |
PSEi |
6952.1 |
7830.4 |
7771.52 |
-0.8% |
11.8% |
| Taiwan |
Taiex |
8338.1 |
8738.2 |
8640.91 |
-1.1% |
3.6% |
| Thailand |
SET |
1288.0 |
1445.0 |
1455.65 |
0.7% |
13.0% |
|
|
|
|
|
|
|
| Europe |
|
|
|
|
|
|
| UK |
FTSE 100 |
6242.3 |
6577.8 |
6590.64 |
0.2% |
5.6% |
| France |
CAC |
4637.1 |
4274.0 |
4190.68 |
-1.9% |
-9.6% |
| Germany |
XETRA DAX |
10743.0 |
9776.1 |
9629.66 |
-1.5% |
-10.4% |
| Italy |
FTSE MIB |
21418.4 |
16295.8 |
16066.38 |
-1.4% |
-25.0% |
| Spain |
IBEX 35 |
9544.2 |
8268.9 |
8185.90 |
-1.0% |
-14.2% |
| Sweden |
OMX Stockholm 30 |
1446.8 |
1340.3 |
1326.21 |
-1.0% |
-8.3% |
| Switzerland |
SMI |
8818.1 |
8085.2 |
8037.94 |
-0.6% |
-8.8% |
|
|
|
|
|
|
|
| North America |
|
|
|
|
|
|
| United States |
Dow |
17425.0 |
17949.4 |
18146.74 |
1.1% |
4.1% |
|
NASDAQ |
5007.4 |
4862.6 |
4956.76 |
1.9% |
-1.0% |
|
S&P 500 |
2043.9 |
2103.0 |
2129.90 |
1.3% |
4.2% |
| Canada |
S&P/TSX Comp. |
13010.0 |
14064.5 |
14259.84 |
1.4% |
9.6% |
| Mexico |
Bolsa |
42977.5 |
46213.3 |
45744.290 |
-1.0% |
6.4% |
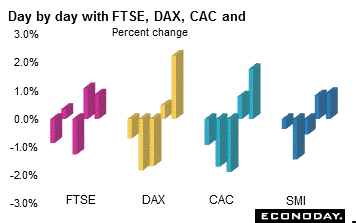 Equities in Europe and the UK gyrated between gains and losses during the week. At week's end, only the FTSE was in positive territory, up 0.2 percent. The DAX, CAC and SMI were down 1.5 percent, 1.9 percent and 0.6 percent respectively. The indexes finished the week on an upbeat note thanks to the stronger than expected U.S. jobs report. Banks were a source of strength after prospects for Italian banks improved. Monte dei Paschi is reportedly working with authorities towards a solution for its bad loans. Equities in Europe and the UK gyrated between gains and losses during the week. At week's end, only the FTSE was in positive territory, up 0.2 percent. The DAX, CAC and SMI were down 1.5 percent, 1.9 percent and 0.6 percent respectively. The indexes finished the week on an upbeat note thanks to the stronger than expected U.S. jobs report. Banks were a source of strength after prospects for Italian banks improved. Monte dei Paschi is reportedly working with authorities towards a solution for its bad loans.
According to the IMF, the Eurozone's domestic-demand driven economic recovery that had strengthened recently, is expected to slow next year, mainly due to the uncertainty created by the "Brexit" vote. The fund said that euro area GDP growth is expected to decelerate from 1.6 percent this year to 1.4 percent in 2017, mainly due to the negative impact of the UK referendum outcome.
The European Central Bank released minutes of its June 1 and 2 monetary policy meeting. Held prior to the UK vote, policymakers described the "Brexit" referendum as a major source of uncertainty for the euro area economic outlook and warned that the impact from a decision by the UK to leave the European Union would be significant. Uncertainty surrounding the British referendum was a major talking point and concerns were widely expressed about its potential impact on the region's economy via the financial markets and trade in addition to other channels. However, it also noted that anticipating Brexit effects was not easy. This strengthened the argument in favor of no rush to move on policy until its impact has become much clearer.
The ECB noted that the lack of inflation is still a serious worry and singled out the failure of the core harmonized index of consumer prices to accelerate as especially disappointing. This is consistent with recent official comments warning about the risks of second round effects and to this end, concerns were raised about the ongoing weakness of underlying prices weighing on wage growth.
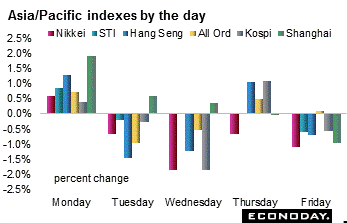 Most equity indexes were down last week with only the SET and Shanghai Composite advancing. Equities continue to trade in part on changes in oil prices. But that is not all. The unknowns surrounding Brexit continue to gnaw at investors with no resolution in sight. And worries about global growth and in particular in China and the U.S. are sending investors to the sidelines. On the week, the Nikkei led declines with a drop of 3.7 percent. The Kospi lost 1.2 percent and the Hang Seng and Taiex were both down 1.1 percent. All other losses were under 1.0 percent. The Shanghai Composite was up 1.9 percent and the SET added 0.7 percent. Most equity indexes were down last week with only the SET and Shanghai Composite advancing. Equities continue to trade in part on changes in oil prices. But that is not all. The unknowns surrounding Brexit continue to gnaw at investors with no resolution in sight. And worries about global growth and in particular in China and the U.S. are sending investors to the sidelines. On the week, the Nikkei led declines with a drop of 3.7 percent. The Kospi lost 1.2 percent and the Hang Seng and Taiex were both down 1.1 percent. All other losses were under 1.0 percent. The Shanghai Composite was up 1.9 percent and the SET added 0.7 percent.
Australian equities were buffeted during the week by the returns from last weekend's national election — the results were anything but certain. By week's end though, it appeared that the conservative Liberal National coalition will remain in office. But Prime Minister Malcolm Turnbull has lost his significant majority in the lower house and will struggle with a Senate likely to be dominated by minor parties, weakening the ability to push through changes. Because of the results, Standard and Poor's cut Australia's credit rating outlook to negative from stable and threatened a downgrade of its coveted triple A status because the results are expected to hamper efforts to stem budget deficits.
Japanese voters head to the polls Sunday for an upper-house election that Prime Minister Shinzo Abe has billed as a gauge of backing for his economic policies.
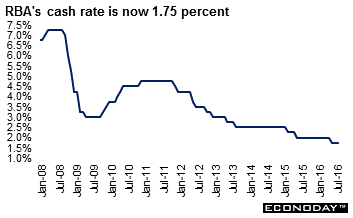 As expected, the Reserve Bank of Australia left its key interest rate at 1.75 percent where it has been since May. With the impact of Brexit on the Australian economy highly uncertain and an update on inflation due later this month, the RBA kept its policy unchanged. The RBA was the first major central bank to meet after the Brexit vote. As expected, the Reserve Bank of Australia left its key interest rate at 1.75 percent where it has been since May. With the impact of Brexit on the Australian economy highly uncertain and an update on inflation due later this month, the RBA kept its policy unchanged. The RBA was the first major central bank to meet after the Brexit vote.
In its statement, the RBA said that more information should allow it to refine its growth and inflation assessments. The Bank said that inflation was quite low and is expected to remain low for some time. It noted that low interest rates were helping to rebalance the economy but the rising Australian dollar could complicate things. Low interest rates have been supporting domestic demand and the lower exchange rate since 2013 is helping the trading sector. Financial institutions are in a position to lend and credit growth has been moderate.
Regarding Brexit, the RBA said that financial markets were volatile after the vote but functioned effectively. Funding costs for high-quality borrowers remained low and, globally, monetary policy remains remarkably accommodative. "Any effects of the referendum outcome on global economic activity remain to be seen and, outside the effects on the UK economy itself, may be hard to discern."
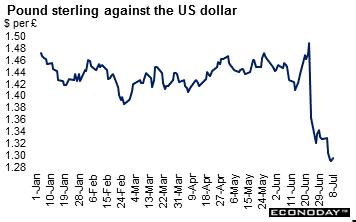 The U.S. dollar was up against the euro, pound sterling, Swiss franc and the Canadian dollar. However, it retreated against the yen and Australian dollar. The yen continues to rise toward the ¥100 mark while the pound sterling tested lows not seen in 31 years. On Wednesday, the currency fell through the $1.30 mark and its lowest level since June 1985. On Tuesday, the pound tumbled after a handful of large UK commercial property funds froze redemptions by clients. This stoked concerns that the fallout from last month's Brexit vote was gathering pace. The U.S. dollar was up against the euro, pound sterling, Swiss franc and the Canadian dollar. However, it retreated against the yen and Australian dollar. The yen continues to rise toward the ¥100 mark while the pound sterling tested lows not seen in 31 years. On Wednesday, the currency fell through the $1.30 mark and its lowest level since June 1985. On Tuesday, the pound tumbled after a handful of large UK commercial property funds froze redemptions by clients. This stoked concerns that the fallout from last month's Brexit vote was gathering pace.
Bank of England governor Mark Carney said that the BoE will do everything possible to cushion the UK economy from the adverse potential effects of Brexit. Governor Carney outlined more tools to contain the fallout from the UK's decision to quit the EU. Speaking in London, he said his concerns about pound declines had been borne out since the Brexit vote, while adding that the weaker currency should help exporters.
In its bi-annual Financial Stability Report, published Tuesday, the BoE sought to allay those concerns by cutting its capital requirements for UK lenders and pledging to implement any other measures needed. In a press conference to explain the report, Carney said the BoE's post-Brexit plan is working but warned that officials can't fully offset the volatility triggered by the referendum result.
|
|
2015 |
2016 |
% Change |
|
|
Dec 31 |
July 1 |
July 8 |
Week |
2016 |
| U.S. $ per currency |
|
|
|
|
|
|
| Australia |
A$ |
0.7288 |
0.749 |
0.757 |
1.0% |
3.8% |
| New Zealand |
NZ$ |
0.6833 |
0.716 |
0.730 |
1.9% |
6.8% |
| Canada |
C$ |
0.7231 |
0.775 |
0.767 |
-1.0% |
6.0% |
| Eurozone |
euro (€) |
1.0871 |
1.114 |
1.106 |
-0.7% |
1.7% |
| UK |
pound sterling (£) |
1.4742 |
1.328 |
1.296 |
-2.4% |
-12.1% |
|
|
|
|
|
|
|
| Currency per U.S. $ |
|
|
|
|
|
|
| China |
yuan |
6.4937 |
6.660 |
6.691 |
-0.5% |
-2.9% |
| Hong Kong |
HK$* |
7.7501 |
7.758 |
7.758 |
0.0% |
-0.1% |
| India |
rupee |
66.1537 |
67.320 |
67.370 |
-0.1% |
-1.8% |
| Japan |
yen |
120.2068 |
102.530 |
100.480 |
2.0% |
19.6% |
| Malaysia |
ringgit |
4.2943 |
3.998 |
4.035 |
-0.9% |
6.4% |
| Singapore |
Singapore $ |
1.4179 |
1.346 |
1.346 |
0.0% |
5.3% |
| South Korea |
won |
1175.0600 |
1145.100 |
1161.800 |
-1.4% |
1.1% |
| Taiwan |
Taiwan $ |
32.8620 |
32.213 |
32.304 |
-0.3% |
1.7% |
| Thailand |
baht |
36.0100 |
35.055 |
35.177 |
-0.3% |
2.4% |
| Switzerland |
Swiss franc |
1.0014 |
0.9742 |
0.9831 |
-0.9% |
1.9% |
| *Pegged to U.S. dollar |
|
|
|
|
|
|
| Source: Bloomberg |
|
|
|
|
|
|
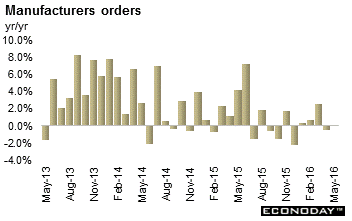 May manufacturing orders were unchanged on the month and on the year following a marginally smaller revised 1.9 percent drop in April. The softness of the May headline data reflected a 2.9 percent monthly drop in basic goods and a 0.4 percent decrease in consumer & durable goods, offset by a 1.9 percent increase in capital goods. Domestic orders were down 1.9 percent and so more than reversed April's 1.6 percent increase, while overseas demand expanded 1.4 percent after a 4.3 percent slump last time. Within the latter, orders from the Eurozone were up 4.0 percent, compounding a 2.5 percent advance in April. May manufacturing orders were unchanged on the month and on the year following a marginally smaller revised 1.9 percent drop in April. The softness of the May headline data reflected a 2.9 percent monthly drop in basic goods and a 0.4 percent decrease in consumer & durable goods, offset by a 1.9 percent increase in capital goods. Domestic orders were down 1.9 percent and so more than reversed April's 1.6 percent increase, while overseas demand expanded 1.4 percent after a 4.3 percent slump last time. Within the latter, orders from the Eurozone were up 4.0 percent, compounding a 2.5 percent advance in April.
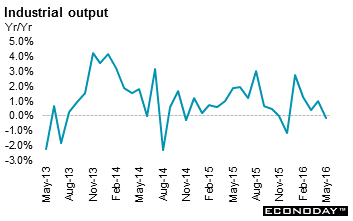 May industrial output excluding construction dropped 1.3 percent following a weaker revised 0.5 percent monthly increase in April. The May decline in output was the worst since August 2014. Annual growth dropped from 0.8 percent to minus 0.4 percent, its first sub-zero reading so far in 2016. Among the major sectors, production consumer goods output was up 0.5 percent and energy was up 3.9 percent. However, the improvement was more than offset by declines in intermediates (0.3 percent) and capital goods (3.9 percent). May industrial output excluding construction dropped 1.3 percent following a weaker revised 0.5 percent monthly increase in April. The May decline in output was the worst since August 2014. Annual growth dropped from 0.8 percent to minus 0.4 percent, its first sub-zero reading so far in 2016. Among the major sectors, production consumer goods output was up 0.5 percent and energy was up 3.9 percent. However, the improvement was more than offset by declines in intermediates (0.3 percent) and capital goods (3.9 percent).
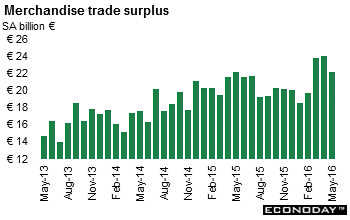 May seasonally adjusted trade surplus narrowed from a minimally larger revised record €24.1 billion in April to €22.2 billion in May. The unadjusted surplus was slightly smaller at €21.0 billion after €25.7 billion at the start of the quarter. The decline in the adjusted surplus reflected mainly a 1.9 percent monthly drop in exports, their first decrease since January and the steepest since August 2015. Imports were up just 0.1 percent following consecutive declines amounting to nearly 3 percent in March and April. Compared with a year ago, exports were up an unadjusted 1.6 percent and imports down 0.1 percent. May seasonally adjusted trade surplus narrowed from a minimally larger revised record €24.1 billion in April to €22.2 billion in May. The unadjusted surplus was slightly smaller at €21.0 billion after €25.7 billion at the start of the quarter. The decline in the adjusted surplus reflected mainly a 1.9 percent monthly drop in exports, their first decrease since January and the steepest since August 2015. Imports were up just 0.1 percent following consecutive declines amounting to nearly 3 percent in March and April. Compared with a year ago, exports were up an unadjusted 1.6 percent and imports down 0.1 percent.
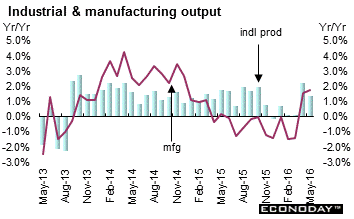 May industrial output was down 0.5 percent following a larger revised 2.1 percent surge in April. Annual growth was 1.4 percent, down from 2.2 percent. The key manufacturing sector also recorded a 0.5 percent monthly decline after an upwardly revised 2.4 percent increase at the start of the quarter. Setbacks were most apparent in textiles & leather (minus 6.0 percent), electrical equipment (minus 3.9 percent) and pharmaceuticals (minus 6.5 percent). However, partial offsets were provided by coke & petroleum (13.6 percent), computer, electronic & optical products (2.1 percent) and food, drink & tobacco (1.4 percent). Overall industrial production was hit by a 0.1 percent monthly dip in mining & quarrying and a 2.9 percent slide in gas & electricity but water supply was up 1.5 percent. May industrial output was down 0.5 percent following a larger revised 2.1 percent surge in April. Annual growth was 1.4 percent, down from 2.2 percent. The key manufacturing sector also recorded a 0.5 percent monthly decline after an upwardly revised 2.4 percent increase at the start of the quarter. Setbacks were most apparent in textiles & leather (minus 6.0 percent), electrical equipment (minus 3.9 percent) and pharmaceuticals (minus 6.5 percent). However, partial offsets were provided by coke & petroleum (13.6 percent), computer, electronic & optical products (2.1 percent) and food, drink & tobacco (1.4 percent). Overall industrial production was hit by a 0.1 percent monthly dip in mining & quarrying and a 2.9 percent slide in gas & electricity but water supply was up 1.5 percent.
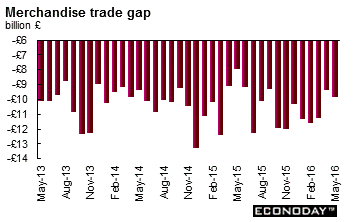 May global deficit on trade in goods was Stg9.88 billion after a significantly downwardly revised Stg9.41 billion in April. Excluding oil and other erratic items the shortfall widened out slightly from Stg9.47 billion to Stg9.70 billion. The monthly headline deterioration was attributable to an 8.2 percent drop in exports that unwound April's surge and more than offset a 4.7 percent drop in imports. The bilateral deficit with the rest of the EU climbed from Stg6.90 billion to Stg7.31 billion but the shortfall with the rest of the world was essentially flat at Stg2.57 billion. The data have been especially erratic in recent months but the signs are that net exports provided a boost to second quarter GDP growth having weighed quite heavily at the start of the year. May global deficit on trade in goods was Stg9.88 billion after a significantly downwardly revised Stg9.41 billion in April. Excluding oil and other erratic items the shortfall widened out slightly from Stg9.47 billion to Stg9.70 billion. The monthly headline deterioration was attributable to an 8.2 percent drop in exports that unwound April's surge and more than offset a 4.7 percent drop in imports. The bilateral deficit with the rest of the EU climbed from Stg6.90 billion to Stg7.31 billion but the shortfall with the rest of the world was essentially flat at Stg2.57 billion. The data have been especially erratic in recent months but the signs are that net exports provided a boost to second quarter GDP growth having weighed quite heavily at the start of the year.
 May retail sales were up a less than expected 0.2 percent after inching up 0.1 percent in April. Expectations were for a 3 percent increase. On the year, sales were up 3.4 percent. Food retailing was up 0.7 percent, other retailing gained 1.4 percent and cafes, restaurants & takeaway food services added 0.3 percent. Department stores were virtually unchanged. However, household goods retailing declined 1.1 percent while clothing, footwear & personal accessory retailing was 1.2 percent lower. Sales in New South Wales, Victoria and South Australia increased. In Tasmania sales were relatively unchanged. Retail sales were down in Western Australia, Queensland, the Northern Territory and the Australian Capital Territory. May retail sales were up a less than expected 0.2 percent after inching up 0.1 percent in April. Expectations were for a 3 percent increase. On the year, sales were up 3.4 percent. Food retailing was up 0.7 percent, other retailing gained 1.4 percent and cafes, restaurants & takeaway food services added 0.3 percent. Department stores were virtually unchanged. However, household goods retailing declined 1.1 percent while clothing, footwear & personal accessory retailing was 1.2 percent lower. Sales in New South Wales, Victoria and South Australia increased. In Tasmania sales were relatively unchanged. Retail sales were down in Western Australia, Queensland, the Northern Territory and the Australian Capital Territory.
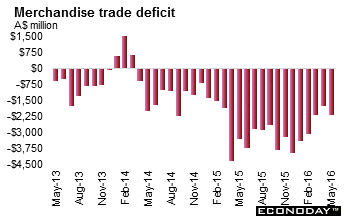 The May merchandise trade deficit increased to A$2.2 billion from April's deficit of A$1.8 billion. Exports were up 0.7 percent on the month and 3.1 percent from a year ago while imports were 2.2 percent higher on the month and down 1.1 percent from a year ago. Exports of non-rural goods were up 3.0 percent while rural goods were down 2.0 percent. Imports of intermediate & other merchandise goods were up 5 percent while capital goods were up 4 percent. Consumption goods slipped 1.0 percent. The May merchandise trade deficit increased to A$2.2 billion from April's deficit of A$1.8 billion. Exports were up 0.7 percent on the month and 3.1 percent from a year ago while imports were 2.2 percent higher on the month and down 1.1 percent from a year ago. Exports of non-rural goods were up 3.0 percent while rural goods were down 2.0 percent. Imports of intermediate & other merchandise goods were up 5 percent while capital goods were up 4 percent. Consumption goods slipped 1.0 percent.
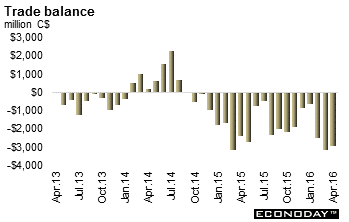 May merchandise trade deficit was C$3.28 billion following a larger revised C$3.32 billion deficit in April. The minor improvement reflected a 0.7 percent drop in exports that was just more than offset by a 0.8 percent decline in imports. The bilateral surplus with the U.S. widened sharply from C$1.31 billion to C$2.76 billion. A 3.6 percent monthly increase in sales across the border contrasted with a 1.1 percent decrease in purchases. However, the real trade position deteriorated quite significantly as total exports slumped 2.3 percent from April while their import counterpart fell only 0.8 percent. The monthly decline in overall nominal exports would have been much sharper but for a 7.1 percent jump in the energy subsector as a 9.7 percent surge in prices eclipsed a 2.3 percent drop in volumes. The other main advances were posted by forestry products & building & packaging materials (2.1 percent) and aircraft & parts (2.2 percent). All other categories declined notably including industrial machinery, equipment & parts (4.9 percent) and metal & non-metallic mineral products (5.4 percent). Imports were hit mainly by a 24.2 percent plunge in metal ores & non-metallic minerals and a 23.5 percent slide in aircraft & parts. May merchandise trade deficit was C$3.28 billion following a larger revised C$3.32 billion deficit in April. The minor improvement reflected a 0.7 percent drop in exports that was just more than offset by a 0.8 percent decline in imports. The bilateral surplus with the U.S. widened sharply from C$1.31 billion to C$2.76 billion. A 3.6 percent monthly increase in sales across the border contrasted with a 1.1 percent decrease in purchases. However, the real trade position deteriorated quite significantly as total exports slumped 2.3 percent from April while their import counterpart fell only 0.8 percent. The monthly decline in overall nominal exports would have been much sharper but for a 7.1 percent jump in the energy subsector as a 9.7 percent surge in prices eclipsed a 2.3 percent drop in volumes. The other main advances were posted by forestry products & building & packaging materials (2.1 percent) and aircraft & parts (2.2 percent). All other categories declined notably including industrial machinery, equipment & parts (4.9 percent) and metal & non-metallic mineral products (5.4 percent). Imports were hit mainly by a 24.2 percent plunge in metal ores & non-metallic minerals and a 23.5 percent slide in aircraft & parts.
 June employment was down 700 following May's near-14,000 gain. However, with the participation rate down a couple of ticks at 65.5 percent, this was still firm enough to see the unemployment rate dip another 0.1 percentage point to 6.8 percent, its lowest since January 2015. Full time jobs declined 40,100 but were almost offset by a 39,400 advance in part-time positions. Private sector payrolls were down 10,500 and the public sector shed 27,900. The headline data would have looked a lot worse but for a 37,700 jump in the number of people self-employed. At a sector level weakness was concentrated in goods producing industries where employment decreased some 46,200. Within this, manufacturing was off 12,900 and construction 28,700 but all of the main sub-sectors also recorded losses. By contrast, services added a net 45,500, led by accommodation & food (20,200), information, culture & recreation (14,100) and trade (12,500). Professional, scientific & technical services (10,000) also had a decent month but there were declines in education (9,800), business, building & other support services (4,000) and in other services (9,300). June employment was down 700 following May's near-14,000 gain. However, with the participation rate down a couple of ticks at 65.5 percent, this was still firm enough to see the unemployment rate dip another 0.1 percentage point to 6.8 percent, its lowest since January 2015. Full time jobs declined 40,100 but were almost offset by a 39,400 advance in part-time positions. Private sector payrolls were down 10,500 and the public sector shed 27,900. The headline data would have looked a lot worse but for a 37,700 jump in the number of people self-employed. At a sector level weakness was concentrated in goods producing industries where employment decreased some 46,200. Within this, manufacturing was off 12,900 and construction 28,700 but all of the main sub-sectors also recorded losses. By contrast, services added a net 45,500, led by accommodation & food (20,200), information, culture & recreation (14,100) and trade (12,500). Professional, scientific & technical services (10,000) also had a decent month but there were declines in education (9,800), business, building & other support services (4,000) and in other services (9,300).
Concerns about the fallout from Brexit surfaced again, sending most equity indexes lower for the week. Economic data in Europe were disappointing while data for the U.S. were mixed. The Reserve Bank of Australia left its key interest rate at 1.75 percent. Results from Australia's national election are still being tallied but Prime Minister Malcolm Turnbull appears to have won an exceedingly close race. The U.S. employment increase beat all forecasts.
The Banks of Canada and England meet this week. While the Bank of Canada is expected to remain on hold, the forecasts for the Bank of England are all over the place. The BoE in the past has generally changed policy in the same month they issue their Quarterly Inflation Report. That would be August. The BoE's current policy interest rate is 0.5 percent. However, expectations for the July meeting range from no policy change to lowering its interest rate anywhere from 25 basis points to 50. And there are expectations of an increase in its asset purchase ceiling from its current £375 billion.
| Central Bank activities |
|
| July 13 |
Canada |
Bank of Canada Monetary Policy Announcement |
|
United States |
Federal Reserve Publishes Beige Book |
| July 14 |
UK |
Bank of England Monetary Policy Announcement |
| |
|
|
| The following indicators will be released this week... |
| Europe |
|
|
| July 13 |
Eurozone |
Industrial Production (May) |
| July 15 |
Eurozone |
Merchandise Trade (May) |
| |
|
|
| Asia/Pacific |
|
|
| July 11 |
Japan |
Private Machine Orders (May) |
| July 12 |
Japan |
Producer Price Index (June) |
|
India |
Consumer Price Index (June) |
|
|
Industrial Production (May) |
| July 13 |
China |
Merchandise Trade (June) |
| July 14 |
Australia |
Labour Force Survey (June) |
| July 15 |
China |
Gross Domestic Product (Q2.2016) |
|
|
Industrial Production (June) |
|
|
Retail Sales (June) |
| |
|
|
| Americas |
|
|
| July 15 |
Canada |
Manufacturing Sales (May) |
Anne D Picker is the author of International Economic Indicators and Central Banks.
|
