|
The outsized 287,000 gain in nonfarm payrolls, posted at the beginning of the month, should have told us something about subsequent June data during the middle of the month. Retail sales, a strength of the economy, posted some sizable numbers in June that were much higher than expected. Accompanying the surprise was industrial production, a not-so-great strength of the economy that suddenly kicked in as the second quarter ended.
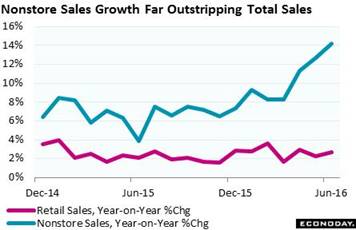 Consumer spending could be softening was the warning from the latest Beige Book, an assessment of anecdotal reports compiled for FOMC policy makers. That assessment, however, looks to get a well-deserved upgrade following what proved to be a simply sensational June. Retail sales -- despite weakness in auto sales -- cranked out a 0.6 percent gain in the month led by wide strength across most readings. Strength in ecommerce remains a dominant theme of the retail sector as nonstore retailers popped a 1.1 percent gain in the month which follows even stronger gains in prior months. Year-on-year, nonstore sales are up 14.2 percent to easily lead the report where total sales are up only 2.7 percent. Department stores, up 0.9 percent in the month, posted a big comeback with sporting goods & hobbies strong for a second month. But truly on the soft side, motor vehicles rose only 0.1 percent after falling 0.5 percent in May, two weak months that point perhaps to bounce-back strength for the July retail sales report. A continuing theme of all the recent retail reports has been strength in gasoline stations where, however, gains reflect price change much more than any shift higher in underlying demand, that is gallons actually pumped. Stripping out gasoline stations, retail sales rose 0.5 percent in June, not bad. Consumer spending could be softening was the warning from the latest Beige Book, an assessment of anecdotal reports compiled for FOMC policy makers. That assessment, however, looks to get a well-deserved upgrade following what proved to be a simply sensational June. Retail sales -- despite weakness in auto sales -- cranked out a 0.6 percent gain in the month led by wide strength across most readings. Strength in ecommerce remains a dominant theme of the retail sector as nonstore retailers popped a 1.1 percent gain in the month which follows even stronger gains in prior months. Year-on-year, nonstore sales are up 14.2 percent to easily lead the report where total sales are up only 2.7 percent. Department stores, up 0.9 percent in the month, posted a big comeback with sporting goods & hobbies strong for a second month. But truly on the soft side, motor vehicles rose only 0.1 percent after falling 0.5 percent in May, two weak months that point perhaps to bounce-back strength for the July retail sales report. A continuing theme of all the recent retail reports has been strength in gasoline stations where, however, gains reflect price change much more than any shift higher in underlying demand, that is gallons actually pumped. Stripping out gasoline stations, retail sales rose 0.5 percent in June, not bad.
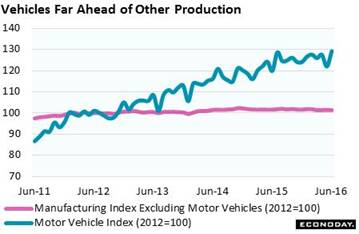 What was not a strength for June retail sales was a central strength for June industrial production, that is vehicles where production surged 5.9 percent to more than reverse a 4.3 percent drop in May. Year-on-year, this industry tops the list with 7.8 percent growth compared to only 0.4 percent growth for manufacturing as a whole. And overall manufacturing, due to vehicles, managed to put in a good showing in the June industrial production report, up 0.4 percent on the month to reverse a 0.3 percent decline in May. When including utilities and mining, overall industrial production rose 0.6 percent — 1 tenth over Econoday's high-end estimate. If the strength of this report plays out into the durable goods report at month end, second-quarter GDP could be getting a surprise lift from the factory sector. What was not a strength for June retail sales was a central strength for June industrial production, that is vehicles where production surged 5.9 percent to more than reverse a 4.3 percent drop in May. Year-on-year, this industry tops the list with 7.8 percent growth compared to only 0.4 percent growth for manufacturing as a whole. And overall manufacturing, due to vehicles, managed to put in a good showing in the June industrial production report, up 0.4 percent on the month to reverse a 0.3 percent decline in May. When including utilities and mining, overall industrial production rose 0.6 percent — 1 tenth over Econoday's high-end estimate. If the strength of this report plays out into the durable goods report at month end, second-quarter GDP could be getting a surprise lift from the factory sector.
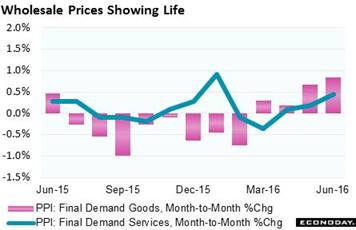 Things are getting exciting when one reading after another shows strength. And there's a little of this feeling in the week's heavy run of inflation data where early indications of pressure at the base of the production pipeline are, however, not yet appearing in consumer prices, at least not much. Let's look first at where pressure is building. The producer price index for June rose a very sizable 0.5 percent with ex-food & energy up 0.4 percent, both 2 tenths higher than expected and 1 tenth higher than May. Service prices are an emerging strength in this report, up 0.5 percent in June for the third straight gain. Sustained gains here would not only point to pass-through of higher energy prices but also perhaps to fundamental strength in demand. Goods prices at the wholesale level, inflated by higher energy prices, rose 0.8 percent in the month for a fourth straight gain. Things are getting exciting when one reading after another shows strength. And there's a little of this feeling in the week's heavy run of inflation data where early indications of pressure at the base of the production pipeline are, however, not yet appearing in consumer prices, at least not much. Let's look first at where pressure is building. The producer price index for June rose a very sizable 0.5 percent with ex-food & energy up 0.4 percent, both 2 tenths higher than expected and 1 tenth higher than May. Service prices are an emerging strength in this report, up 0.5 percent in June for the third straight gain. Sustained gains here would not only point to pass-through of higher energy prices but also perhaps to fundamental strength in demand. Goods prices at the wholesale level, inflated by higher energy prices, rose 0.8 percent in the month for a fourth straight gain.
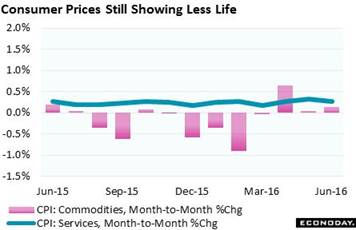 Now let's look at where these pressures have yet to manifest themselves. Consumer prices rose only 0.2 percent for a weak year-on-year rate that is not going in the right direction, at plus 1.0 percent vs 1.1 percent in the prior three months. Ex-food & gas, consumer inflation also rose 0.2 percent with this year-on-year rate moving 1 tenth higher to a respectable but still stubbornly soft 2.3 percent (Yes, this core reading is above the Fed's 2 percent target line, a line however that is not linked to the CPI core but to the PCE core which, given different methodology and inputs, consistently runs about 1/2 point below the CPI). An unquestionable highlight of the June consumer price report is the same as the producer price report and that is service prices which rose a constructive 0.3 percent for the third straight month in a row. The gain here helps offset weakness in commodity prices which rose only 0.1 percent (to be precise, up 0.14 percent vs May's 0.04 percent gain as seen in the graph). Among other readings in the report, lodging away from home (for you vacationers) posted an outsized gain for a second straight month, at plus 0.6 vs May's 0.7 percent, though housing overall remains flat at only plus 0.2 percent. Transportation rose 0.6 percent in the month with medical care up 0.4 percent, gains offset by a 0.1 percent decline for food and a 0.4 percent dip for apparel. For consumer prices overall, the pass through of higher energy prices has been limited but if it picks up steam, and if underlying demand is strong enough to lift service prices and especially wages (the latter of course is a story in its own), policy makers may become more confident that inflation is at last, thankfully, on the rise. Now let's look at where these pressures have yet to manifest themselves. Consumer prices rose only 0.2 percent for a weak year-on-year rate that is not going in the right direction, at plus 1.0 percent vs 1.1 percent in the prior three months. Ex-food & gas, consumer inflation also rose 0.2 percent with this year-on-year rate moving 1 tenth higher to a respectable but still stubbornly soft 2.3 percent (Yes, this core reading is above the Fed's 2 percent target line, a line however that is not linked to the CPI core but to the PCE core which, given different methodology and inputs, consistently runs about 1/2 point below the CPI). An unquestionable highlight of the June consumer price report is the same as the producer price report and that is service prices which rose a constructive 0.3 percent for the third straight month in a row. The gain here helps offset weakness in commodity prices which rose only 0.1 percent (to be precise, up 0.14 percent vs May's 0.04 percent gain as seen in the graph). Among other readings in the report, lodging away from home (for you vacationers) posted an outsized gain for a second straight month, at plus 0.6 vs May's 0.7 percent, though housing overall remains flat at only plus 0.2 percent. Transportation rose 0.6 percent in the month with medical care up 0.4 percent, gains offset by a 0.1 percent decline for food and a 0.4 percent dip for apparel. For consumer prices overall, the pass through of higher energy prices has been limited but if it picks up steam, and if underlying demand is strong enough to lift service prices and especially wages (the latter of course is a story in its own), policy makers may become more confident that inflation is at last, thankfully, on the rise.
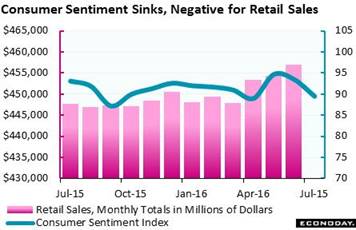 There was one report in the week, however, that came up short. In perhaps an early indication of a U.S. Brexit effect, the consumer sentiment flash for July fell a sharp 4.0 points to 89.5. Weakness is centered in the expectations component which fell 5.3 points to 77.1 for one of the very lowest readings of the last two years. Weakness in expectations ultimately points to doubts over the jobs outlook. The assessment of current conditions is more optimistic, at 108.7 for a 2.1 point dip but still one of the strongest readings over the last year. But the expectations component could reflect Brexit effects and related market volatility though this report is isolated, as the weekly consumer comfort index has not been picking up any rumbles at all and has in fact moved to its best readings of the year. In any case, consumer confidence indications are often subject to swings that, if brief enough, have little effect on underlying spending. There was one report in the week, however, that came up short. In perhaps an early indication of a U.S. Brexit effect, the consumer sentiment flash for July fell a sharp 4.0 points to 89.5. Weakness is centered in the expectations component which fell 5.3 points to 77.1 for one of the very lowest readings of the last two years. Weakness in expectations ultimately points to doubts over the jobs outlook. The assessment of current conditions is more optimistic, at 108.7 for a 2.1 point dip but still one of the strongest readings over the last year. But the expectations component could reflect Brexit effects and related market volatility though this report is isolated, as the weekly consumer comfort index has not been picking up any rumbles at all and has in fact moved to its best readings of the year. In any case, consumer confidence indications are often subject to swings that, if brief enough, have little effect on underlying spending.
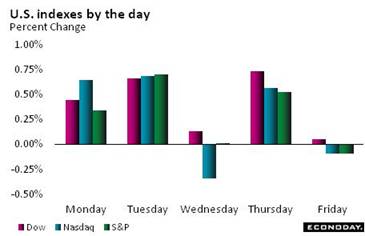 A question over nearly the last generation is whether the deflationary stagnation in Japan is isolated to Japan or is actually an unpleasant taste of what's ahead for everybody else as well. The slow growth of this cycle, not to mention all the non-conventional monetary policy, does evoke the Japanese experience as does the tight packing into a low yield bond market. This packing eased in the latest week where the Brexit move to safety was reversed but yields are still near historic lows, at 0.70 percent for the 2-year Treasury and 1.57 percent for the 10-year. The movement out of bonds flowed into stocks where the Dow closed the week at 18,516, a new record and a 2.0 percent weekly gain. The strength in the stock market together with the week's strength for economic data point perhaps to better growth ahead, indications for life ahead that however are not being supported by what are still very low interest rates. A question over nearly the last generation is whether the deflationary stagnation in Japan is isolated to Japan or is actually an unpleasant taste of what's ahead for everybody else as well. The slow growth of this cycle, not to mention all the non-conventional monetary policy, does evoke the Japanese experience as does the tight packing into a low yield bond market. This packing eased in the latest week where the Brexit move to safety was reversed but yields are still near historic lows, at 0.70 percent for the 2-year Treasury and 1.57 percent for the 10-year. The movement out of bonds flowed into stocks where the Dow closed the week at 18,516, a new record and a 2.0 percent weekly gain. The strength in the stock market together with the week's strength for economic data point perhaps to better growth ahead, indications for life ahead that however are not being supported by what are still very low interest rates.
| Markets at a Glance |
Year-End |
Week Ended |
Week Ended |
Year-To-Date |
Weekly |
|
2015 |
8-Jul-16 |
15-Jul-16 |
Change |
Change |
| DJIA |
17,425.03 |
18,146.74 |
18,516.55 |
6.3% |
2.0% |
| S&P 500 |
2,043.94 |
2,129.90 |
2,161.74 |
5.8% |
1.5% |
| Nasdaq Composite |
5,007.41 |
4,956.76 |
5,029.59 |
0.4% |
1.5% |
|
|
|
|
|
|
| Crude Oil, WTI ($/barrel) |
$37.40 |
$45.15 |
$45.95 |
22.9% |
1.8% |
| Gold (COMEX) ($/ounce) |
$1,060.00 |
$1,363.30 |
$1,329.00 |
25.4% |
-2.5% |
|
|
|
|
|
|
| Fed Funds Target |
0.25 to 0.50% |
0.25 to 0.50% |
0.25 to 0.50% |
0 bp |
0 bp |
| 2-Year Treasury Yield |
1.05% |
0.62% |
0.70% |
–35 bp |
8 bp |
| 10-Year Treasury Yield |
2.27% |
1.37% |
1.57% |
–70 bp |
20 bp |
| Dollar Index |
98.84 |
96.29 |
96.53 |
-2.3% |
0.2% |
The first hints of Brexit may be appearing in consumer sentiment yet whether this holds or in fact has any bearing on consumer spending still has to play out, if it plays out at all. The June retail sales report is the big surprise in the week and when combined with the even stronger retail sales report for April (when sales rose 1.2 percent), they point to a heady second quarter for consumer spending, one that if combined with continued strength in employment could definitely open the door for a rate hike at the September FOMC.
Housing is the week's theme, led by the housing market index on Monday and the latest update from home builders who, despite uneven pricing and lack of supply, have been enjoying some of the best conditions in the economy. Housing starts & permits follow on Tuesday with both expected to post gains. FHFA house prices, however, are not expected to show much strength as year-on-year growth for this index struggles at the 6 percent line. Taking Thursday's focus will be jobless claims which have been surprisingly low and will cover the sample week of the monthly employment report.
Housing Market Index for July
Consensus Forecast: 61
Consensus Range: 59 to 62
The housing market index came alive in June, rising 2 points to 60 and ending four straight months at 58. And more strength is expected for July where forecasters are calling for a 1 point gain to 61. Improvement in traffic was a big plus for June and a similar gain for July would lift what is becoming a solidly favorable outlook for new homes.
Housing Starts for June
Consensus Forecast, Adjusted Annualized Rate: 1.170 million
Consensus Range: 1.130 to 1.210 million
Housing Permits
Consensus Forecast: 1.150 million
Consensus Range: 1.118 to 1.225 million
Solid gains are expected for both housing starts and housing permits, with forecasters calling for a 0.5 percent rise in June to a 1.170 million annualized pace for starts and a 1.1 permit gain for permits to a 1.150 million rate that would follow a 0.7 percent gain in May. Still, the trend for permits, in contrast to strength for starts, has been soft with the year-on-year rate in low double-digit contraction. The housing sector has been struggling to gain solid traction this year, embodied by the mixed readings in this report
Initial Jobless Claims for July 16 week
Consensus Forecast: 265,000
Consensus Range: 260,000 to 270,000
Initial jobless claims fell a very steep 16,000 in the July 2 week to 254,000 and surprisingly held there in the July 9 week. But easing in strength is expected in the July 16 week with forecasters calling for an 11,000 rise to 265,000. The July 16 week is also the sample week for the monthly employment report and 265,000 would be marginally above the 258,000 level of the June sample week. Seasonal layoffs tied to auto retooling, which inflate claims levels, have yet to appear so far this summer.
Philadelphia Fed Manufacturing Index for July
Consensus Forecast: +5.0
Consensus Range: 0.0 to +9.0
The Philadelphia Fed index is expected to hold near June's level, at a plus 5.0 consensus that would indicate no more than modest growth in the mid-Atlantic manufacturing sector. But the details for June were decidedly soft with new orders at minus 3.0 and backlog orders at minus 12.6. The Empire State index for July, which precedes this report, came in barely above zero to underscore the continuing struggles for the factory sector, struggles that perhaps may build as Brexit unfolds.
FHFA House Price Index for May
Consensus Forecast: +0.4%
Consensus Range: +0.2% to +0.6%
FHFA house price index broke lower in April, slowing to a 0.2 percent gain. A 0.4 percent gain is expected for June, one however that would still be on the soft side for this reading. Year-on-year, the rate has been struggling to hold at the 6.0 percent line, slipping 3 tenths in April to what is still a very respectable 5.9 percent. Home-price appreciation is of special importance in a low inflation, low wage growth economy.
Existing Home Sales for May
Consensus Forecast, Annualized Rate: 5.475 million
Consensus Range: 5.400 to 5.560 million
Sales of existing homes rose a solid 1.8 percent gain in May to a recovery best annualized rate of 5.530 million but a 1.0 percent give back is expected for June where the consensus is calling for a 5.475 million rate. Prices in this report have been grinding higher and homes have been moving into the market. Housing itself is only moderately strong but relative to other sectors is a standout performer.
Index of Leading Economic Indicators for June
Consensus Forecast, Month-to-Month Change: +0.3%
Consensus Range: -0.1% to +0.4%
The index of leading indicators is expected to rise a moderately strong 0.3 percent in June which would reverse May's 0.2 percent dip. Positives for June look to be unemployment claims, which moved lower, and consumer confidence which, before Brexit, were moving higher. A decline in the factory workweek, posted in the June employment report, looks to be a negative. This report has been mixed this year and has been offering uncertain signals on the economic outlook.
Manufacturing PMI, July Flash
Consensus Forecast: 51.9
Consensus Range: 50.8 to 52.5
The manufacturing PMI has been inching higher and further progress, perhaps based on the surprise strength of the June industrial production report, is expected for July. Forecasters see the flash coming in at 51.9 vs 51.3 for final June and 51.4 for the June flash. June saw a pickup in new orders and a 2-year high in export growth. Production was also up as was employment. Still, readings in this report have been no more than modest at best.
|
