|
The doomsdayers are looking for the lifeboats again, unnerved by the soggy looking 1.2 percent headline for second-quarter GDP that has them revising down longer-term expectations for the nation's growth. But the details of the report offer reasons for hope, not panic. As long as the consumer stays afloat, and consumers are looking plenty buoyant, then the outlook for the U.S. economy isn't really underwater.
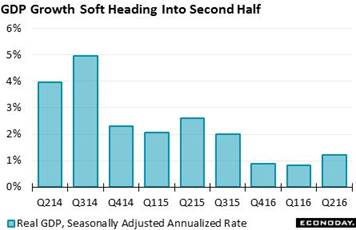 Second-quarter GDP looks very weak at only a quarter-to-quarter plus 1.2 percent inflation-adjusted annualized rate, but the details are positive -- perhaps very positive in fact. Yes the 1.2 percent rate is way below the Econoday consensus for 2.6 percent and also way below Econoday's low estimate for 2.2 percent. And the second-quarter pace follows two even weaker quarters of 0.8 and 0.9 percent growth, paltry results that make the low 2 percent trend of the prior four quarters look, not moderate as it is, but positively robust. But one of the biggest negatives of the second quarter -- inventories -- definitely has a positive side. A draw in inventories is actually a good thing and is the difference between the 1.2 percent headline rate that was posted and what was expected. Inventory change subtracted 1.2 percentage points from GDP, down $8.1 billion in the quarter for the first outright contraction since the third quarter of 2011 and only the second of the whole cycle. The contraction in inventories, like the contraction in business investment which we'll get to in a minute, definitely does reflect lack of business confidence in the outlook, but more immediately the contraction reduces the risk of inventory overhang and the risk of related production and employment cutbacks. Second-quarter GDP looks very weak at only a quarter-to-quarter plus 1.2 percent inflation-adjusted annualized rate, but the details are positive -- perhaps very positive in fact. Yes the 1.2 percent rate is way below the Econoday consensus for 2.6 percent and also way below Econoday's low estimate for 2.2 percent. And the second-quarter pace follows two even weaker quarters of 0.8 and 0.9 percent growth, paltry results that make the low 2 percent trend of the prior four quarters look, not moderate as it is, but positively robust. But one of the biggest negatives of the second quarter -- inventories -- definitely has a positive side. A draw in inventories is actually a good thing and is the difference between the 1.2 percent headline rate that was posted and what was expected. Inventory change subtracted 1.2 percentage points from GDP, down $8.1 billion in the quarter for the first outright contraction since the third quarter of 2011 and only the second of the whole cycle. The contraction in inventories, like the contraction in business investment which we'll get to in a minute, definitely does reflect lack of business confidence in the outlook, but more immediately the contraction reduces the risk of inventory overhang and the risk of related production and employment cutbacks.
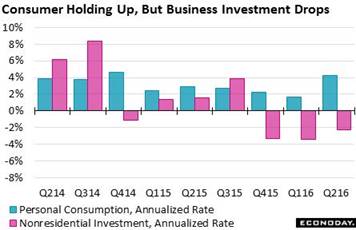 But low inventories are only half of the good news. The biggest positive is consumer spending where growth, showing strength across all readings, came in at a stellar 4.2 percent rate, more than double the first-quarter's 1.6 percent rate and adding 2.8 percentage points to the second-quarter's results. The biggest spending gain came in durables reflecting a blockbuster April for vehicle sales which, however, did quiet down in May and June. Spending on services during the quarter was strong as was spending on nondurables, the latter however inflated by the quarter's rise in petroleum prices. Caveats aside, the 4.2 percent consumer spending rate ties for the second strongest of the cycle behind a raging 4.6 percent rate in fourth-quarter 2014. But low inventories are only half of the good news. The biggest positive is consumer spending where growth, showing strength across all readings, came in at a stellar 4.2 percent rate, more than double the first-quarter's 1.6 percent rate and adding 2.8 percentage points to the second-quarter's results. The biggest spending gain came in durables reflecting a blockbuster April for vehicle sales which, however, did quiet down in May and June. Spending on services during the quarter was strong as was spending on nondurables, the latter however inflated by the quarter's rise in petroleum prices. Caveats aside, the 4.2 percent consumer spending rate ties for the second strongest of the cycle behind a raging 4.6 percent rate in fourth-quarter 2014.
Now let's face the unequivocally bad news and it's centered, as it has been this whole cycle, on business investment. Fixed nonresidential investment fell at a 2.2 percent rate in the quarter for the third decline in a row. Three straight negatives are very rare and are associated with recessions, whether emerging from one or (and this I know is an ominous note) when entering one. And certainly concerns over Brexit effects on global demand won't be giving much lift to ongoing business investment which is bad news for what is already a shaky outlook on productivity growth. But ending on a bad note is bad form so let's move back to good news. One of the positives of the second quarter came from global demand as exports rose at a 1.4 percent rate for first gain of the last four quarters. Dollar depreciation is no doubt behind the second-quarter strength in exports which raises the unhappy question whether the post-Brexit surge in the dollar (a surge that fortunately may be easing) will limit further improvement in exports.
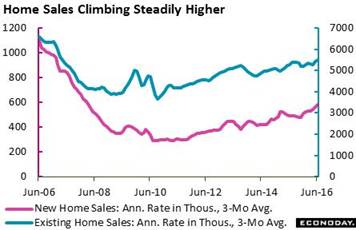 A negative in the GDP report is contraction in residential investment, down 6.1 percent in the second quarter but following a long series of outsized gains that include double-digit jumps. Residential investment tracks the new home market as well as home improvement and the outlook for both is positive. New home sales are bursting to their best strength of the cycle, rising 3.5 percent to a sharply higher than expected 592,000 annualized rate in June following a strong 572,000 rate in both May and April. To see the strength by comparison, the rate in June last year was 25 percent lower at 472,000. The gain in new home sales follows the prior week's strength in existing home sales which rose 1.1 percent in the June report to a 5.570 million rate. Strength for existing homes points to future strength for home improvement and a quick rebound for residential investment. The jobs market may be the consumer's strongest suit but housing, which enjoyed a very good spring selling season, is also a positive. A negative in the GDP report is contraction in residential investment, down 6.1 percent in the second quarter but following a long series of outsized gains that include double-digit jumps. Residential investment tracks the new home market as well as home improvement and the outlook for both is positive. New home sales are bursting to their best strength of the cycle, rising 3.5 percent to a sharply higher than expected 592,000 annualized rate in June following a strong 572,000 rate in both May and April. To see the strength by comparison, the rate in June last year was 25 percent lower at 472,000. The gain in new home sales follows the prior week's strength in existing home sales which rose 1.1 percent in the June report to a 5.570 million rate. Strength for existing homes points to future strength for home improvement and a quick rebound for residential investment. The jobs market may be the consumer's strongest suit but housing, which enjoyed a very good spring selling season, is also a positive.
Not a positive for anyone, however, is the trouble that is still holding down the factory sector. Durable goods orders proved very weak for a second straight month in June, down 4.0 percent and, like GDP, below Econoday's low estimate. Core data in the report are weak including for core capital goods (nondefense ex-aircraft) which did rise 0.2 percent but follow two straight prior declines of 0.5 and 0.9 percent. Weakness here is the same weakness apparent in nonresidential investment, in fact monthly shipments of core capital goods are an input into the GDP component. And total unfilled orders are also a very serious negative in the durable goods report, down 0.9 percent following no change in May and suggesting that factories have been keeping production up by working off backlogs which is a negative for future employment. Year-on-year rates reinforce the sense of weakness. Total orders were down 6.4 percent in June which outside of an aircraft-distorted 19 percent decline in July last year is the weakest in 4 years. Core capital goods orders were down a year-on-year 3.7 percent in June which, strikingly, is the 17th decline in 18 months -- confirmation of weakness in both domestic and global business investment. And advance factory reports for July, which include continued contraction in the Dallas and Kansas City districts, are no better than mixed and are not pointing to much of a rebound for July, if any rebound at all.
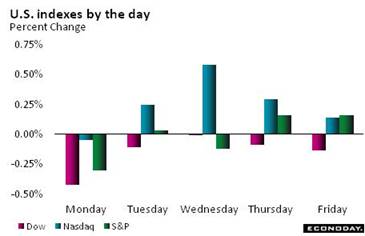 A negative that may express itself first in the factory sector (as if it needs another negative) is the U.K.'s pending separation from the European Union, one that threatens to diminish cross-border trade and investment. But Brexit isn't making much impression at the Fed, at least that's what it looks like since the FOMC didn't even bother to cite Brexit as a specific risk in its July statement. If concerns over Brexit begin to fade, an unwinding of the initial Brexit effect would prove a minus for the dollar (which would be a plus of course for exports) and also a minus for Treasuries where safe-haven buying has pulled interest rates to record lows. The dollar did in fact decline in the week, down 1.9 percent on the dollar index to bring year-to-date depreciation to a constructive 3.3 percent, but there's no sign that demand for Treasuries is easing. On the contrary, the 2-year yield fell 2 basis points in the week to 0.68 percent with the 10-year down 9 basis points to 1.48 percent, flattening the 2-to-10 year spread by a steep 7 basis points to 80 basis points. Until demand for safety eases, gains for the stock market will be limited. Stocks were mixed in the week with the Dow posting four fractional losses in a row but only a small loss for the week while the Nasdaq posted a solid gain. Oil was the biggest loser in the week, falling $3 to a 4-month low near $41.50 in a loss that does not point to rising economic expectations, at least global expectations. A negative that may express itself first in the factory sector (as if it needs another negative) is the U.K.'s pending separation from the European Union, one that threatens to diminish cross-border trade and investment. But Brexit isn't making much impression at the Fed, at least that's what it looks like since the FOMC didn't even bother to cite Brexit as a specific risk in its July statement. If concerns over Brexit begin to fade, an unwinding of the initial Brexit effect would prove a minus for the dollar (which would be a plus of course for exports) and also a minus for Treasuries where safe-haven buying has pulled interest rates to record lows. The dollar did in fact decline in the week, down 1.9 percent on the dollar index to bring year-to-date depreciation to a constructive 3.3 percent, but there's no sign that demand for Treasuries is easing. On the contrary, the 2-year yield fell 2 basis points in the week to 0.68 percent with the 10-year down 9 basis points to 1.48 percent, flattening the 2-to-10 year spread by a steep 7 basis points to 80 basis points. Until demand for safety eases, gains for the stock market will be limited. Stocks were mixed in the week with the Dow posting four fractional losses in a row but only a small loss for the week while the Nasdaq posted a solid gain. Oil was the biggest loser in the week, falling $3 to a 4-month low near $41.50 in a loss that does not point to rising economic expectations, at least global expectations.
| Markets at a Glance |
Year-End |
Week Ended |
Week Ended |
Year-To-Date |
Weekly |
|
2015 |
22-Jul-16 |
29-Jul-16 |
Change |
Change |
| DJIA |
17,425.03 |
18,570.85 |
18,432.24 |
5.8% |
-0.7% |
| S&P 500 |
2,043.94 |
2,175.03 |
2,173.60 |
6.3% |
-0.1% |
| Nasdaq Composite |
5,007.41 |
5,100.16 |
5,162.13 |
3.1% |
1.2% |
|
|
|
|
|
|
| Crude Oil, WTI ($/barrel) |
$37.40 |
$44.23 |
$41.46 |
10.9% |
-6.3% |
| Gold (COMEX) ($/ounce) |
$1,060.00 |
$1,330.70 |
$1,359.40 |
28.2% |
2.2% |
|
|
|
|
|
|
| Fed Funds Target |
0.25 to 0.50% |
0.25 to 0.50% |
0.25 to 0.50% |
0 bp |
0 bp |
| 2-Year Treasury Yield |
1.05% |
0.70% |
0.68% |
–37 bp |
–2 bp |
| 10-Year Treasury Yield |
2.27% |
1.57% |
1.48% |
–79 bp |
–9 bp |
| Dollar Index |
98.84 |
97.45 |
95.59 |
-3.3% |
-1.9% |
Animal spirits in the market may be limited and the factory sector may be iffy, but it's the consumer that is the backbone of the economy -- and the backbone of the consumer is the labor market. As long as employment remains strong, the consumer can be expected to support the economy, though not perhaps at the second quarter's simply torrid 4.2 percent pace.
July's employment report on Friday is expected to come in at a very respectable 185,000 for nonfarm payrolls, a result that would add to the run of solid economic data so far this summer but probably not enough to raise talk of a September FOMC rate hike. Starting the week on Monday will be the ISM manufacturing report where past strength in new orders hasn't, however, panned out to strength for the government's factory data. ISM's non-manufacturing report, which has in fact been accurately signaling general strength for the economy, follows at mid-morning Wednesday preceded by ADP whose employment calls have been on the mark this year.
ISM Manufacturing Index for July
Consensus Forecast: 53.2
Consensus Range: 52.0 to 54.0
The ISM manufacturing index is expected to hold steady at a moderate but constructive 53.2 in July, unchanged from June which was the best reading since February last year. New orders were an outstanding highlight of the June report, at 57.0 and pointing to strength in production and employment for ISM's July report.
Construction Spending for June
Consensus Forecast, Month-to-Month Change: +0.6%
Consensus Range: +0.2% to +2.2%
Construction spending is expected to bounce back in June, up a consensus 0.6 percent following steep declines in the two prior months of minus 0.8 percent and minus 2.0 percent. Construction spending on non-housing has been soft but spending on housing has been steadily climbing. Recent strength in housing starts is a positive indication for this report.
Total Vehicle Sales for July
Consensus Forecast, Annualized Rate: 17.3 million
Consensus Range: 16.9 to 17.8 million
Unit vehicle sales are expected to bounce higher in July, up 3.6 percent to a 17.3 million annualized rate following a surprisingly soft 16.7 million rate in June. Expected strength would boost expectations for the vehicle component of the monthly retail sales report, a component that proved flat in June. Vehicle sales were a central strength in the 2015 economy but, despite low rates and aggressive manufacturer incentives, have been soft so far this year.
Personal Income for June
Consensus Forecast, Month-to-Month Change: +0.3%
Consensus Range: +0.3% to +0.5%
Personal Spending
Consensus Forecast: +0.3%
Consensus Range: +0.2% to +0.5%
PCE Price Index
Consensus Forecast: +0.2%
Consensus Range: +0.2% to +0.3%
Core PCE Price Index
Consensus Forecast: +0.1%
Consensus Range: +0.1% to +0.3%
A rise in personal spending data for June would be no surprise given consumer spending strength in the just released second-quarter GDP report. Following outsized strength in April and modest strength in May, forecasters see spending rising 0.3 percent in June. Personal income is also expected to post a meaningful gain, also at 0.3 percent following a 0.2 percent gain in May. Meaningful gains, however, are not expected for the core PCE price index where the consensus is calling for only a 0.1 percent increase.
ADP, Private Payrolls for July
Consensus Forecast: 165,000
Consensus Range: 160,000 to 185,000
ADP employment has had many more hits than misses this year including June when the report called for a 173,000 rise in private payrolls, a call that looks small compared to the outsized 265,000 actual outcome but what was well over expectations at the time. ADP's estimate for July is expected to come in at 165,000 which would point to another positive month for the July employment report.
ISM Non-Manufacturing Index for July
Consensus Forecast: 56.0
Consensus Range: 55.5 to 57.0
The ISM non-manufacturing index has been signaling solid strength for the economy all year and another month of strength is expected for July where the consensus is calling for 56.0. New orders were very strong in June, at 59.9, which points to July strength for production and perhaps employment as well. The employment index for June was only 52.7 but it was up 3 full points in what did signal strength for what turned out to be an outstanding monthly employment report.
Initial Jobless Claims for July 30 week
Consensus Forecast: 265,000
Consensus Range: 262,000 to 270,000
Initial jobless claims were very low through most of July but did move higher in the July 23 week, up 14,000 to 264,000 with the Econoday consensus calling for 265,000 in the July 30 week. Seasonal layoffs tied to auto retooling have yet to take hold which points to the risk of elevated claims levels for the balance of the summer.
Factory Orders for June
Consensus Forecast, Month-to-Month Change: -1.8%
Consensus Range: -2.3% to -0.3%
Factory orders are expected to fall 1.8 percent in June as the advance release of a 4.0 percent decline in the durables component is expected to be offset by oil-related price strength for nondurables. Capital goods orders have been very weak underscoring caution in business expectations and further trouble for the nation's productivity.
Nonfarm Payrolls for June
Consensus Forecast: 185,000
Consensus Range: 150,000 to 215,000
Private Payrolls
Consensus Forecast: 175,000
Consensus Range: 145,000 to 210,000
Unemployment Rate
Consensus Forecast: 4.8%
Consensus Range: 4.8% to 4.9%
Average Hourly Earnings
Consensus Forecast: +0.3%
Consensus Range: +0.2% to +0.3%
Average Workweek
Consensus Forecast: 34.4 hours
Consensus Range: 34.4 to 34.5 hours
Nonfarm payrolls got back on track in June, surging 287,000 to eclipse May's 38,000 slump in a gain driven by temporary workers which points to permanent hiring ahead. Forecasters see growth in nonfarm payrolls easing back in July, to a consensus 185,000 in a result that would still be consistent with solid growth in the labor market. In other signs of strength, the unemployment rate is expected to dip 1 tenth to 4.8 percent with average hourly earnings picking up to 0.3 percent following June's very soft 0.1 percent gain.
International Trade Balance for June
Consensus Forecast: -$43.0 billion
Consensus Range: -$43.6 to -$42.1 billion
The nation's trade deficit is expected to widen in June, to a consensus $43.0 billion vs May's $41.1 billion. Advanced data on June goods trade showed an increase in exports but a larger increase for imports, a mix that points to a larger deficit though increases in both point to rising cross-border demand.
Consumer Credit for June
Consensus Forecast: +$15.5 billion
Consensus Range: +$14.0 to +$17.1 billion
Consumer credit is expected to rise $15.5 billion in June following May's sizable $18.6 billion gain. Growth in revolving credit, where credit-card debt is tracked and which had shown life earlier this year, was weak in both May and April. Non-revolving credit has been the strength of this report, underpinned by student loans but also reflecting strong demand for vehicle financing.
|
