|
The consumer put up some big spending numbers during the second quarter, perhaps to exhaustion. In a poor first leg for the third quarter, retail sales went nowhere in July. And the week's other news is also soft, and oddly so including yet another downturn for productivity. Not so odd and not so soft, however, is the economy's star performer -- nothing less than the labor market.
 After averaging 0.7 percent monthly gains through the second quarter, or exactly double the monthly average over the last two years, retail sales came in unchanged in July. This hit everyone as a surprise but perhaps shouldn't have been any surprise at all given the strength of second-quarter spending. The accompanying graph tracks monthly change over the past year and July's nothing result literally disappears, depicted here by the big zero that it is. But to be fair there are spots of strength in July's retail sales report led by a 1.1 percent monthly surge in auto sales which follows a very solid 0.5 percent gain in June. Yes, spending elsewhere may not be that great but strength for autos is a sign of consumer confidence and strength. And spending at nonstore retailers, specifically ecommerce, is definitely great, up a very sizable 1.3 percent for a second straight month and on top of even larger gains in prior months. After averaging 0.7 percent monthly gains through the second quarter, or exactly double the monthly average over the last two years, retail sales came in unchanged in July. This hit everyone as a surprise but perhaps shouldn't have been any surprise at all given the strength of second-quarter spending. The accompanying graph tracks monthly change over the past year and July's nothing result literally disappears, depicted here by the big zero that it is. But to be fair there are spots of strength in July's retail sales report led by a 1.1 percent monthly surge in auto sales which follows a very solid 0.5 percent gain in June. Yes, spending elsewhere may not be that great but strength for autos is a sign of consumer confidence and strength. And spending at nonstore retailers, specifically ecommerce, is definitely great, up a very sizable 1.3 percent for a second straight month and on top of even larger gains in prior months.
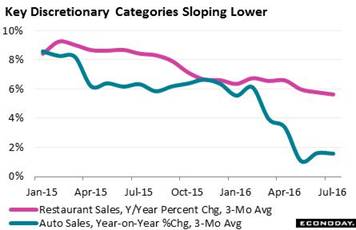 The year-on-year rate for nonstore retailers is outstanding, at 14.1 percent vs only 2.3 percent growth for total retail sales. And auto sales aren't helping the year-on-year rate, at only 2.4 percent and noticeably lagging their mid-single digit trend of last year. Restaurant sales, which like autos are a key discretionary category, were especially weak in July with the year-on-year rate coming down 9 tenths to 5.0 percent. The graph smooths out the year-on-year rates with a 3-month average. The long slopes for these readings are unmistakably down. All this makes for a very slow start to the third quarter, a quarter that was expected to show solid growth and perhaps still will. The year-on-year rate for nonstore retailers is outstanding, at 14.1 percent vs only 2.3 percent growth for total retail sales. And auto sales aren't helping the year-on-year rate, at only 2.4 percent and noticeably lagging their mid-single digit trend of last year. Restaurant sales, which like autos are a key discretionary category, were especially weak in July with the year-on-year rate coming down 9 tenths to 5.0 percent. The graph smooths out the year-on-year rates with a 3-month average. The long slopes for these readings are unmistakably down. All this makes for a very slow start to the third quarter, a quarter that was expected to show solid growth and perhaps still will.
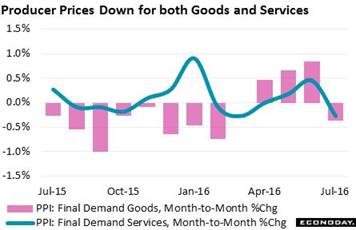 Inflation is also expected to show some traction in the third quarter, inching a tenth or two higher to just under 2 percent for core PCE prices. But that's only the expectation. The quarter's first signal on wholesale prices is surprisingly soft but following, like retail sales, gains in prior months. Producer prices fell 0.4 percent in July to pull the year-on-year rate into the negative column at minus 0.2 percent. When excluding food & energy, core prices fell 0.3 percent with the year-on-year rate sinking below 1 percent to only 0.7 percent. This is not the right direction for the Fed's 2 percent target. Of special concern in the report is a 0.3 percent decline for services which unfortunately hints at easing demand at the base of the economy. Goods prices are also down, 0.4 percent lower for the first decline since February. This report does not point to strength for the consumer price report which never did get much lift from the three months of updraft in wholesale prices. Inflation is also expected to show some traction in the third quarter, inching a tenth or two higher to just under 2 percent for core PCE prices. But that's only the expectation. The quarter's first signal on wholesale prices is surprisingly soft but following, like retail sales, gains in prior months. Producer prices fell 0.4 percent in July to pull the year-on-year rate into the negative column at minus 0.2 percent. When excluding food & energy, core prices fell 0.3 percent with the year-on-year rate sinking below 1 percent to only 0.7 percent. This is not the right direction for the Fed's 2 percent target. Of special concern in the report is a 0.3 percent decline for services which unfortunately hints at easing demand at the base of the economy. Goods prices are also down, 0.4 percent lower for the first decline since February. This report does not point to strength for the consumer price report which never did get much lift from the three months of updraft in wholesale prices.
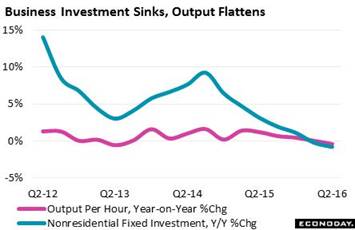 The bad news takes a serious turn now. Low productivity has been a persistent theme of this economic cycle and the news isn't getting better. Productivity fell at an annualized 0.5 percent rate in the second quarter for the third decline in a row which matches the longest negative streak ever for this series. And this series goes back a long ways, to the second quarter of 1947 to be exact. Output did pick up in the quarter, rising 5 tenths from the first quarter to an annualized 1.2 percent rate, but it took more hours to do the work, up 4 tenths to a 1.8 percent growth rate. And then there's compensation which moved from the negative column to a plus 1.5 percent rate and, when compared against output, makes for a 2.0 percent rise in unit labor costs. This is not a profit plus for businesses which, however, have only themselves to blame. Capital investment has been in decline the last two years, meaning workers are not getting the benefits of new equipment and facilities. Turning from annualized rates to year-on-year comparisons, productivity fell 0.4 percent in the second quarter for the first decline since second-quarter 2013. The graph compares year-on-year output against previously released data on nonresidential investment. The bad news takes a serious turn now. Low productivity has been a persistent theme of this economic cycle and the news isn't getting better. Productivity fell at an annualized 0.5 percent rate in the second quarter for the third decline in a row which matches the longest negative streak ever for this series. And this series goes back a long ways, to the second quarter of 1947 to be exact. Output did pick up in the quarter, rising 5 tenths from the first quarter to an annualized 1.2 percent rate, but it took more hours to do the work, up 4 tenths to a 1.8 percent growth rate. And then there's compensation which moved from the negative column to a plus 1.5 percent rate and, when compared against output, makes for a 2.0 percent rise in unit labor costs. This is not a profit plus for businesses which, however, have only themselves to blame. Capital investment has been in decline the last two years, meaning workers are not getting the benefits of new equipment and facilities. Turning from annualized rates to year-on-year comparisons, productivity fell 0.4 percent in the second quarter for the first decline since second-quarter 2013. The graph compares year-on-year output against previously released data on nonresidential investment.
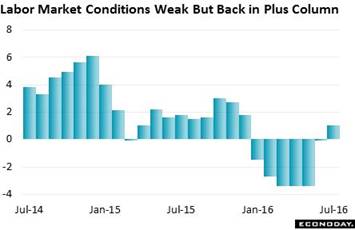 The good news is that most of the bad news is now over and we can turn to the nation's strength which is the labor market. But you would never know it from the labor market conditions index which isn't exactly on fire. Payrolls may have posted strong gains in both July and June but they barely register on this index which, at only plus 1.0 in July and a negative 0.1 in June, are completely flat. But it takes more than just payrolls to move this index, one the Fed bills as experimental in nature and downplayed in importance by Janet Yellen. The index is a broad composite of 19 separate indicators some of which are not household names, like a composite help-wanted index that the Fed calculates itself or two employment components from the small business optimism report. The 292,000 and 255,000 nonfarm payroll gains of the last two months, however substantial, simply get lost in the shuffle. This index has fallen from positive mid-single digit growth during 2013 and 2014 to the negative column through the first half of the year. And by comparison with that, July's plus 1.0 showing is relatively good. The good news is that most of the bad news is now over and we can turn to the nation's strength which is the labor market. But you would never know it from the labor market conditions index which isn't exactly on fire. Payrolls may have posted strong gains in both July and June but they barely register on this index which, at only plus 1.0 in July and a negative 0.1 in June, are completely flat. But it takes more than just payrolls to move this index, one the Fed bills as experimental in nature and downplayed in importance by Janet Yellen. The index is a broad composite of 19 separate indicators some of which are not household names, like a composite help-wanted index that the Fed calculates itself or two employment components from the small business optimism report. The 292,000 and 255,000 nonfarm payroll gains of the last two months, however substantial, simply get lost in the shuffle. This index has fallen from positive mid-single digit growth during 2013 and 2014 to the negative column through the first half of the year. And by comparison with that, July's plus 1.0 showing is relatively good.
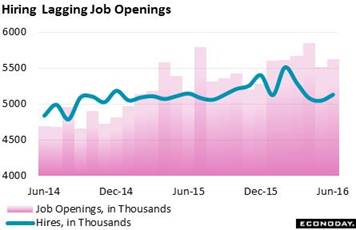 More than relatively good is the signal from the JOLTS report where job openings, in data for June, returned to form after a soft May, up 2.0 percent to a 5.624 million annualized rate. Openings peaked in April at 5.845 million, averaging 5.682 million over the first four months of the year. But the hires component of the report, at 5.131 million in June, has been lagging job openings since early last year. The discrepancy possibly suggests that employers are finding it harder to fill jobs, perhaps because of skill shortages. And gains for openings without gains in hiring could be an indication, especially for policy hawks, that the labor market is tightening and that a wage-pressure flashpoint could be approaching. By the way, JOLTS is a really good name for an indicator and stands for the Job Openings and Labor Turnover Survey. More than relatively good is the signal from the JOLTS report where job openings, in data for June, returned to form after a soft May, up 2.0 percent to a 5.624 million annualized rate. Openings peaked in April at 5.845 million, averaging 5.682 million over the first four months of the year. But the hires component of the report, at 5.131 million in June, has been lagging job openings since early last year. The discrepancy possibly suggests that employers are finding it harder to fill jobs, perhaps because of skill shortages. And gains for openings without gains in hiring could be an indication, especially for policy hawks, that the labor market is tightening and that a wage-pressure flashpoint could be approaching. By the way, JOLTS is a really good name for an indicator and stands for the Job Openings and Labor Turnover Survey.
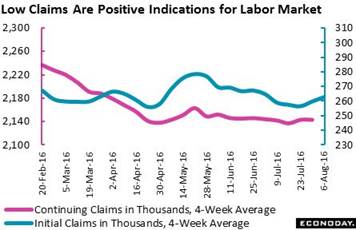 But the week's best news of all comes once again from the jobless claims report where readings are steady at historic lows. Initial claims edged 1,000 lower in the August 6 week to 266,000 with the 4-week average up 3,500 to a 262,750 level that shows only a small rise over the last several weeks. Continuing claims rose 14,000 to 2.155 million in lagging data for the July 30 week. This 4-week average is unchanged at 2.143 million and is virtually unchanged against recent comparisons. The unemployment rate for insured workers is unchanged at a near record low of 1.6 percent. This report, by far the most timely of any labor market indicator, is offering the first hint of strength for the August employment report. But the week's best news of all comes once again from the jobless claims report where readings are steady at historic lows. Initial claims edged 1,000 lower in the August 6 week to 266,000 with the 4-week average up 3,500 to a 262,750 level that shows only a small rise over the last several weeks. Continuing claims rose 14,000 to 2.155 million in lagging data for the July 30 week. This 4-week average is unchanged at 2.143 million and is virtually unchanged against recent comparisons. The unemployment rate for insured workers is unchanged at a near record low of 1.6 percent. This report, by far the most timely of any labor market indicator, is offering the first hint of strength for the August employment report.
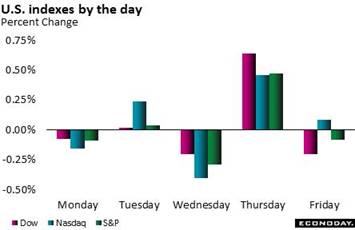 Thursday was the week's best day for the stock market with all three main indexes -- the Dow, the S&P, and the Nasdaq -- all posting record closing highs at the time for the first time since the irrational exuberance days of 1999. This invites of course introspection whether this record will prove a top for the market and whether it will take another 17 years to match. Right now global growth may be slow and U.S. productivity weak but the consumer is employed and, except for July at least, has been spending. There's also very little volatility in the market right now which is another plus not pointing to a foreseeable tailspin. But there are risks. The effects of the presidential election, if any, have yet to play out as do the effects, if any, from Brexit. But right now, year-to-date gains for the indexes are very solid, all in the mid-single digits. Thursday was the week's best day for the stock market with all three main indexes -- the Dow, the S&P, and the Nasdaq -- all posting record closing highs at the time for the first time since the irrational exuberance days of 1999. This invites of course introspection whether this record will prove a top for the market and whether it will take another 17 years to match. Right now global growth may be slow and U.S. productivity weak but the consumer is employed and, except for July at least, has been spending. There's also very little volatility in the market right now which is another plus not pointing to a foreseeable tailspin. But there are risks. The effects of the presidential election, if any, have yet to play out as do the effects, if any, from Brexit. But right now, year-to-date gains for the indexes are very solid, all in the mid-single digits.
| Markets at a Glance |
Year-End |
Week Ended |
Week Ended |
Year-To-Date |
Weekly |
|
2015 |
5-Aug-16 |
12-Aug-16 |
Change |
Change |
| DJIA |
17,425.03 |
18,543.53 |
18,576.47 |
6.6% |
0.2% |
| S&P 500 |
2,043.94 |
2,182.87 |
2,184.05 |
6.9% |
0.1% |
| Nasdaq Composite |
5,007.41 |
5,221.12 |
5,232.89 |
4.5% |
0.2% |
|
|
|
|
|
|
| Crude Oil, WTI ($/barrel) |
$37.40 |
$41.96 |
$44.67 |
19.4% |
6.5% |
| Gold (COMEX) ($/ounce) |
$1,060.00 |
$1,343.20 |
$1,340.20 |
26.4% |
-0.2% |
|
|
|
|
|
|
| Fed Funds Target |
0.25 to 0.50% |
0.25 to 0.50% |
0.25 to 0.50% |
0 bp |
0 bp |
| 2-Year Treasury Yield |
1.05% |
0.73% |
0.71% |
–34 bp |
–2 bp |
| 10-Year Treasury Yield |
2.27% |
1.59% |
1.51% |
–76 bp |
–8 bp |
| Dollar Index |
98.84 |
96.17 |
95.74 |
-3.1% |
-0.4% |
Though the week's economic news was decidedly downbeat, the strength of the labor market points to a quick bounce back for consumer spending. Yet the news does mark a shift in tone for economic data and isn't likely to build up any momentum for a September FOMC rate hike.
Two early indications on August lead the week off on Monday with the Empire State manufacturing index and the housing market index, neither of which however are expected to show much strength. But industrial production on Tuesday is expected to show some strength, at least at the headline level though expectations for the manufacturing component are modest. Also out on Tuesday are housing starts and permits which are expected to extend their long trend of uneven gains, and also July consumer prices which will follow the surprising weakness in July producer prices. FOMC minutes from July's not-so-dovish meeting will be Wednesday's main news with details on the labor market assessment of special interest. Thursday's data on initial jobless claims will track the sample week of the monthly employment report and will offer early indications on what to expect for August payrolls. Thursday's index of leading economic indicators and the Philadelphia Fed manufacturing index will wind up the week and both are expected to come in soft.
Empire State Index for August
Consensus Forecast: +2.50
Consensus Range: -1.60 to +5.60
The Empire State index has been flat all year and nothing better is expected for August where the consensus is barely above zero, at 2.50. New orders have been showing sporadic life but were flat in July which is a negative signal for August. Employment and the workweek have been weak.
Housing Market Index for August
Consensus Forecast: 60
Consensus Range: 58 to 61
The housing market index inched 1 point lower in July to 59 after rising 2 points in June to the year's best of 60. Before that it was four months in a row at 58 which is where forecasters see the index returning in August. Weakness in the report has not been in sales but in traffic which continues to be held down by light interest from first-time buyers.
Consumer Price Index for July
Consensus Forecast, Month-to-Month Change: 0.0%
Consensus Range: 0.0% to +0.1%
CPI Core, Less Food & Energy
Consensus Forecast: +0.2%
Consensus Range: +0.1% to +0.3%
Consumer prices are not expected to show any strength at all in July with the consensus at no change in what would be the weakest result in more than 3 years. But much of this weakness is tied to gasoline prices which have been coming down after spiking at mid-year. Excluding food & energy, the core rate is expected to rise a constructive 0.2 percent. Strength in service prices was a highlight of June's report but were a major weakness in July's producer price report.
Housing Starts for July
Consensus Forecast, Adjusted Annualized Rate: 1.180 million
Consensus Range: 1.150 to 1.190 million
Housing Permits
Consensus Forecast: 1.160 million
Consensus Range: 1.140 to 1.185 million
A sizable decline is expected for housing starts in July to a 1.180 million annualized rate offset however by expectations for a sizable rise in housing permits to a 1.160 million rate. Starts and permits have been edging higher at a slow but steady rate this year in what is a positive for construction and overall economic growth.
Industrial Production for July
Consensus Forecast, Month-to-Month Change: +0.3%
Consensus Range: +0.1% to +0.8%
Manufacturing Production
Consensus Forecast: +0.2%
Consensus Range: +0.1% to +0.4%
Capacity Utilization Rate
Consensus Forecast: 75.5%
Consensus Range: 75.4% to 75.8%
Industrial production is expected to rise 0.3 percent in August and add to July's utility-inflated rise of 0.6 percent. Manufacturing is expected to show less strength, up only 0.2 percent but following a very solid 0.4 percent rise in June. Vehicle production has been making for recent swings in the manufacturing reading and may again during the retooling of July. Capacity utilization is expected to rise 1 tenth to 75.5 percent.
Initial Jobless Claims for August 13 week
Consensus Forecast: 265,000
Consensus Range: 264,000 to 270,000
Initial jobless claims are expected to hold steady, at a consensus 265,000 in the August 13 week which was the sample week of the August employment report. A comparison with the July sample week at 257,500 points to only a small rise at a still very low level consistent with health in the labor market.
Philadelphia Fed Manufacturing Index for August
Consensus Forecast: +2.0
Consensus Range: -5.0 to +5.5
The Philadelphia Fed index isn't expected to show much strength, at a consensus of only plus 2.0 for August. Yet order readings surged in the July report and do point to strength for August shipments and perhaps for employment as well.
Index of Leading Economic Indicators for July
Consensus Forecast, Month-to-Month Change: +0.2%
Consensus Range: +0.1% to +0.4%
The index of leading indicators is expected to rise a moderate 0.2 percent in July following a 0.3 percent gain in August. Jobless claims fell in July while stock prices went up and the factory workweek lengthened. Consumer expectations are likely to be a negative. This report has been mixed this year and has been offering no better than soft signals on the economic outlook.
|
