|
We should never allow ourselves to talk in circles, but let's do it anyway. As long as the jobs market is solid, consumer spending should stay solid. And as long as consumer spending stays solid, the jobs market should be solid. Simple enough? And payroll growth in August proved to be, yes, perfectly solid.
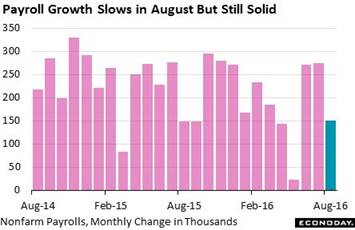 Solid or not, Federal Reserve officials aren't really going to be on the hook for a rate hike at this month's policy meeting. It's not because most job readings aren't positive but because they have slowed. Nonfarm payrolls rose 151,000 in August following big gains of 271,000 and 275,000 in June and July. August's 151,000 showing is perfectly respectable and is enough to absorb newcomers into the labor market. And the 3-month average, at 232,000, is noticeably above this recovery's roughly 200,000 average. But there are signs of weakness in the report including ongoing declines for mining, manufacturing and even construction. The workweek is also soft, slipping 1 tenth to 34.3 hours in a reading that doesn't point to any immediate risk of economic overheating. Solid or not, Federal Reserve officials aren't really going to be on the hook for a rate hike at this month's policy meeting. It's not because most job readings aren't positive but because they have slowed. Nonfarm payrolls rose 151,000 in August following big gains of 271,000 and 275,000 in June and July. August's 151,000 showing is perfectly respectable and is enough to absorb newcomers into the labor market. And the 3-month average, at 232,000, is noticeably above this recovery's roughly 200,000 average. But there are signs of weakness in the report including ongoing declines for mining, manufacturing and even construction. The workweek is also soft, slipping 1 tenth to 34.3 hours in a reading that doesn't point to any immediate risk of economic overheating.
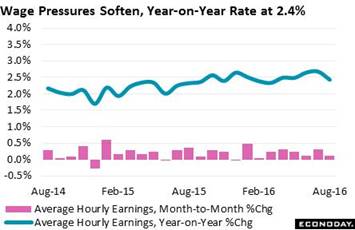 Earnings are also soft in the report, up only 0.1 percent in the month for a year-on-year rate of 2.4 percent which is down a striking 3 tenths from July. Policy makers, in their ongoing effort to boost overall inflation, want to see this rate move above 3 percent and toward 4 percent. But right now the curve is going in the wrong direction. This reading hit a 3.5 percent peak at the end of the last cycle but has been struggling to hold the 2.5 percent line in this cycle. Lack of wage pressure together with moderating payroll growth make for no urgency to hike rates. Earnings are also soft in the report, up only 0.1 percent in the month for a year-on-year rate of 2.4 percent which is down a striking 3 tenths from July. Policy makers, in their ongoing effort to boost overall inflation, want to see this rate move above 3 percent and toward 4 percent. But right now the curve is going in the wrong direction. This reading hit a 3.5 percent peak at the end of the last cycle but has been struggling to hold the 2.5 percent line in this cycle. Lack of wage pressure together with moderating payroll growth make for no urgency to hike rates.
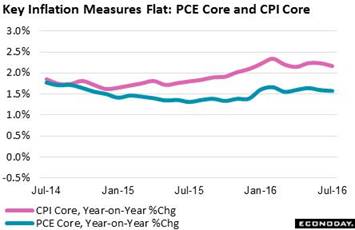 Other inflation readings are also flat including the Fed's central target, the PCE core (ex-food and ex-energy). This index for August, released earlier in the week, rose only 0.1 percent with the year-on-year stuck at 1.6 percent. This reading will definitely need to show more lift to get any fighting spirit out of the policy hawks. The accompanying graph also tracks the CPI core which, due to methodological differences, often runs about 1/2 percentage point higher than the PCE core. Medical costs are going up as are housing costs but that's about it. Transportation costs are coming down with most goods prices, including for food and apparel, dead flat. Other inflation readings are also flat including the Fed's central target, the PCE core (ex-food and ex-energy). This index for August, released earlier in the week, rose only 0.1 percent with the year-on-year stuck at 1.6 percent. This reading will definitely need to show more lift to get any fighting spirit out of the policy hawks. The accompanying graph also tracks the CPI core which, due to methodological differences, often runs about 1/2 percentage point higher than the PCE core. Medical costs are going up as are housing costs but that's about it. Transportation costs are coming down with most goods prices, including for food and apparel, dead flat.
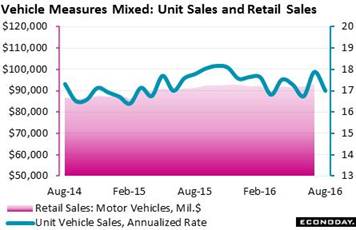 Upstaged in the week's data, and another factor not pointing to a rate hike, is unit vehicle sales which fell sharply, to a 17.0 million rate in August from July's very strong 17.9 million. The 17.0 million rate isn't that bad at all, however, and is actually very good. But it's not the level that counts, rather the comparison with July is what matters most and the August result points to weakness for motor vehicles in the retail sales report, a component that makes up about 1/5 of total sales. But unit sales and retail sales, as can be seen in the graph, don't always move together to say the least. Unit sales, which are reported by manufacturers, are measured, as you might guess, in units, not dollars as are retail sales. More importantly, unit sales include an unknown portion of cars and light trucks sold to businesses, not consumers which is what retail sales track. So there's still a chance that motor vehicles won't be the big dud that holds the August retail sales report back. Upstaged in the week's data, and another factor not pointing to a rate hike, is unit vehicle sales which fell sharply, to a 17.0 million rate in August from July's very strong 17.9 million. The 17.0 million rate isn't that bad at all, however, and is actually very good. But it's not the level that counts, rather the comparison with July is what matters most and the August result points to weakness for motor vehicles in the retail sales report, a component that makes up about 1/5 of total sales. But unit sales and retail sales, as can be seen in the graph, don't always move together to say the least. Unit sales, which are reported by manufacturers, are measured, as you might guess, in units, not dollars as are retail sales. More importantly, unit sales include an unknown portion of cars and light trucks sold to businesses, not consumers which is what retail sales track. So there's still a chance that motor vehicles won't be the big dud that holds the August retail sales report back.
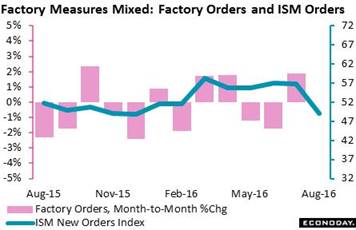 Another dud during the week was the ISM manufacturing index which fell into contraction, though only slight contraction, for the first time since February, coming in at a sub-50 level of 49.4 for a several point dip from July. This is a composite index that, in an abstraction, combines different factors when assessing the factory sector, including for instance employment and production. But it's new orders that matter most for not only businesses but the economic outlook as well. And here the story is a little more dramatic with the index plunging nearly 8 points to 49.1 for the first sub-50 score since December. The graph tracks ISM new orders against actual factory orders which are reported with an understandable delay as the ISM sample is very small by comparison. Small or not, the ISM has been doing pretty well with its orders reading, accurately predicting what were a majority of monthly declines for factory orders through the second half of last year. ISM orders then picked up in March as did factory orders. So the August decline is pretty ominous as — by the way — are factory hours in the employment report. They fell which points to contraction for August's factory production. Note that the horizontal axis of the graph is lined up between zero on the factory order side with 52, not 50, on the ISM side. This is the level that the Bureau of Economic Analysis says actually corresponds, in the case of new orders at least, with no monthly change. Another dud during the week was the ISM manufacturing index which fell into contraction, though only slight contraction, for the first time since February, coming in at a sub-50 level of 49.4 for a several point dip from July. This is a composite index that, in an abstraction, combines different factors when assessing the factory sector, including for instance employment and production. But it's new orders that matter most for not only businesses but the economic outlook as well. And here the story is a little more dramatic with the index plunging nearly 8 points to 49.1 for the first sub-50 score since December. The graph tracks ISM new orders against actual factory orders which are reported with an understandable delay as the ISM sample is very small by comparison. Small or not, the ISM has been doing pretty well with its orders reading, accurately predicting what were a majority of monthly declines for factory orders through the second half of last year. ISM orders then picked up in March as did factory orders. So the August decline is pretty ominous as — by the way — are factory hours in the employment report. They fell which points to contraction for August's factory production. Note that the horizontal axis of the graph is lined up between zero on the factory order side with 52, not 50, on the ISM side. This is the level that the Bureau of Economic Analysis says actually corresponds, in the case of new orders at least, with no monthly change.
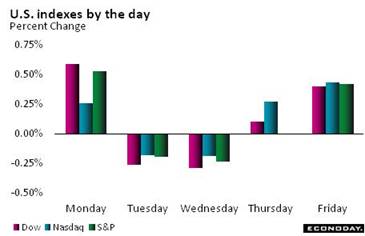 In contrast to last August's Chinese shipwreck, markets this summer proved very steady. But winds and currents can of course shift without warning, especially during the change of seasons. The stock market ends the summer at record highs at a time when profit growth, however, is slowing, which really isn't a mix that points to any big-time surge ahead. And how much more money can flow into the bond market when yields are already near record lows? Markets mostly marked time during week with the Dow ending 0.5 percent higher at 18,491 and with the bulk of the gain coming after Friday's employment report. In contrast to last August's Chinese shipwreck, markets this summer proved very steady. But winds and currents can of course shift without warning, especially during the change of seasons. The stock market ends the summer at record highs at a time when profit growth, however, is slowing, which really isn't a mix that points to any big-time surge ahead. And how much more money can flow into the bond market when yields are already near record lows? Markets mostly marked time during week with the Dow ending 0.5 percent higher at 18,491 and with the bulk of the gain coming after Friday's employment report.
| Markets at a Glance |
Year-End |
Week Ended |
Week Ended |
Year-To-Date |
Weekly |
|
2015 |
26-Aug-16 |
2-Sep-16 |
Change |
Change |
| DJIA |
17,425.03 |
18,395.40 |
18,491.96 |
6.1% |
0.5% |
| S&P 500 |
2,043.94 |
2,169.04 |
2,179.98 |
6.7% |
0.5% |
| Nasdaq Composite |
5,007.41 |
5,218.92 |
5,249.90 |
4.8% |
0.6% |
|
|
|
|
|
|
| Crude Oil, WTI ($/barrel) |
$37.40 |
$47.31 |
$44.30 |
18.4% |
-6.4% |
| Gold (COMEX) ($/ounce) |
$1,060.00 |
$1,324.30 |
$1,326.90 |
25.2% |
0.2% |
|
|
|
|
|
|
| Fed Funds Target |
0.25 to 0.50% |
0.25 to 0.50% |
0.25 to 0.50% |
0 bp |
0 bp |
| 2-Year Treasury Yield |
1.05% |
0.85% |
0.79% |
–26 bp |
–6 bp |
| 10-Year Treasury Yield |
2.27% |
1.63% |
1.60% |
–67 bp |
–3 bp |
| Dollar Index |
98.84 |
95.46 |
95.84 |
-3.0% |
0.4% |
Tailwinds and headwinds and sea changes are popular metaphors in economics, so let's use one of our own: The sailing is steady and fine and policy makers aren't going to want to rock the boat any. The FOMC will meet on September 20 and 21 with a Janet Yellen press conference and FOMC economic forecasts part of the festivities.
A light and shortened week for the calendar begins on Tuesday with two private reports that track the bulk of the economy. Markit's services PMI is expected to hold steady at a very soft 51.2 while the ISM's non-manufacturing report, where rates of growth have been much stronger, is expected to come in at 55.0 for the headline index. Jobless claims will take Thursday's focus and further strength is expected with forecasters seeing virtually no change. Consumer credit will also be posted on Thursday with special focus to be on revolving credit which, in a sign of consumer demand, jumped sharply in the prior report.
Services PMI for August Final
Consensus Forecast: 51.2
Consensus Range: 50.9 to 55.5
The services PMI has been running flat near the breakeven 50 level and pointing to only marginal growth for the bulk of the nation's economy. The flash index for August came in at 50.9 and forecasters see only slight improvement for the month's final reading, at a consensus 51.2. Growth in new orders has been soft as has employment. This report, at least yet, has not been pointing to the big third-quarter rebound that is widely expected.
ISM Non-Manufacturing Index for August
Consensus Forecast: 55.0
Consensus Range: 54.0 to 56.1
The ISM non-manufacturing index has been signaling solid strength for the economy all year and another month of strength is expected for August where the consensus is calling for 55.0, in what would be little changed from July's 55.5. New orders have been very strong in this report, at 60.3 in July for the best showing since October last year and which points to August strength for the sample's production and employment as well.
Initial Jobless Claims for September 3 week
Consensus Forecast: 264,000
Consensus Range: 261,000 to 270,000
Initial jobless claims are expected to hold steady in the September 3 week, at a consensus 264,000 vs 263,000 in the prior week and in line with the 4-week average which is also at 263,000. Readings throughout this report have been consistently low and pointing to low levels of layoffs and healthy conditions in the labor market.
Consumer Credit for July
Consensus Forecast: +$15.6 billion
Consensus Range: +$11.0 to +$16.1 billion
Consumer credit is expected to rise $15.6 billion in July following June's $12.3 billion gain which is soft for this reading. Gains for revolving credit (credit cards) have been limited in this report but not in June when the component rose an outsized $7.7 billion. Non-revolving credit has been the consistent strength of this report, underpinned by student loans but also reflecting solid demand for vehicle financing.
|
