|
Updates on the consumer sector are not pointing to any upside breakout for the economy, though there are spots of strength. And there are solid signs of strength in at least part of the housing sector as well as hints of improvement for the factory sector too. Lurking behind everything in the week's data is a long awaited uptick for inflation.
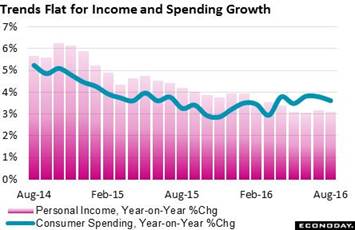 August was a soft month for the consumer, both for income and especially for spending. Income rose only 0.2 percent in the month as wages & salaries, which had been on a 4-month surge, could inch only 1 tenth higher in August. What strength there was in income, at least for landlords, came from rental income which jumped sharply in the month. Consumer spending, which had also been on a 4-month winning streak, came in unchanged as durable goods declined, largely reflecting monthly weakness in vehicle sales, as did non-durable goods, in part reflecting low fuel prices. Service spending, at plus 0.3 percent, did advance but at a slower rate than prior months. Year-on-year rates, as tracked in the accompanying graph, confirm the softness. Spending has been coming down from the 4 percent line while income has been barely holding at 3 percent. Despite the weakness in income, the consumer has been putting money into savings which are at a 5.7 percent rate for a 1 tenth gain. The gain for savings may be a negative for current spending but is a likely positive for future spending. August was a soft month for the consumer, both for income and especially for spending. Income rose only 0.2 percent in the month as wages & salaries, which had been on a 4-month surge, could inch only 1 tenth higher in August. What strength there was in income, at least for landlords, came from rental income which jumped sharply in the month. Consumer spending, which had also been on a 4-month winning streak, came in unchanged as durable goods declined, largely reflecting monthly weakness in vehicle sales, as did non-durable goods, in part reflecting low fuel prices. Service spending, at plus 0.3 percent, did advance but at a slower rate than prior months. Year-on-year rates, as tracked in the accompanying graph, confirm the softness. Spending has been coming down from the 4 percent line while income has been barely holding at 3 percent. Despite the weakness in income, the consumer has been putting money into savings which are at a 5.7 percent rate for a 1 tenth gain. The gain for savings may be a negative for current spending but is a likely positive for future spending.
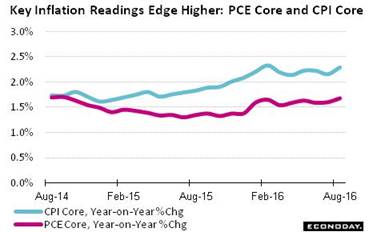 Unlike spending and income, inflation data are showing increasing life. The PCE price index rose 0.1 percent in August with the core up 0.2 percent, both 1 tenth better than the prior month. Year-on-year, the overall measure rose 2 tenths to 1.0 percent with the core, as seen in the graph, up 1 tenth to 1.7 percent and inching toward the Fed's 2 percent goal. The graph also includes the previously released CPI core which, due to a different methodology, is tracking about 1/2 percentage point above the PCE core. But importantly, both are going in the right direction as far as Federal Reserve policy makers are concerned. Unlike spending and income, inflation data are showing increasing life. The PCE price index rose 0.1 percent in August with the core up 0.2 percent, both 1 tenth better than the prior month. Year-on-year, the overall measure rose 2 tenths to 1.0 percent with the core, as seen in the graph, up 1 tenth to 1.7 percent and inching toward the Fed's 2 percent goal. The graph also includes the previously released CPI core which, due to a different methodology, is tracking about 1/2 percentage point above the PCE core. But importantly, both are going in the right direction as far as Federal Reserve policy makers are concerned.
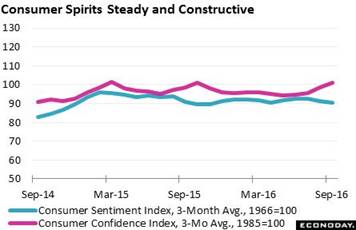 Also going in the right direction are consumer inflation expectations in the Conference Board's consumer confidence report. The 12-month inflation outlook is up 2 tenths to 5.0 percent for the best reading of the year. And consumer confidence itself is on the upswing, hinting perhaps at an upturn ahead for consumer spending. The September index rose more than 3 points to 104.1 to a new cycle high, eclipsing 103.8 back in January 2015. And the assessment of September's labor market is upbeat with more consumers saying jobs are plentiful and with fewer, in a closely watched reading, saying they're hard to get, the latter down 1.2 percentage points to 21.6 percent. But consumer readings can be bumpy from period to period and are smoothed out with 3-month averages in the accompanying graph which also includes the University of Michigan's consumer sentiment reading, a bi-monthly index that has not been showing the same strength in recent months as the Conference Board's measure. Still, the consumer sentiment index did show traction through the latter half of September, rising 1.4 points from mid-month to a final September reading of 91.2. The gain relative to mid-month implies a 92 to 93 pace for the last two weeks which would be the strongest since June and one that ultimately reflects long-term confidence in the labor market, specifically among higher income households. Also going in the right direction are consumer inflation expectations in the Conference Board's consumer confidence report. The 12-month inflation outlook is up 2 tenths to 5.0 percent for the best reading of the year. And consumer confidence itself is on the upswing, hinting perhaps at an upturn ahead for consumer spending. The September index rose more than 3 points to 104.1 to a new cycle high, eclipsing 103.8 back in January 2015. And the assessment of September's labor market is upbeat with more consumers saying jobs are plentiful and with fewer, in a closely watched reading, saying they're hard to get, the latter down 1.2 percentage points to 21.6 percent. But consumer readings can be bumpy from period to period and are smoothed out with 3-month averages in the accompanying graph which also includes the University of Michigan's consumer sentiment reading, a bi-monthly index that has not been showing the same strength in recent months as the Conference Board's measure. Still, the consumer sentiment index did show traction through the latter half of September, rising 1.4 points from mid-month to a final September reading of 91.2. The gain relative to mid-month implies a 92 to 93 pace for the last two weeks which would be the strongest since June and one that ultimately reflects long-term confidence in the labor market, specifically among higher income households.
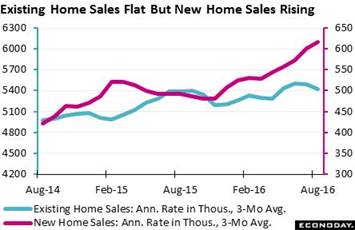 And a hint of the separation between higher and lower income households is possibly at play between the new home and resale markets. The surprise in the week came from new home sales which, though falling back in the latest data for August, are showing substantial strength. The August rate for this always volatile series fell back 7.6 percent to what however is still a top-shelf annualized pace of 609,000. And a major plus in the report is a surprise 5,000 upward revision (not downward revision) to July which now stands at a cycle high of 659,000. When smoothing out this series with 3-month averages, the dip in August turns into a gain as seen in the accompanying graph which also tracks the ever-lagging resale sector. The outlook for the latter is in further question following what was a very poor pending home sales report that points to outright weakness in the coming months. The pending index, which tracks contract signings, fell a very steep 2.4 percent in August with 3 of 4 regions positing monthly declines. Despite very low mortgage rates and strength in the labor market, the resale market has been flat in contrast to prices which are up about 5 percent year-on-year at what may be, particularly for lower income households, an out-of-reach median of $240,000. New home appreciation, by comparison, is actually down 5 percent with this median now at $284,000. And a hint of the separation between higher and lower income households is possibly at play between the new home and resale markets. The surprise in the week came from new home sales which, though falling back in the latest data for August, are showing substantial strength. The August rate for this always volatile series fell back 7.6 percent to what however is still a top-shelf annualized pace of 609,000. And a major plus in the report is a surprise 5,000 upward revision (not downward revision) to July which now stands at a cycle high of 659,000. When smoothing out this series with 3-month averages, the dip in August turns into a gain as seen in the accompanying graph which also tracks the ever-lagging resale sector. The outlook for the latter is in further question following what was a very poor pending home sales report that points to outright weakness in the coming months. The pending index, which tracks contract signings, fell a very steep 2.4 percent in August with 3 of 4 regions positing monthly declines. Despite very low mortgage rates and strength in the labor market, the resale market has been flat in contrast to prices which are up about 5 percent year-on-year at what may be, particularly for lower income households, an out-of-reach median of $240,000. New home appreciation, by comparison, is actually down 5 percent with this median now at $284,000.
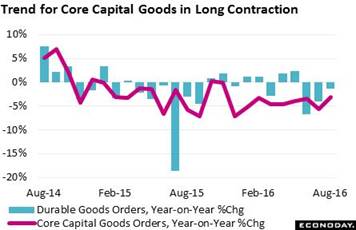 There were also key factory data out in the week led by a no-change reading for durable goods orders, a headline that speaks to the factory sector's very flat performance this year. Readings on core capital goods (nondefense excluding aircraft) are mixed with orders up 0.6 percent, which points to shipment strength ahead. But current shipments were down 0.4 percent to extend a long string of declines going back to May. Weakness in capital goods shipments is a negative for business investment in the GDP report. Year-on-year, capital goods orders, as seen in the graph, have been trending all year in the minus 5 percent range, a bit lower than total orders which have been back and forth around zero. Flatness in the factory sector reflects stubborn weakness in global demand and specifically in business investment. There were also key factory data out in the week led by a no-change reading for durable goods orders, a headline that speaks to the factory sector's very flat performance this year. Readings on core capital goods (nondefense excluding aircraft) are mixed with orders up 0.6 percent, which points to shipment strength ahead. But current shipments were down 0.4 percent to extend a long string of declines going back to May. Weakness in capital goods shipments is a negative for business investment in the GDP report. Year-on-year, capital goods orders, as seen in the graph, have been trending all year in the minus 5 percent range, a bit lower than total orders which have been back and forth around zero. Flatness in the factory sector reflects stubborn weakness in global demand and specifically in business investment.
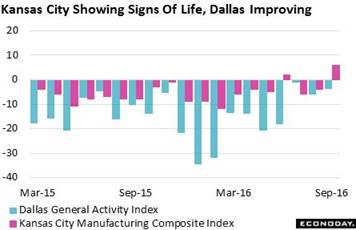 And one factor that has been holding back business investment, specifically in the energy sector, has been two years of low oil prices. This effect is seen in the regional reports from Kansas City and Dallas. But here there may be improvement appearing. The Kansas City manufacturing index, as tracked in the red columns of the graph, broke back above zero this month to plus 6 for the second positive reading this year and the best since December 2014. And the gain is being driven where it must be, in new orders which swung out of the negative column all the way to plus 12. The Dallas general activity index, tracked in the blue columns, is still in the negative column this month at minus 3.7 though the report's reading on overall business expectations is improving. These reports speak to the easing effects, as pointed to all year by the FOMC, of the prior collapse in oil prices. And one factor that has been holding back business investment, specifically in the energy sector, has been two years of low oil prices. This effect is seen in the regional reports from Kansas City and Dallas. But here there may be improvement appearing. The Kansas City manufacturing index, as tracked in the red columns of the graph, broke back above zero this month to plus 6 for the second positive reading this year and the best since December 2014. And the gain is being driven where it must be, in new orders which swung out of the negative column all the way to plus 12. The Dallas general activity index, tracked in the blue columns, is still in the negative column this month at minus 3.7 though the report's reading on overall business expectations is improving. These reports speak to the easing effects, as pointed to all year by the FOMC, of the prior collapse in oil prices.
 Markets, except for oil, were little changed in the week pending the September employment report. Exceptional strength in this report could raise chatter of a pre-election rate hike at the November FOMC. Yet expectations are not calling for any surprise with the Econoday consensus at 168,000 and the high forecast at 200,000. It would probably take something on the order of June and July gains, which were both over 270,000, to trigger any serious rate-hike talk. Oil was the big gainer on the week, up more than 7 percent following a rare agreement among OPEC producers to cut back production. A 4th straight draw in weekly U.S. oil inventories is also a positive for oil prices, not to mention a positive for the Kansas City and Dallas manufacturing surveys as well. Markets, except for oil, were little changed in the week pending the September employment report. Exceptional strength in this report could raise chatter of a pre-election rate hike at the November FOMC. Yet expectations are not calling for any surprise with the Econoday consensus at 168,000 and the high forecast at 200,000. It would probably take something on the order of June and July gains, which were both over 270,000, to trigger any serious rate-hike talk. Oil was the big gainer on the week, up more than 7 percent following a rare agreement among OPEC producers to cut back production. A 4th straight draw in weekly U.S. oil inventories is also a positive for oil prices, not to mention a positive for the Kansas City and Dallas manufacturing surveys as well.
| Markets at a Glance |
Year-End |
Week Ended |
Week Ended |
Year-To-Date |
Weekly |
|
2015 |
23-Sep-16 |
30-Sep-16 |
Change |
Change |
| DJIA |
17,425.03 |
18,261.45 |
18,308.15 |
5.1% |
0.3% |
| S&P 500 |
2,043.94 |
2,164.69 |
2,168.27 |
6.1% |
0.2% |
| Nasdaq Composite |
5,007.41 |
5,305.75 |
5,312.00 |
6.1% |
0.1% |
|
|
|
|
|
|
| Crude Oil, WTI ($/barrel) |
$37.40 |
$44.70 |
$47.96 |
28.2% |
7.3% |
| Gold (COMEX) ($/ounce) |
$1,060.00 |
$1,341.50 |
$1,320.60 |
24.6% |
-1.6% |
|
|
|
|
|
|
| Fed Funds Target |
0.25 to 0.50% |
0.25 to 0.50% |
0.25 to 0.50% |
0 bp |
0 bp |
| 2-Year Treasury Yield |
1.05% |
0.76% |
0.77% |
–28 bp |
1 bp |
| 10-Year Treasury Yield |
2.27% |
1.62% |
1.60% |
–67 bp |
–2 bp |
| Dollar Index |
98.84 |
95.46 |
95.5 |
-3.4% |
0.0% |
August's consumer income and spending data are definitely soft but there are spots of high-end strength in the consumer sector and also perhaps the housing sector as well. And if hints of strength in consumer inflation readings are confirmed by a solid rise for average hourly earnings in the September employment report, which by the way is expected, then the hawks will have even more to talk about at the November FOMC meeting.
The week starts fast with the ISM and unit vehicle sales on Monday, offering important advance signals on manufacturing and retail sales. ADP's payroll estimate could move the markets on Wednesday but it will be Friday's September employment report of course that will be the week's focus. The Econoday consensus is calling for a respectable 168,000 rise in non-farm payrolls, a gain that would not raise concerns of labor-market overheating but would be up from August's more moderate 151,000 gain.
Total Vehicle Sales for September
Consensus Forecast, Annualized Rate: 17.4 million
Consensus Range: 17.1 to 17.7 million
Unit vehicle sales have been trending at a solid 17 million annualized rate all year but have not been accelerating. Forecasters see a 2.4 percent gain for September to a 17.4 million annualized rate from August's 17.0 million, one that would point to strength for ex-auto ex-gas retail sales. This core reading on retail sales has inched backwards the last two reports.
ISM Manufacturing Index for September
Consensus Forecast: 50.2
Consensus Range: 49.0 to 51.0
The ISM manufacturing index fell into sub-50 contraction to 49.4 in a disappointing August result that included an 8 point fall for new orders to 49.1. Both production and employment also slowed in the month. Before August, this report had been building momentum. Forecasters see the September index bouncing back over 50 but not by much, to a consensus 50.2.
Construction Spending for August
Consensus Forecast, Month-to-Month Change: +0.3%
Consensus Range: -0.3% to +0.5%
Monthly data on construction spending have been very erratic but not the longer trend which has been flat. Spending on new multi-family homes has been strong but not new single-family homes which is barely growing. On the non-residential side, spending on office and commercial structures has been positive and helping to offset declines in public spending. Following July's no change results, forecasters see August total spending rising 0.3 percent. Oversize revisions are common for this series.
ADP, Private Payrolls for September
Consensus Forecast: 170,000
Consensus Range: 155,000 to 190,000
The positive run for ADP's employment estimates does not include August when its call for a 177,000 rise was far over the government's actual private payroll gain of 126,000. Forecasters see ADP's September call coming at 170,000.
International Trade Balance for August
Consensus Forecast: -$39.0 billion
Consensus Range: -$44.0 to -$37.0 billion
The nation's trade deficit is expected to narrow slightly in August, to a consensus $39.0 billion vs July's $39.5 billion. Advanced trade data on August goods showed a 0.7 percent increase in exports and only a 0.3 percent increase in imports.
Factory Orders for August
Consensus Forecast, Month-to-Month Change: -0.2%
Consensus Range: -0.5% to +0.3%
Factory orders are expected to slip 0.2 percent in August. Advance data on durables goods came in unchanged in August while expectations for the month's non-durable orders, due to lower energy prices, are softer. The durables report showed hints of strength in core capital goods orders.
ISM Non-Manufacturing Index for September
Consensus Forecast: 52.9
Consensus Range: 51.7 to 54.0
The ISM non-manufacturing index slowed suddenly and sharply in August, down more than 4 points to a new cycle low at 51.4. New orders fell nearly 9 points to a multi-year low at 51.9 with export orders and total backlog orders in sub-50 contraction. Until August, this report had been holding very solidly in the mid-50s range. Forecasters see the index rebounding sizably, to 52.9 in September.
Initial Jobless Claims for October 1 week
Consensus Forecast: 256,000
Consensus Range: 250,000 to 260,000
Initial jobless claims have been tracking at historic lows and pointing to healthy conditions in the labor market. Continuing claims have likewise been very low. Forecasters see initial claims climbing but only slightly, up 2,000 in the October 1 week from the prior week's 254,000.
Nonfarm Payrolls for September
Consensus Forecast: 168,000
Consensus Range: 155,000 to 200,000
Private Payrolls
Consensus Forecast: 170,000
Consensus Range: 130,000 to 207,000
Unemployment Rate
Consensus Forecast: 4.9%
Consensus Range: 4.8% to 4.9%
Average Hourly Earnings
Consensus Forecast: +0.3%
Consensus Range: +0.2% to +0.3%
Average Workweek
Consensus Forecast: 34.4 hours
Consensus Range: 34.3 to 34.4 hours
Nonfarm payrolls are expected to bounce back but not much to what would nevertheless be a respectable gain of 168,000 in September following August's more moderate 151,000 gain. In another sign of strength, the unemployment rate is expected to hold steady at 4.9 percent while average hourly earnings, in another sign of strength, are expected to rise 2 tenths to a solid 0.3 percent.
Consumer Credit for August
Consensus Forecast: +$16.6 billion
Consensus Range: +$14.0 billion to +$19.0 billion
Consumer credit is expected to rise $16.6 billion in August following July's $17.7 billion gain. But gains for revolving credit (credit cards) have been limited while non-revolving credit has been the consistent strength of this report, underpinned by student loans but also reflecting solid demand for vehicle financing.
|
