|
The consumer is alive but not that enthusiastic. The week's data also include reports on inflation and employment, updates that are also consistent with steady but slow economic growth. Yet little in life is certain and the data do offer surprises, even positive ones.
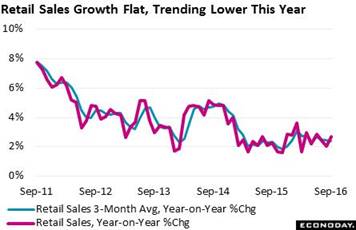 Retail sales popped back up in September but the gain, at least as the third-quarter goes, really doesn't make up for weakness in August and July. Sales rose 0.6 percent with strength centered in autos and also restaurants. There is also strength in two areas out of the housing sector, furniture and building materials. But trends in retail sales remain no better than flat. The graph tracks year-on-year sales on a monthly basis (red line) and on a 3-month average (blue line). Though year-on-year sales rose 6 tenths in September to 2.7 percent, the 4-week average, reflecting the prior two months of weakness, held unchanged at a less-than-stellar 2.4 percent. Sales rates were very strong in the early part of this economic cycle, the result of easy comparisons with the recession, but rates have cooled the past two years with this year showing virtually no lift despite the easy comparison with last year. Retail sales popped back up in September but the gain, at least as the third-quarter goes, really doesn't make up for weakness in August and July. Sales rose 0.6 percent with strength centered in autos and also restaurants. There is also strength in two areas out of the housing sector, furniture and building materials. But trends in retail sales remain no better than flat. The graph tracks year-on-year sales on a monthly basis (red line) and on a 3-month average (blue line). Though year-on-year sales rose 6 tenths in September to 2.7 percent, the 4-week average, reflecting the prior two months of weakness, held unchanged at a less-than-stellar 2.4 percent. Sales rates were very strong in the early part of this economic cycle, the result of easy comparisons with the recession, but rates have cooled the past two years with this year showing virtually no lift despite the easy comparison with last year.
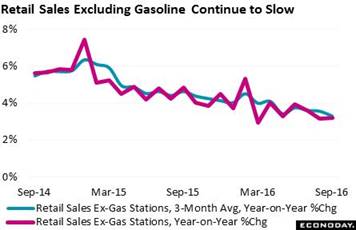 Retail should perhaps be getting a bigger lift from the strong labor market, though lack of wage gains is a problem. Retail should also be getting a lift, at least some lift you would think, from gasoline prices where savings should be showing up as spending in other categories. Sales at gasoline stations, which make up more than 5 percent of total retail sales, are measured in dollars, not volume which can make for big monthly swings as gas prices move back and forth as they always do. Monthly outliers aside, gasoline sales this year have been decidedly down, trending about 10 percent lower in line with a similar decline in gasoline prices. When removing gasoline station sales, the rate of growth for retail sales improves about a percentage point but, unfortunately, not the trend which continues to sink steadily, to a 3-month average of minus 3.3 percent for a 2 tenths decline from August and one of the lowest rates of the recovery. Retail should perhaps be getting a bigger lift from the strong labor market, though lack of wage gains is a problem. Retail should also be getting a lift, at least some lift you would think, from gasoline prices where savings should be showing up as spending in other categories. Sales at gasoline stations, which make up more than 5 percent of total retail sales, are measured in dollars, not volume which can make for big monthly swings as gas prices move back and forth as they always do. Monthly outliers aside, gasoline sales this year have been decidedly down, trending about 10 percent lower in line with a similar decline in gasoline prices. When removing gasoline station sales, the rate of growth for retail sales improves about a percentage point but, unfortunately, not the trend which continues to sink steadily, to a 3-month average of minus 3.3 percent for a 2 tenths decline from August and one of the lowest rates of the recovery.
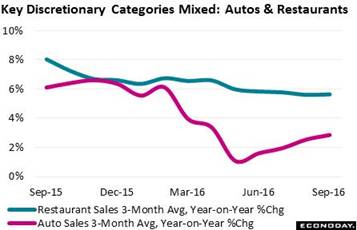 Part of the softening trend is due to auto sales where growth this year, after four years in the high single digits, has slowed to the low single digits. But, as seen in the red line, trend growth has been picking up and is back over 2 percent. Restaurant sales are another discretionary category and, though sloping slightly downward, remain very solid, stable for nearly a year near 6 percent. Auto sales make up about 20 percent of total retail sales while restaurants make up a bit more than 10 percent. Part of the softening trend is due to auto sales where growth this year, after four years in the high single digits, has slowed to the low single digits. But, as seen in the red line, trend growth has been picking up and is back over 2 percent. Restaurant sales are another discretionary category and, though sloping slightly downward, remain very solid, stable for nearly a year near 6 percent. Auto sales make up about 20 percent of total retail sales while restaurants make up a bit more than 10 percent.
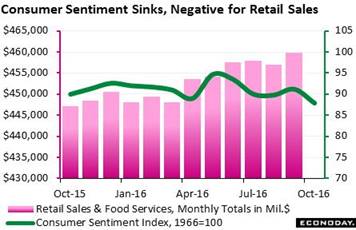 Another reading on the consumer comes from the preliminary consumer sentiment report which offers an early guess on what October retail sales may look like. And the indication, unfortunately, isn't that positive. The index fell a sharp 3.3 points to 87.9 for the weakest showing since September last year. The expectations component is to blame, at 76.6 and falling more than 6 points to indicate a sudden lack of confidence in the income outlook. But not everything in this report is negative as the current conditions component rose slightly to hint at actual month-to-month strength for October consumer spending. Another reading on the consumer comes from the preliminary consumer sentiment report which offers an early guess on what October retail sales may look like. And the indication, unfortunately, isn't that positive. The index fell a sharp 3.3 points to 87.9 for the weakest showing since September last year. The expectations component is to blame, at 76.6 and falling more than 6 points to indicate a sudden lack of confidence in the income outlook. But not everything in this report is negative as the current conditions component rose slightly to hint at actual month-to-month strength for October consumer spending.
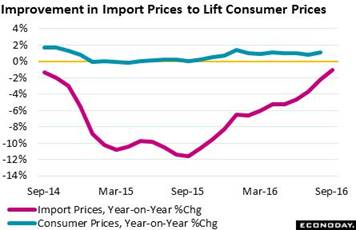 The Federal Reserve continues to wait for signs of inflation to appear before raising rates, at least that was the majority view in the September meeting's tight 7 to 3 vote to keep policy steady and not raise rates. Inflation data in the week, like the retail data, did show life but on net aren't that hot. Import & export prices posted limited monthly gains though year-on-year rates continue to improve, now at minus 1.1 percent for imports and minus 1.5 percent for exports which are the best showings in two years. The Fed continues to cite improvement in import prices (red line) as a plus for the price outlook which should begin to give consumer prices a badly needed lift (blue line). The Federal Reserve continues to wait for signs of inflation to appear before raising rates, at least that was the majority view in the September meeting's tight 7 to 3 vote to keep policy steady and not raise rates. Inflation data in the week, like the retail data, did show life but on net aren't that hot. Import & export prices posted limited monthly gains though year-on-year rates continue to improve, now at minus 1.1 percent for imports and minus 1.5 percent for exports which are the best showings in two years. The Fed continues to cite improvement in import prices (red line) as a plus for the price outlook which should begin to give consumer prices a badly needed lift (blue line).
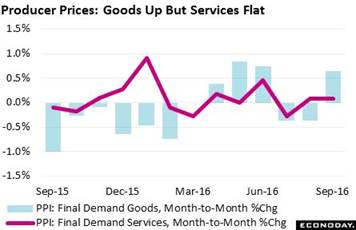 Producer prices also show headline improvement though questions remain. The overall year-on-year rate moved 7 tenths higher to plus 0.7 percent which is still, however, definitely on the low side. Turning to monthly readings, goods prices swung higher on higher energy and food costs, but service prices barely rose at all, up a monthly 0.1 percent. The year-on-year rate for services is doing better than other parts of the report but at plus 1.4 percent is still too low. It will likely take the long-awaited uplift in wage inflation, which has to yet appear of course, to give service costs a boost. Producer prices also show headline improvement though questions remain. The overall year-on-year rate moved 7 tenths higher to plus 0.7 percent which is still, however, definitely on the low side. Turning to monthly readings, goods prices swung higher on higher energy and food costs, but service prices barely rose at all, up a monthly 0.1 percent. The year-on-year rate for services is doing better than other parts of the report but at plus 1.4 percent is still too low. It will likely take the long-awaited uplift in wage inflation, which has to yet appear of course, to give service costs a boost.
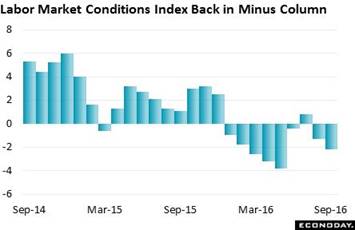 And there is also a run of employment data that, in line with the week's themes in retail and inflation, are also of course mixed. The Fed's experiment with 19 components, that is the labor market conditions index, fell to minus 2.2 for the 8th negative showing in 9 months. The hawks certainly won't be pointing to this index as a reason to hike rates. The Fed doesn't offer many details on this index though one thing is likely for September, that the 1 tenth move higher in the unemployment rate, one of the most heavily weighted of the 19 components, probably had an outsized negative impact. That's because, in a counter-intuitive twist, the move higher in the unemployment rate is actually a positive indication, not a negative one. In September's case, the rise was due to discouraged workers regaining their confidence and coming back into the labor market to look for work. It's this movement to the labor market, by the way, that Janet Yellen didn't want to interrupt with a rate hike at the September FOMC. And there is also a run of employment data that, in line with the week's themes in retail and inflation, are also of course mixed. The Fed's experiment with 19 components, that is the labor market conditions index, fell to minus 2.2 for the 8th negative showing in 9 months. The hawks certainly won't be pointing to this index as a reason to hike rates. The Fed doesn't offer many details on this index though one thing is likely for September, that the 1 tenth move higher in the unemployment rate, one of the most heavily weighted of the 19 components, probably had an outsized negative impact. That's because, in a counter-intuitive twist, the move higher in the unemployment rate is actually a positive indication, not a negative one. In September's case, the rise was due to discouraged workers regaining their confidence and coming back into the labor market to look for work. It's this movement to the labor market, by the way, that Janet Yellen didn't want to interrupt with a rate hike at the September FOMC.
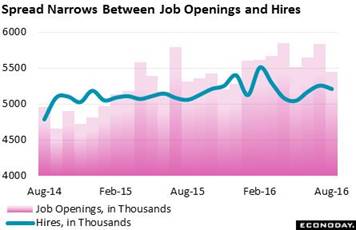 Job openings in the JOLTS report were a clear negative in the week, falling a sharp 7.3 percent in August to 5.443 million at the same time that hiring, instead of rising, slowed by 0.9 percent to 5.210 million. The openings number is the lowest since December last year while the hiring number is more respectable, ranking as the fourth highest so far this year. Though the narrowing in the opening-to-hiring spread points perhaps to slowing payroll growth ahead, it also may ease concern among the hawks that the labor market is about to overheat. Job openings in the JOLTS report were a clear negative in the week, falling a sharp 7.3 percent in August to 5.443 million at the same time that hiring, instead of rising, slowed by 0.9 percent to 5.210 million. The openings number is the lowest since December last year while the hiring number is more respectable, ranking as the fourth highest so far this year. Though the narrowing in the opening-to-hiring spread points perhaps to slowing payroll growth ahead, it also may ease concern among the hawks that the labor market is about to overheat.
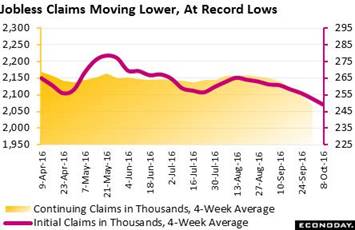 One unequivocal plus in the week's jobs data comes once again from the jobless claims report where readings are at record lows. Initial claims came in at 246,000 in the October 8 week which, matching the prior week, are the lowest in 43 years. The 4-week average, at 249,250 as tracked in the graph (red line), has fallen for 8 straight weeks and is the also the lowest in 43 years. Continuing claims are also running at record lows, in this case in data going back 15 years. The 4-week average here is at 2.07 million. However one measures the labor market, the decline underway in jobless claims means that layoffs are low and that those who are getting laid off are probably finding work more quickly than before. One unequivocal plus in the week's jobs data comes once again from the jobless claims report where readings are at record lows. Initial claims came in at 246,000 in the October 8 week which, matching the prior week, are the lowest in 43 years. The 4-week average, at 249,250 as tracked in the graph (red line), has fallen for 8 straight weeks and is the also the lowest in 43 years. Continuing claims are also running at record lows, in this case in data going back 15 years. The 4-week average here is at 2.07 million. However one measures the labor market, the decline underway in jobless claims means that layoffs are low and that those who are getting laid off are probably finding work more quickly than before.
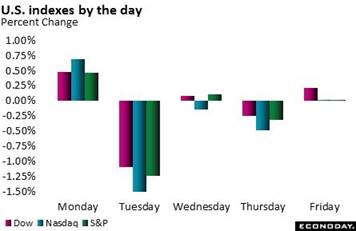 Markets held steady in the week, showing limited reaction to economic news but also to the latest in the presidential race. Bookmakers may still be taking bets on a rate hike at the November FOMC, which comes a week before the November 8 election, but there seems no reasonable chance that Fed officials will want to do that to themselves, that is challenge the election for news coverage. The Dow ended the week with a small loss at 18,138 while oil rose only modestly but did trade over $50 for the first time since June. And the dollar continues to move higher, not reflecting rising expectations for U.S. growth so much but perhaps an easing outlook for global economies including the U.K. and Eurozone. The dollar index rose 1.6 percent to 98.06 which cuts badly into its year-to-date depreciation, now at only 0.8 percent in what is not good news for a factory sector that is trying to move higher. Markets held steady in the week, showing limited reaction to economic news but also to the latest in the presidential race. Bookmakers may still be taking bets on a rate hike at the November FOMC, which comes a week before the November 8 election, but there seems no reasonable chance that Fed officials will want to do that to themselves, that is challenge the election for news coverage. The Dow ended the week with a small loss at 18,138 while oil rose only modestly but did trade over $50 for the first time since June. And the dollar continues to move higher, not reflecting rising expectations for U.S. growth so much but perhaps an easing outlook for global economies including the U.K. and Eurozone. The dollar index rose 1.6 percent to 98.06 which cuts badly into its year-to-date depreciation, now at only 0.8 percent in what is not good news for a factory sector that is trying to move higher.
| Markets at a Glance |
Year-End |
Week Ended |
Week Ended |
Year-To-Date |
Weekly |
|
2015 |
7-Oct-16 |
14-Oct-16 |
Change |
Change |
| DJIA |
17,425.03 |
18,240.49 |
18,138.38 |
4.1% |
-0.6% |
| S&P 500 |
2,043.94 |
2,153.74 |
2,132.98 |
4.4% |
-1.0% |
| Nasdaq Composite |
5,007.41 |
5,292.40 |
5,214.16 |
4.1% |
-1.5% |
|
|
|
|
|
|
| Crude Oil, WTI ($/barrel) |
$37.40 |
$49.63 |
$50.37 |
34.7% |
1.5% |
| Gold (COMEX) ($/ounce) |
$1,060.00 |
$1,257.10 |
$1,252.60 |
18.2% |
-0.4% |
|
|
|
|
|
|
| Fed Funds Target |
0.25 to 0.50% |
0.25 to 0.50% |
0.25 to 0.50% |
0 bp |
0 bp |
| 2-Year Treasury Yield |
1.05% |
0.83% |
0.85% |
–20 bp |
2 bp |
| 10-Year Treasury Yield |
2.27% |
1.72% |
1.80% |
–47 bp |
8 bp |
| Dollar Index |
98.84 |
96.49 |
98.06 |
-0.8% |
1.6% |
Chances for a November rate hike may be nil, but the heat is building for a December rate hike for sure with some hawks talking like it's already a done deal. But the consumer isn't really building up much speed and inflation is basically just lying around flat. And there's still an election to resolve which leaves plenty of uncertainties before a December hike should be considered a lock.
Market movers are out on Monday with the Empire State and industrial production reports, both offering the latest on the still struggling factory sector. Following on Tuesday are consumer prices, which have been flat and keeping the Fed on the sidelines, followed by the home builders' housing market index which spiked in the prior month. Housing starts & permits are out on Wednesday along with the Federal Reserve's beige book where recent economic assessments have been flat. Initial jobless claims on Thursday may offer the most sensitive of all data, tracking the sample week of the monthly employment. Existing home sales are also out Thursday, a surprisingly soft report in recent months with only modest strength expected in September's data.
Empire State Index for October
Consensus Forecast: +1.00
Consensus Range: 0.00 to +2.50
The Empire State index, like the factory sector as a whole, has been flat all year reflecting lack of business investment in new equipment and general weakness in global demand. The index came in at minus 1.99 in September with new orders even weaker at minus 7.45. Forecasters see the October index, which will be the first indication on this month's factory conditions, little changed at a very modest plus 1.00.
Industrial Production for September
Consensus Forecast, Month-to-Month Change: +0.2%
Consensus Range: -0.2% to +0.4%
Manufacturing Production
Consensus Forecast, Month-to-Month Change: +0.1%
Consensus Range: -0.2% to +0.4%
Capacity Utilization Rate
Consensus Forecast: 75.6%
Consensus Range: 75.3% to 75.8%
Industrial production, and the component for manufacturing production, showed solid life in both June and July but not in August as both readings fell 0.4 percent. Forecasters see only a limited rebound for September, with the industrial production consensus at plus 0.2 percent and manufacturing at only plus 0.1 percent. But there have been recent positives including strength in vehicle production and also emerging gains for the deeply depressed mining component. The capacity utilization rate is expected to edge 1 tenth higher to 75.6 percent.
Consumer Price Index for September
Consensus Forecast, Month-to-Month Change: +0.3%
Consensus Range: +0.2% to +0.4%
CPI Core, Less Food & Energy
Consensus Forecast, Month-to-Month Change: +0.2%
Consensus Range: +0.2% to +0.3%
Outside of medical costs, consumer prices have been flat and have shown little benefit from on-and-off pressures in import prices and producer prices. The consumer price index rose a modest 0.2 percent in August with forecasters calling for a 0.3 percent rise in September. Less food & energy, prices rose a constructive 0.3 percent in August but here a slowdown is expected, to plus 0.2 percent.
Housing Market Index for October
Consensus Forecast: 63
Consensus Range: 62 to 64
The housing market index surged 5 points in September to 65 for the best reading in a year and forecasters see only a 2 point give back in October to 63. Home builders have been growing increasingly confident as new home sales begin to pick up sharply. Present sales and expectations of future sales have been very strong in this report while traffic, which had been lagging back, has also begun to pick up.
Housing Starts for September
Consensus Forecast, Adjusted Annualized Rate: 1.180 million
Consensus Range: 1.150 to 1.200 million
Housing Permits
Consensus Forecast: 1.165 million
Consensus Range: 1.150 to 1.182 million
Home builder confidence is up and new home sales have been strong but housing starts and permits have not been showing much strength, down in August by a sharp 5.4 percent for starts to a 1.142 million annualized rate and down 0.4 percent for permits to a 1.139 million rate. Forecasters see a bounce for both in September, with starts at a consensus 1.180 million in what would be a 3.3 percent gain and permits at a consensus 1.165 million in what would be a 2.3 percent gain. One positive in this report has been strength for single-family permits which reflects momentum in new home sales.
Beige Book
Prepared for the November 1 & 2 FOMC Meeting
The Beige Book for the September FOMC was guarded, describing overall growth as no better than modest to moderate and accurately forecasting what would prove to be softness in consumer spending. The labor market, however, was a clear plus in September's assessment as was housing. Both manufacturing and agriculture were described as mixed.
Initial Jobless Claims for October 15 week
Consensus Forecast: 250,000
Consensus Range: 240,000 to 255,000
Initial jobless claims have been tracking at historic lows and pointing to healthy conditions in the labor market. The October 15 week is the sample week of the monthly jobs report and initial claims, seen little changed at 250,000, will offer the first hard indication on what the October employment report is likely to look like.
Philadelphia Fed Manufacturing Index for October
Consensus Forecast: +7.0
Consensus Range: +2.0 to +15.7
The Philadelphia Fed index shot nearly 11 points higher in September to 12.8 but forecasters are calling for slowing in the October report to plus 7.0. New orders have been weak as have many other readings, including employment. The headline for this report does not always move in line with the details.
Existing Home Sales for August
Consensus Forecast, Annualized Rate: 5.350 million
Consensus Range: 5.250 to 5.450 million
Existing home sales have not been showing the strength of new home sales and forecasters see little change for September, at a consensus 5.350 million annualized rate in what would only be a 0.4 percent gain. And the consensus may even be optimistic given what was a 2.4 percent drop in the pending home sales report. Prices are no better than stable, showing little boost from thin supply on the market.
Index of Leading Economic Indicators for September
Consensus Forecast, Month-to-Month Change: +0.2%
Consensus Range: +0.1% to +0.3%
The index of leading indicators is expected to reverse August's 0.2 percent dip with a 0.2 percent gain in September. Positives are expected to include September's decline in jobless claims and strength in the ISM new orders index, with negatives likely to be the factory workweek and softness in the stock market.
|
