|
Outside of a jump in soybean sales, the week's economic news is mostly on the soft side and all but seems to rule out a rate hike at the November 1st and 2nd FOMC meeting. The ironclad good news is that the consumer, benefiting from high levels of employment, is still driving the economy though to a lesser degree than earlier in the year. And the outlook for the fourth quarter' Well, like Hillary Clinton's emails, things may be a bit up in the air.
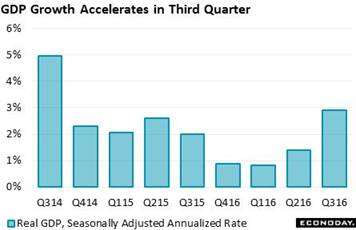 The consumer is definitely the bread-and-butter of the U.S. economy, evident in the latest GDP report which, thanks mostly to the consumer, posted its best showing since third-quarter 2014. Not all the details are positive but this year's third quarter did rise more than expected, at a 2.9 percent annualized rate to roughly match initial expectations going into the quarter. First let's talk about some of the iffier details which include a build in inventories that added 6 tenths to the quarter's growth. Destocking had been pulling down GDP for five straight quarters and ongoing softness in domestic demand (not to mention global demand) raises the question whether the quarter's build is unwanted. Though the size of the build, at $12.6 billion, is less than extreme, it's still a negative for fourth-quarter production and employment. Another negative, and for a second straight quarter, is residential investment, pulling down the quarter's GDP by 2 tenths and reflecting what is surprising weakness in new construction. The consumer is definitely the bread-and-butter of the U.S. economy, evident in the latest GDP report which, thanks mostly to the consumer, posted its best showing since third-quarter 2014. Not all the details are positive but this year's third quarter did rise more than expected, at a 2.9 percent annualized rate to roughly match initial expectations going into the quarter. First let's talk about some of the iffier details which include a build in inventories that added 6 tenths to the quarter's growth. Destocking had been pulling down GDP for five straight quarters and ongoing softness in domestic demand (not to mention global demand) raises the question whether the quarter's build is unwanted. Though the size of the build, at $12.6 billion, is less than extreme, it's still a negative for fourth-quarter production and employment. Another negative, and for a second straight quarter, is residential investment, pulling down the quarter's GDP by 2 tenths and reflecting what is surprising weakness in new construction.
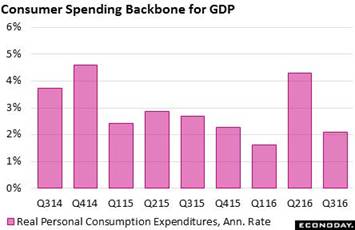 Now the good news and that's consumer spending. Weakness in retail spending in July and August had raised doubts about the consumer but by the end of the quarter, thanks to solid spending on services and a September gain for autos, personal consumption expenditures proved the strongest component in the report, contributing 1.5 percentage points to growth. Spending on services, adding 1.0 percentage point, extended its long streak of strength with durables, though slowing slightly from a second-quarter surge, still adding 7 tenths to growth. Consumer spending is the mainstay of the economy, representing 69 percent of the quarter's $16.7 trillion inflation-adjusted annualized pace. Now the good news and that's consumer spending. Weakness in retail spending in July and August had raised doubts about the consumer but by the end of the quarter, thanks to solid spending on services and a September gain for autos, personal consumption expenditures proved the strongest component in the report, contributing 1.5 percentage points to growth. Spending on services, adding 1.0 percentage point, extended its long streak of strength with durables, though slowing slightly from a second-quarter surge, still adding 7 tenths to growth. Consumer spending is the mainstay of the economy, representing 69 percent of the quarter's $16.7 trillion inflation-adjusted annualized pace.
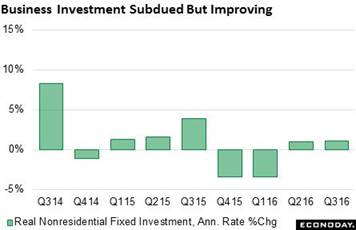 There are also positives outside the domestic consumer. Business spending (nonresidential fixed investment) posted a second straight quarter of improvement, contributing 2 tenths to overall GDP. By far the quirkiest detail of the report, in fact of all the week's run of data, is an export surge for soybeans. Food exports, driven specifically by soybeans, fed a 10.0 percent annualized rate of growth for exports which by themselves added 1.2 points to the quarter's GDP. Is this a one-time event or are soybeans the new wonder crop for the U.S. economy' If they aren't, however, then beans look to be a negative for fourth-quarter GDP. There are also positives outside the domestic consumer. Business spending (nonresidential fixed investment) posted a second straight quarter of improvement, contributing 2 tenths to overall GDP. By far the quirkiest detail of the report, in fact of all the week's run of data, is an export surge for soybeans. Food exports, driven specifically by soybeans, fed a 10.0 percent annualized rate of growth for exports which by themselves added 1.2 points to the quarter's GDP. Is this a one-time event or are soybeans the new wonder crop for the U.S. economy' If they aren't, however, then beans look to be a negative for fourth-quarter GDP.
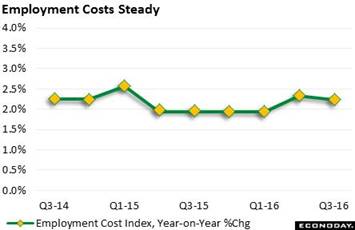 Price data in the GDP report do not show quarterly acceleration but are still higher than prior readings. The GDP price index fell 8 tenths in the quarter to plus 1.5 percent which, outside of the second quarter's 2.3 percent, is the highest since the second quarter of last year. The core index slowed by 2 tenths to 1.9 percent which likewise is the highest in a while. Shifting to the weeks other inflation reading, that is the employment cost index, also shows non-accelerating but still tangible pressure. This index, which is closely watched by FOMC policy makers, rose a quarterly 0.6 percent for the third straight quarter with the year-on-year rate, which is tracked out to two decimal places in the accompanying graph, edging lower to 2.25 percent from 2.34 percent. Though extending growth in the labor market is a risk for wage inflation, the latest ECI won't give the hawks at the FOMC any reason to pound the table. Price data in the GDP report do not show quarterly acceleration but are still higher than prior readings. The GDP price index fell 8 tenths in the quarter to plus 1.5 percent which, outside of the second quarter's 2.3 percent, is the highest since the second quarter of last year. The core index slowed by 2 tenths to 1.9 percent which likewise is the highest in a while. Shifting to the weeks other inflation reading, that is the employment cost index, also shows non-accelerating but still tangible pressure. This index, which is closely watched by FOMC policy makers, rose a quarterly 0.6 percent for the third straight quarter with the year-on-year rate, which is tracked out to two decimal places in the accompanying graph, edging lower to 2.25 percent from 2.34 percent. Though extending growth in the labor market is a risk for wage inflation, the latest ECI won't give the hawks at the FOMC any reason to pound the table.
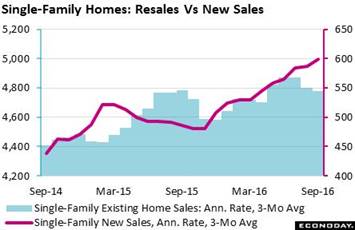 There is unquestionably strong news in the week and it comes from new home sales where gains point to future strength for residential construction. New sales in fact are on a dramatic climb, catching fire late last year and extending the trend to the present. New home sales data, however, are perhaps the most volatile on the whole calendar, reflecting the report's comparatively small sample size. And they definitely showed their volatility in the September report as enormous gains for both August and July were revised sharply downward. Yet revisions aside, the story is the same — one of impressive strength. Series that are prone to volatility, whether because of sample size or a high frequency of reports, are best looked at in moving averages. The graph compares the 3-month average for new home sales, which are right at the 600,000 annualized rate against the 3-month average for resales of single-family homes which are just under a 4.8 million annualized rate. The separation underscores the separation in the housing market right now as resales continue to underperform. There is unquestionably strong news in the week and it comes from new home sales where gains point to future strength for residential construction. New sales in fact are on a dramatic climb, catching fire late last year and extending the trend to the present. New home sales data, however, are perhaps the most volatile on the whole calendar, reflecting the report's comparatively small sample size. And they definitely showed their volatility in the September report as enormous gains for both August and July were revised sharply downward. Yet revisions aside, the story is the same — one of impressive strength. Series that are prone to volatility, whether because of sample size or a high frequency of reports, are best looked at in moving averages. The graph compares the 3-month average for new home sales, which are right at the 600,000 annualized rate against the 3-month average for resales of single-family homes which are just under a 4.8 million annualized rate. The separation underscores the separation in the housing market right now as resales continue to underperform.
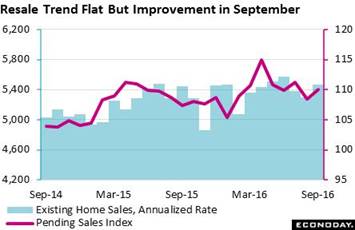 Yet there has been some improvement in resales with perhaps more in store. The pending home sales index, which tracks initial contract signings for resales, rose a very healthy 1.5 percent to a September index level of 110.0 as tracked in the right axis of the graph. Here the comparison is once again with final resales which, however in this case, include condos. Pending sales take a month or two to close and point to October and November strength for final resales. Nevertheless the trend for resales is unquestionably flat, though the extending gains for new sales will eventually lift resales as homeowners sell their old homes and move into their new ones. Yet there has been some improvement in resales with perhaps more in store. The pending home sales index, which tracks initial contract signings for resales, rose a very healthy 1.5 percent to a September index level of 110.0 as tracked in the right axis of the graph. Here the comparison is once again with final resales which, however in this case, include condos. Pending sales take a month or two to close and point to October and November strength for final resales. Nevertheless the trend for resales is unquestionably flat, though the extending gains for new sales will eventually lift resales as homeowners sell their old homes and move into their new ones.
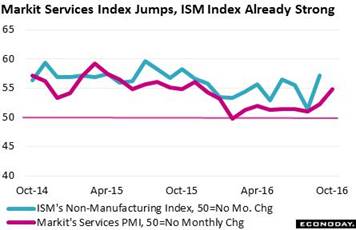 There is also another series that is showing unusual strength this month and that's the U.S. services PMI as compiled by IHS Markit Economics. After posting mostly flat results through most of the year, the index is now on the move, posting a sharp, nearly 3-point upturn to 54.8. New orders are at an 11-month high as is business activity, and year-ahead expectations are at their best level since August last year. The report attributes October's strength to rising hopes for improvement in the domestic economy. And Markit's data point to another month of strength for the coming non-manufacturing report from the Institute for Supply Management (ISM) whose index has been trending all year in the 55 area. There is also another series that is showing unusual strength this month and that's the U.S. services PMI as compiled by IHS Markit Economics. After posting mostly flat results through most of the year, the index is now on the move, posting a sharp, nearly 3-point upturn to 54.8. New orders are at an 11-month high as is business activity, and year-ahead expectations are at their best level since August last year. The report attributes October's strength to rising hopes for improvement in the domestic economy. And Markit's data point to another month of strength for the coming non-manufacturing report from the Institute for Supply Management (ISM) whose index has been trending all year in the 55 area.
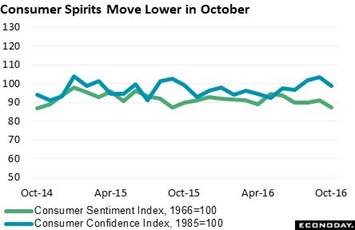 One of the strengths of anecdotal reports like those from Markit and ISM is timeliness. This is also a strength for consumer confidence measures which, unlike the service sector report however, aren't pointing to any burst of strength. The consumer confidence index slipped nearly 5 points in October to 98.6 with many details surrendering two months of prior gains. And the consumer sentiment index also weakened and substantially, ending October at 87.2 which is roughly a 2-year low. But however timely the consumer confidence and consumer sentiment reports may be, they aren't timely enough to measure the immediate effects of unfolding headlines on the election. One of the strengths of anecdotal reports like those from Markit and ISM is timeliness. This is also a strength for consumer confidence measures which, unlike the service sector report however, aren't pointing to any burst of strength. The consumer confidence index slipped nearly 5 points in October to 98.6 with many details surrendering two months of prior gains. And the consumer sentiment index also weakened and substantially, ending October at 87.2 which is roughly a 2-year low. But however timely the consumer confidence and consumer sentiment reports may be, they aren't timely enough to measure the immediate effects of unfolding headlines on the election.
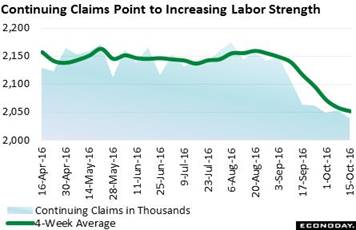 The election itself will of course be the focus of the November 5th week though the October 31st week will have its own highlights to say the least: the FOMC meeting for one not to mention the October employment report. The latter, judging by nothing else but unemployment claims, should be solidly intrend. The monthly employment report is sampled during the mid-month week and comparing initial claims from mid-month September with mid-month October shows little change. And this comparison shows clear improvement for continuing claims which fell 25,000 from the September 17 week and with the 4-week average down a very sizable 65,000 to 2.051 million for a new record low. As the labor market tightens, employers are finding it hard to find replacements and are holding onto their employees. The election itself will of course be the focus of the November 5th week though the October 31st week will have its own highlights to say the least: the FOMC meeting for one not to mention the October employment report. The latter, judging by nothing else but unemployment claims, should be solidly intrend. The monthly employment report is sampled during the mid-month week and comparing initial claims from mid-month September with mid-month October shows little change. And this comparison shows clear improvement for continuing claims which fell 25,000 from the September 17 week and with the 4-week average down a very sizable 65,000 to 2.051 million for a new record low. As the labor market tightens, employers are finding it hard to find replacements and are holding onto their employees.
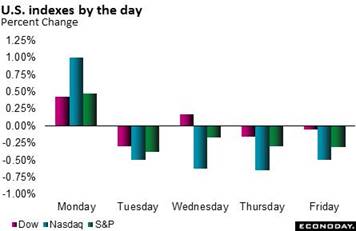 Despite the immediate approach of the election and despite a month-long wave of less-than-overheated economic data, there are still market expectations that the FOMC will demonstrate its independence by raising rates at the November meeting. Fed funds futures show the odds at roughly 1 in 6 for November and a more reasonable 3 to 1 for the December meeting. How markets would react to a November rate hike, let alone how the candidates and the popular media would react, is completely uncertain though an increase in general volatility would seem like a safe bet. Stocks backed off from mid-session gains on Friday when the Clinton email news hit but movements, as they were in other markets, were limited. The Dow, at 18,161, ended fractionally lower on Friday and fractionally higher on the week. Bonds showed little reaction to the Clinton news though the week itself, in line with European bonds, was very soft as the 10-year yield jumped 10 basis points to 1.84 percent. Bond dealers are pointing to technical factors in the market for the selling, less so fundamentally. Despite the immediate approach of the election and despite a month-long wave of less-than-overheated economic data, there are still market expectations that the FOMC will demonstrate its independence by raising rates at the November meeting. Fed funds futures show the odds at roughly 1 in 6 for November and a more reasonable 3 to 1 for the December meeting. How markets would react to a November rate hike, let alone how the candidates and the popular media would react, is completely uncertain though an increase in general volatility would seem like a safe bet. Stocks backed off from mid-session gains on Friday when the Clinton email news hit but movements, as they were in other markets, were limited. The Dow, at 18,161, ended fractionally lower on Friday and fractionally higher on the week. Bonds showed little reaction to the Clinton news though the week itself, in line with European bonds, was very soft as the 10-year yield jumped 10 basis points to 1.84 percent. Bond dealers are pointing to technical factors in the market for the selling, less so fundamentally.
| Markets at a Glance |
Year-End |
Week Ended |
Week Ended |
Year-To-Date |
Weekly |
|
2015 |
21-Oct-16 |
28-Oct-16 |
Change |
Change |
| DJIA |
17,425.03 |
18,145.71 |
18,161.19 |
4.2% |
0.1% |
| S&P 500 |
2,043.94 |
2,141.16 |
2,126.41 |
4.0% |
-0.7% |
| Nasdaq Composite |
5,007.41 |
5,257.40 |
5,190.10 |
3.6% |
-1.3% |
|
|
|
|
|
|
| Crude Oil, WTI ($/barrel) |
$37.40 |
$50.89 |
$48.69 |
30.2% |
-4.3% |
| Gold (COMEX) ($/ounce) |
$1,060.00 |
$1,267.40 |
$1,276.20 |
20.4% |
0.7% |
|
|
|
|
|
|
| Fed Funds Target |
0.25 to 0.50% |
0.25 to 0.50% |
0.25 to 0.50% |
0 bp |
0 bp |
| 2-Year Treasury Yield |
1.05% |
0.84% |
0.87% |
–18 bp |
3 bp |
| 10-Year Treasury Yield |
2.27% |
1.74% |
1.84% |
–43 bp |
10 bp |
| Dollar Index |
98.84 |
98.7 |
98.32 |
-0.5% |
-0.4% |
GDP isn't quite on fire and inflation readings are still not signaling an approaching pivot higher. The outlook for fourth-quarter growth is moderate with perhaps strength in the labor market looking a bit stronger than moderate. The vote at the September FOMC was close at 7 to 3 against raising rates. But that was safely ahead of the election. Will some of the hawks now back off to widen the spread' Or, in a world where anything goes, will some of the doves instead switch sides'
The presidential election will be the highlight of the November 11 week but the November 4 week will offer its own set of major news, and most of it is expected to be solid. Personal income & consumer spending will open the week on Monday with both expected to show respectable gains though price readings are not expected to show much pressure. Vehicle sales and the ISM manufacturing report follow on Tuesday with both expected to show only limited strength. The FOMC announcement follows on Wednesday with no action expected, reflecting the economy's moderate trend, still limited signs of inflation, together with the pending election results. Thursday will see productivity & costs, the former expected to rise and the latter expected to slow in line with improved third-quarter growth. Employment will end the week with respectable nonfarm payroll growth of 178,000 the Econoday forecast together with a dip in the unemployment rate and noticeable strength for average hourly earnings.
Personal Income for September
Consensus Forecast, Month-to-Month Change: +0.4%
Consensus Range: +0.3% to +0.5%
Consumer Spending
Consensus Forecast: +0.5%
Consensus Range: +0.2% to +0.6%
PCE Price Index
Consensus Forecast: +0.2%
Consensus Range: +0.2% to +0.3%
Core PCE Price Index
Consensus Forecast: +0.1%
Consensus Range: +0.1% to +0.3%
Strength for September retail sales points to strength for September consumer spending where the Econoday consensus is calling for a sizable 0.5 percent increase. Personal income is expected to rise a solid a 0.4 percent. Price readings in this report, which are those that the Fed specifically targets, have been subdued but did show improvement in August. But little strength is expected for September with the PCE price index seen 0.2 percent higher and the PCE core index up only 0.1 percent. Note that data in the report will offer a September breakdown of consumer data in the previously released third-quarter GDP report.
Chicago PMI for October
Consensus Forecast: 54.3
Consensus Range: 53.1 to 55.5
The Chicago PMI swung nearly 3 points higher to 54.2 in September and forecasters are calling for little change in October, at a consensus 54.3. This report tracks both the manufacturing and non-manufacturing sectors of the Chicago economy.
Total Vehicle Sales for October
Consensus Forecast, Annualized Rate: 17.6 million
Consensus Range: 17.3 to 17.8 million
Unit vehicle sales correctly foreshadowed what was a strong performance for the motor vehicle component of the September retail sales report. Unit sales jumped 4.7 percent in September to a 17.8 million annualized rate and forecasters see October holding onto the bulk of the gain, at a consensus 17.6 million rate in a month-to-month comparison, however, that would not point to a retail sales increase. Vehicle sales have been solid this year but down from last year's exceptionally strong rates.
ISM Manufacturing Index for October
Consensus Forecast: 51.6
Consensus Range: 50.6 to 52.2
The ISM manufacturing index for October is expected to post a second straight plus 50 reading, at a consensus of 51.6 but little changed from 51.5 in September. New orders in September, at 55.1, were very solid which should be a plus for the October report. Still, this report, like the factory sector itself, has been very flat this year with the headline oscillating near 50.
Construction Spending for September
Consensus Forecast, Month-to-Month Change: +0.6%
Consensus Range: +0.2% to +0.8%
Outside of commercial offices and multi-family homes, construction spending has been very soft this year but is expected to rebound in September's data where the consensus is for a 0.6 percent gain. Construction spending on new single-family homes fell 0.9 percent in August for the third monthly contraction in a row. Private nonresidential spending in August fell 0.4 percent with public spending showing similar weakness. But office spending has been very strong, up nearly 30 percent year-on-year while multi-family homes show a 14 percent yearly gain. This report, where oversized revisions are common, has been very erratic this year.
ADP, Private Payrolls for October
Consensus Forecast: 170,000
Consensus Range: 150,000 to 175,000
ADP's employment estimate for September, like that for August, was less than accurate as a gauge for the government's data. ADP called for a sharp weakening in private payroll growth which in fact rose sharply. Still, this report's 2016 track record is favorable. Forecasters see ADP's call coming in at 170,000 for September, sizably stronger than ADP's August call for 154,000.
Federal Funds Rate Target for November 1 & 2 Meeting:
Consensus Forecast, Midpoint: 0.375%
Consensus Range: 0.25% to 0.50%
The Federal funds rate target has been unchanged at a midpoint of 0.375 percent between a range 0.25 to 0.50 percent since December last year when the FOMC launched what was expected to be a series of rate hikes through this year. Recent growth data have been mostly respectable though employment growth has not been accelerating. Assessments from the latest Beige Book, which was prepared for this meeting, are not pointing to a rate increase with wage growth described as "modest" and general inflation described as "mild."
Initial Jobless Claims for October 29 week
Consensus Forecast: 255,000
Consensus Range: 254,000 to 265,000
Initial jobless claims have been tracking at historic lows and pointing to healthy conditions in the labor market, falling slightly in the October 22 week to 258,000. Forecasters see initial claims falling slightly once again, down 3,000 to 255,000 for the October 29 week.
Non-Farm Productivity, 1st Estimate, Third Quarter
Consensus Forecast, Annualized Rate: +2.2%
Consensus Range: +1.6% to +2.8%
Unit Labor Costs
Consensus Forecast, Annualized Rate: +1.4%
Consensus Range: +0.7% to +1.5%
First estimate for third-quarter non-farm productivity is expected to post the first gain in four quarters, at a plus 2.2 percent annualized rate. The expected gain is tied to improved third-quarter growth that in turn should limit unit labor costs which are expected to moderate to plus 1.4 percent from the second-quarter's sharp 4.3 percent increase.
Factory Orders for September
Consensus Forecast, Month-to-Month Change: +0.2%
Consensus Range: 0.0% to +0.5%
Factory orders are expected to edge 0.2 percent higher in September in line with the 0.2 percent gain in advance data on durable goods orders. The durables report showed visible weakness in core capital goods orders though related shipments did rise.
ISM Non-Manufacturing Index for October
Consensus Forecast: 56.1
Consensus Range: 55.0 to 57.4
The ISM non-manufacturing index surged to 57.1 in September following what was a recovery low of 51.4 in August. This comparison aside, the index has been very steady this year and has been consistently showing solid rates of growth for the bulk of the nation's economy. New orders were especially strong in September, up nearly 9 points to 60.0 with employment also very solid, up 6.5 points to 57.2. Forecasters see the index giving back only some of September's gain with the October consensus at 56.1.
Nonfarm Payrolls for October
Consensus Forecast: 178,000
Consensus Range: 155,000 to 200,000
Private Payrolls
Consensus Forecast: 170,000
Consensus Range: 140,000 to 200,000
Unemployment Rate
Consensus Forecast: 4.9%
Consensus Range: 4.8% to 4.9%
Average Hourly Earnings
Consensus Forecast: +0.3%
Consensus Range: +0.2% to +0.3%
Average Workweek
Consensus Forecast: 34.4 hours
Consensus Range: 34.4 to 34.5 hours
Nonfarm payrolls are expected to show noticeable improvement in October, at a consensus 178,000 vs September's growth of 156,000. The unemployment rate rose 1 tenth in September to 5.0 percent in what, however, was a deceptive result that reflected new entries into the labor market. The rate is expected to move back to 4.9 percent. Average hourly earnings, which have been stubbornly flat, are expected to rise a solid 0.3 percent following September's 0.2 percent gain. The average workweek is seen unchanged at 34.4 hours.
International Trade Balance for September
Consensus Forecast: -$38.9 billion
Consensus Range: -$44.0 to -$36.0 billion
The nation's trade deficit is expected to narrow in September, to a consensus $38.9 billion vs August's $40.7 billion. Advanced trade data on September goods showed a sharp narrowing as exports rose and imports fell.
|
