|
International Perspective will be taking off next week to celebrate
Thanksgiving. IP will return on December 2, 2016.
Equity markets were mixed last week as investors adjusted their portfolios to the changing U.S. economic policy environment brought about by the presidential election results. In part investors paid more attention to the continuing flow of earnings reports and economic data.
Ms Yellen made clear in her testimony to the joint economic committee that the Fed remained likely to raise its fed funds interest rate soon from its current range of 0.25 percent to 0.50 percent. She said that the economic data evidence since the last FOMC meeting were consistent with strengthening growth and an improving labor market. A rate increase, she said, "could well become appropriate relatively soon." Ms Yellen said that it was too soon to predict the likely impact of Donald Trump's election on the economy. She has repeatedly called for Congress to join the Fed in its efforts to lift the economy from prolonged doldrums and noted that there is a great deal of uncertainty.
The Fed is not waiting to raise rates because it lacks confidence in the economy, she said, but because it sees a continued benefit in low borrowing costs. That policy is intended to increase economic growth by encouraging borrowing and risk-taking. Monetary policy exerts a gradual influence on economic conditions and the full effect of a policy move plays out over several years.
| |
|
2015 |
2016 |
% Change |
|
Index |
Dec 31 |
Nov 11 |
Nov 18 |
Week |
2016 |
| Asia/Pacific |
|
|
|
|
|
|
| Australia |
All Ordinaries |
5344.6 |
5446.6 |
5427.53 |
-0.4% |
1.6% |
| Japan |
Nikkei 225 |
19033.7 |
17374.8 |
17967.41 |
3.4% |
-5.6% |
|
Topix |
1547.30 |
1378.28 |
1428.46 |
3.6% |
-7.7% |
| Hong Kong |
Hang Seng |
21914.4 |
22531.1 |
22344.21 |
-0.8% |
2.0% |
| S. Korea |
Kospi |
1961.3 |
1984.4 |
1974.58 |
-0.5% |
0.7% |
| Singapore |
STI |
2882.7 |
2814.6 |
2838.65 |
0.9% |
-1.5% |
| China |
Shanghai Composite |
3539.2 |
3196.0 |
3192.86 |
-0.1% |
-9.8% |
|
|
|
|
|
|
|
| India |
Sensex 30 |
26117.5 |
26818.82 |
26150.24 |
-2.5% |
0.1% |
| Indonesia |
Jakarta Composite |
4593.0 |
5232.0 |
5170.11 |
-1.2% |
12.6% |
| Malaysia |
KLCI |
1692.5 |
1634.2 |
1623.80 |
-0.6% |
-4.1% |
| Philippines |
PSEi |
6952.1 |
6975.1 |
7067.73 |
1.3% |
1.7% |
| Taiwan |
Taiex |
8338.1 |
8957.8 |
9008.79 |
0.6% |
8.0% |
| Thailand |
SET |
1288.0 |
1494.5 |
1473.86 |
-1.4% |
14.4% |
|
|
|
|
|
|
|
| Europe |
|
|
|
|
|
|
| UK |
FTSE 100 |
6242.3 |
6730.4 |
6775.77 |
0.7% |
8.5% |
| France |
CAC |
4637.1 |
4489.3 |
4504.35 |
0.3% |
-2.9% |
| Germany |
XETRA DAX |
10743.0 |
10668.0 |
10664.56 |
0.0% |
-0.7% |
| Italy |
FTSE MIB |
21418.4 |
16812.4 |
16265.90 |
-3.3% |
-24.1% |
| Spain |
IBEX 35 |
9544.2 |
8639.2 |
8622.90 |
-0.2% |
-9.7% |
| Sweden |
OMX Stockholm 30 |
1446.8 |
1451.5 |
1476.47 |
1.7% |
2.0% |
| Switzerland |
SMI |
8818.1 |
7880.3 |
7904.55 |
0.3% |
-10.4% |
|
|
|
|
|
|
|
| North America |
|
|
|
|
|
|
| United States |
Dow |
17425.0 |
18847.7 |
18867.93 |
0.1% |
8.3% |
|
NASDAQ |
5007.4 |
5237.1 |
5321.51 |
1.6% |
6.3% |
|
S&P 500 |
2043.9 |
2164.5 |
2181.90 |
0.8% |
6.7% |
| Canada |
S&P/TSX Comp. |
13010.0 |
14555.4 |
14864.03 |
2.1% |
14.3% |
| Mexico |
Bolsa |
42977.5 |
44978.3 |
44364.170 |
-1.4% |
3.2% |
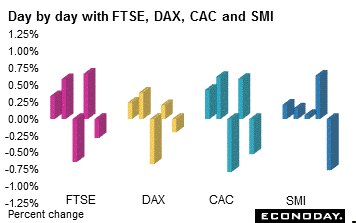 Equities were mixed last week thanks in part to the continuing strength of the U.S. dollar. The currency drove commodity prices lower and with them, the companies that rely on them for profits and growth. The FTSE, CAC and SMI were up for a second consecutive week while the DAX was virtually unchanged. The FTSE climbed 0.7 percent and the CAC and SMI added 0.3 percent. Investors continue to be focused on potential changes that could occur once President-elect Donald Trump takes office on January 20. At week's end, traders were largely focused on news from central banks. The European Central Bank released the minutes from their most recent meeting and Federal Reserve Chair Janet Yellen testified before the U.S. Congress joint economic committee. Equities were mixed last week thanks in part to the continuing strength of the U.S. dollar. The currency drove commodity prices lower and with them, the companies that rely on them for profits and growth. The FTSE, CAC and SMI were up for a second consecutive week while the DAX was virtually unchanged. The FTSE climbed 0.7 percent and the CAC and SMI added 0.3 percent. Investors continue to be focused on potential changes that could occur once President-elect Donald Trump takes office on January 20. At week's end, traders were largely focused on news from central banks. The European Central Bank released the minutes from their most recent meeting and Federal Reserve Chair Janet Yellen testified before the U.S. Congress joint economic committee.
ECB minutes
The European Central Bank published minutes from its October monetary policy meeting. The account suggests that in general the Governing Council continues to harbor very real concerns about the state of the Eurozone economy. Growth was seen as moderate but, while resilient in the face of heightened uncertainties abroad, still subject to downside risks. It was agreed that it would take time for earlier monetary measures to have their full impact and members were wary about boosting market expectations for fresh action. Even so, it was seen as important to re-emphasize the central bank's commitment to maintaining a substantial degree of monetary accommodation and to underline both its willingness and capacity to act again if necessary.
The minutes added little new insight into the monetary policy debate. Clearly, in the wake of persistently subdued economic data, there are still some chances of another round of easing next month even if (for now at least) central bankers are offering few hints of any significant moves. If nothing else, an extension of the current QE program, tentatively slated to end next March, is certainly a possibility as is a modification of the eligibility rules covering the ECB's bond buying program (although the back up in yields has reduced pressure here).
Provisional gross domestic product data were released for the Eurozone and Germany. On the quarter, Eurozone GDP was up 0.3 percent on the quarter and 1.6 percent from a year ago. Germany similarly increased 0.2 percent and 1.7 percent. The UK released October inflation, labor market and retail sales data during the week. While the consumer price index was up 0.9 percent on the year, producer output prices were up 2.1 percent and input prices jumped 12.2 percent. Retail sales surged 1.9 percent for the best performance since January. And the third quarter ILO measure of unemployment slipped to an 11 year low of 4.8 percent from 4.9 percent.
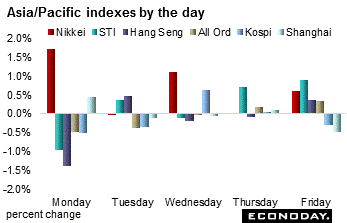 Equities were mixed as many economies in Asia tried to figure out the impact of possible new policies of the U.S. president elect. Emerging market countries are concerned that they will face capital outflows as U.S. interest rates — and inflation — rise. With bond yields climbing in developing economies and the U.S. dollar gaining ground on signs of economic progress and amid expectations for higher inflation and interest rates in the U.S., the outlook for emerging market assets seems to be far more uncertain now. Equities were mixed as many economies in Asia tried to figure out the impact of possible new policies of the U.S. president elect. Emerging market countries are concerned that they will face capital outflows as U.S. interest rates — and inflation — rise. With bond yields climbing in developing economies and the U.S. dollar gaining ground on signs of economic progress and amid expectations for higher inflation and interest rates in the U.S., the outlook for emerging market assets seems to be far more uncertain now.
Asian equity markets have been whipsawed since Republican Donald Trump's shock election victory on November 8. Emerging-market assets have been hit by expectations for faster U.S. interest rate increases amid speculation Trump's spending plans will boost inflation.
The Nikkei was up 3.4 percent on the week as the yen continued to weaken. The index ended the week just shy of the 18,000 level. Comments from Fed Chair Janet Yellen regarding future interest rate increases — namely that they would be gradual and the Fed was nearing a decision to increase rates for the first time since December 2015 — sent the yen tumbling. Fed funds futures were showing a 100 percent chance of a U.S. rate increase in December late Friday afternoon.
Across the region, financial stocks got a boost as investors continued to bet that Mr Trump's presidency could see looser banking regulations and higher interest rates. Japanese shares have rallied and volumes surged as the yen slumped and investors bet earnings at financial companies will benefit from higher borrowing costs. But concerns that Trump will implement more protectionist trade policies have also spurred capital flight from emerging markets.
Japan's third quarter gross domestic product expanded at an annualized rate of 2.2 percent — analysts expected an increase of 0.8 percent. China's industrial output was up 6.1 percent in October when compared with the previous year while retail sales disappointed. Sales increased 10.0 percent, below expectations of a 10.7 percent increase.
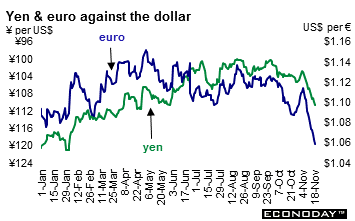 The U.S. dollar continued to gain against most of its major counterparts — the yen, euro, pound sterling and Swiss franc. However, it was lower against the Canadian dollar on the week. The currency's strength is being driven by expectations of reflationary economic policies in the U.S. Investors also expect that the Federal Reserve will raise interest rates at its December 14 FOMC meeting. Fed Chair Janet Yellen suggested Thursday the Fed remained on course to tighten policy. The U.S. dollar appreciated over the past two weeks as Treasury yields surged on speculation the new administration will boost spending. The U.S. dollar continued to gain against most of its major counterparts — the yen, euro, pound sterling and Swiss franc. However, it was lower against the Canadian dollar on the week. The currency's strength is being driven by expectations of reflationary economic policies in the U.S. Investors also expect that the Federal Reserve will raise interest rates at its December 14 FOMC meeting. Fed Chair Janet Yellen suggested Thursday the Fed remained on course to tighten policy. The U.S. dollar appreciated over the past two weeks as Treasury yields surged on speculation the new administration will boost spending.
The impact of the strong dollar depends where you are geographically. For Japan, a weaker yen against the U.S. dollar is a good thing because it makes goods more competitive in their export markets. However for the emerging countries, excessive dollar strength could trigger capital flight risks. The Bank for International Settlements warned almost two years ago that a prolonged rally in the dollar could expose financial vulnerabilities in emerging markets after years of increasing amounts of dollar-denominated debt issuances.
|
|
2015 |
2016 |
% Change |
|
|
Dec 31 |
Nov 11 |
Nov 18 |
Week |
2016 |
| U.S. $ per currency |
|
|
|
|
|
|
| Australia |
A$ |
0.7288 |
0.755 |
0.734 |
-2.8% |
0.7% |
| New Zealand |
NZ$ |
0.6833 |
0.713 |
0.702 |
-1.5% |
2.7% |
| Canada |
C$ |
0.7231 |
0.738 |
0.740 |
0.3% |
2.4% |
| Eurozone |
euro (€) |
1.0871 |
1.085 |
1.059 |
-2.4% |
-2.6% |
| UK |
pound sterling (£) |
1.4742 |
1.260 |
1.236 |
-1.9% |
-16.2% |
|
|
|
|
|
|
|
| Currency per U.S. $ |
|
|
|
|
|
|
| China |
yuan |
6.4937 |
6.812 |
6.887 |
-1.1% |
-5.7% |
| Hong Kong |
HK$* |
7.7501 |
7.758 |
7.757 |
0.0% |
-0.1% |
| India |
rupee |
66.1537 |
67.246 |
68.138 |
-1.3% |
-2.9% |
| Japan |
yen |
120.2068 |
106.730 |
110.840 |
-3.7% |
8.5% |
| Malaysia |
ringgit |
4.2943 |
4.342 |
4.418 |
-1.7% |
-2.8% |
| Singapore |
Singapore $ |
1.4179 |
1.413 |
1.426 |
-0.9% |
-0.6% |
| South Korea |
won |
1175.0600 |
1164.660 |
1183.000 |
-1.6% |
-0.7% |
| Taiwan |
Taiwan $ |
32.8620 |
31.865 |
32.058 |
-0.6% |
2.5% |
| Thailand |
baht |
36.0100 |
35.400 |
35.560 |
-0.4% |
1.3% |
| Switzerland |
Swiss franc |
1.0014 |
0.9882 |
1.0101 |
-2.2% |
-0.9% |
| *Pegged to U.S. dollar |
|
|
|
|
|
|
| Source: Bloomberg |
|
|
|
|
|
|
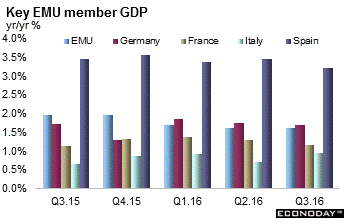 Third quarter flash gross domestic product estimate was unrevised. In addition to the 0.3 percent quarterly rate, annual workday adjusted growth of 1.6 was also unchanged at its previously reported mark. The lack of any revision masked a disappointingly soft performance by Germany where GDP expanded just 0.2 percent on the quarter, only half the unrevised gain it posted in the previous period and equaling the smallest rise since fourth quarter of 2014. France matched this subdued pace and Italy was just a tick better off so headline growth would have looked worse but for Spain which recorded a solid 0.7 percent rate. As usual with the flash reports, Eurostat provided no information on the GDP expenditure components but from national statistics offices it would seem that domestic final demand continued to struggle. In particular, household consumption and business investment failed to provide the boost needed to achieve a self-sustaining recovery. Third quarter flash gross domestic product estimate was unrevised. In addition to the 0.3 percent quarterly rate, annual workday adjusted growth of 1.6 was also unchanged at its previously reported mark. The lack of any revision masked a disappointingly soft performance by Germany where GDP expanded just 0.2 percent on the quarter, only half the unrevised gain it posted in the previous period and equaling the smallest rise since fourth quarter of 2014. France matched this subdued pace and Italy was just a tick better off so headline growth would have looked worse but for Spain which recorded a solid 0.7 percent rate. As usual with the flash reports, Eurostat provided no information on the GDP expenditure components but from national statistics offices it would seem that domestic final demand continued to struggle. In particular, household consumption and business investment failed to provide the boost needed to achieve a self-sustaining recovery.
 Third quarter preliminary gross domestic product was up 0.2 percent and was only half the unrevised gain posted in the previous period and equaled the smallest rise since the fourth quarter of 2014. On the year, GDP was up 1.7 percent, its worst performance since the fourth quarter of 2015. As is usual with the flash estimate, no figures for the key GDP expenditure components were provided. Third quarter preliminary gross domestic product was up 0.2 percent and was only half the unrevised gain posted in the previous period and equaled the smallest rise since the fourth quarter of 2014. On the year, GDP was up 1.7 percent, its worst performance since the fourth quarter of 2015. As is usual with the flash estimate, no figures for the key GDP expenditure components were provided.
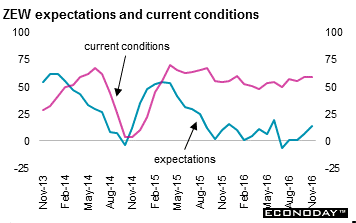 November ZEW survey showed a slight improvement in analysts' overall assessment of the German economic situation. At a lower than anticipated 58.8, the current conditions component was just 0.7 points short of its October reading when it rose 4.4 points to its highest level since January. Expectations moved up 7.6 points to 13.8, their fourth rise in a row and the largest increase since June. November ZEW survey showed a slight improvement in analysts' overall assessment of the German economic situation. At a lower than anticipated 58.8, the current conditions component was just 0.7 points short of its October reading when it rose 4.4 points to its highest level since January. Expectations moved up 7.6 points to 13.8, their fourth rise in a row and the largest increase since June.
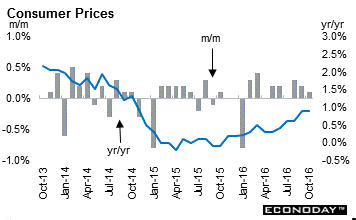 October consumer price index edged up 0.1 percent and was up 0.9 percent from the same month a year ago. The main boost to the monthly change in the annual inflation rate came from transport where motor fuel prices were up 2.3 percent on the month compared with a 0.9 percent drop a year ago. Furniture, household equipment& maintenance (0.5 percent after minus 1.0 percent) also had a significant positive effect. This was the first monthly rise in the subsector's prices on record. However, the combined effects here were outweighed by clothing & footwear (0.2 percent after 2.3 percent), recreation & culture (0.2 percent after 0.8 percent) and education (2.0 percent after 3.6 percent). As a result, the yearly core inflation rate eased from 1.5 percent in September to 1.2 percent, equaling its lowest mark since February. October consumer price index edged up 0.1 percent and was up 0.9 percent from the same month a year ago. The main boost to the monthly change in the annual inflation rate came from transport where motor fuel prices were up 2.3 percent on the month compared with a 0.9 percent drop a year ago. Furniture, household equipment& maintenance (0.5 percent after minus 1.0 percent) also had a significant positive effect. This was the first monthly rise in the subsector's prices on record. However, the combined effects here were outweighed by clothing & footwear (0.2 percent after 2.3 percent), recreation & culture (0.2 percent after 0.8 percent) and education (2.0 percent after 3.6 percent). As a result, the yearly core inflation rate eased from 1.5 percent in September to 1.2 percent, equaling its lowest mark since February.
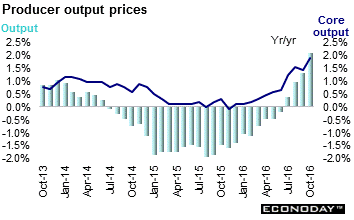 October factory gate prices gained 0.6 percent on the month after an upwardly revised 0.3 percent in September to lift their annual rate from 1.3 percent to 2.1 percent. At the same time, input costs surged fully 4.6 percent from September, raising their yearly rate from 7.3 percent to 12.2 percent. Output prices were hit by a 4.2 percent surge in petroleum products which dominated the overall monthly change. Other components were better behaved but there were still large gains in food (0.6 percent), chemicals & pharmaceuticals (0.5 percent) and transport equipment (0.7 percent). The core factory gate index rose a slightly smaller 0.4 percent but, at 1.9 percent, its annual rate was the strongest in more than four years. Higher input costs were also largely attributable to more expensive energy and crude oil. However, the weakness of the pound was very apparent in all of the imported component prices. October factory gate prices gained 0.6 percent on the month after an upwardly revised 0.3 percent in September to lift their annual rate from 1.3 percent to 2.1 percent. At the same time, input costs surged fully 4.6 percent from September, raising their yearly rate from 7.3 percent to 12.2 percent. Output prices were hit by a 4.2 percent surge in petroleum products which dominated the overall monthly change. Other components were better behaved but there were still large gains in food (0.6 percent), chemicals & pharmaceuticals (0.5 percent) and transport equipment (0.7 percent). The core factory gate index rose a slightly smaller 0.4 percent but, at 1.9 percent, its annual rate was the strongest in more than four years. Higher input costs were also largely attributable to more expensive energy and crude oil. However, the weakness of the pound was very apparent in all of the imported component prices.
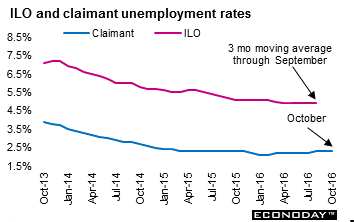 October claimant count joblessness was up a surprisingly sharp 9,800 after a larger revised 5,600 increase in September. This means that, on this definition, the number of people out of work has now risen for three consecutive months and in six of the last seven. October's increase was also the steepest since May. However, it was not enough to move the jobless rate which held steady at just 2.3 percent. The ILO measure of unemployment dropped 37,000 in the third quarter with the jobless rate slipping to 4.8 percent, its smallest post since July to September 2005. At the same time, employment rose 49,000, roughly evenly split between full-time and part-time workers, to lift the employment rate to 74.5 percent, a new record high. Annual average earnings growth last quarter was unchanged at 2.3 percent. Excluding bonuses the rate was just 0.1 percentage points higher at 2.4 percent. October claimant count joblessness was up a surprisingly sharp 9,800 after a larger revised 5,600 increase in September. This means that, on this definition, the number of people out of work has now risen for three consecutive months and in six of the last seven. October's increase was also the steepest since May. However, it was not enough to move the jobless rate which held steady at just 2.3 percent. The ILO measure of unemployment dropped 37,000 in the third quarter with the jobless rate slipping to 4.8 percent, its smallest post since July to September 2005. At the same time, employment rose 49,000, roughly evenly split between full-time and part-time workers, to lift the employment rate to 74.5 percent, a new record high. Annual average earnings growth last quarter was unchanged at 2.3 percent. Excluding bonuses the rate was just 0.1 percentage points higher at 2.4 percent.
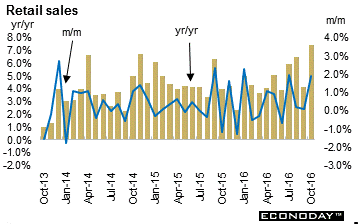 October retail sales jumped 1.9 percent on the month and equaling their best performance since January's 2.3 percent leap. Annual growth of purchases climbed more than 3 percentage points to some 7.4 percent, its highest mark since April 2002. The latest advance was broad-based with all of the major subsectors registering monthly gains. In fact, non-food sales even dwarfed the headline with a 2.8 percent spurt. Within this, clothing & footwear dominated with an increase of 4.6 percent but this essentially just reversed the cumulative drop seen in August and September and weather may well have been a factor here. Nonetheless, household goods rose 2.3 percent, non-store retailing 3.2 percent and the other stores category 3.4 percent. Non-specialised stores edged up 0.1 percent while auto fuel was 3.6 percent firmer. October retail sales jumped 1.9 percent on the month and equaling their best performance since January's 2.3 percent leap. Annual growth of purchases climbed more than 3 percentage points to some 7.4 percent, its highest mark since April 2002. The latest advance was broad-based with all of the major subsectors registering monthly gains. In fact, non-food sales even dwarfed the headline with a 2.8 percent spurt. Within this, clothing & footwear dominated with an increase of 4.6 percent but this essentially just reversed the cumulative drop seen in August and September and weather may well have been a factor here. Nonetheless, household goods rose 2.3 percent, non-store retailing 3.2 percent and the other stores category 3.4 percent. Non-specialised stores edged up 0.1 percent while auto fuel was 3.6 percent firmer.
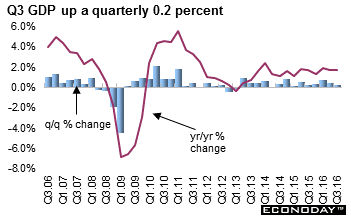
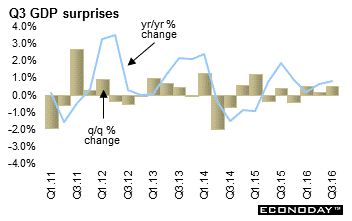 First estimate of third quarter gross domestic product was up 0.5 percent on the quarter or at an annualized rate of 2.2 percent. On the year, GDP was up 0.8 percent. The quarterly increase was driven by external demand with net exports making a positive contribution to the headline increase. However, private domestic demand was weak. Private consumption inched up only 0.1 percent on the quarter while private investment was flat. Public demand made a zero contribution to headline growth in the quarter, with stronger government consumption spending offset by a drop in government investment spending. First estimate of third quarter gross domestic product was up 0.5 percent on the quarter or at an annualized rate of 2.2 percent. On the year, GDP was up 0.8 percent. The quarterly increase was driven by external demand with net exports making a positive contribution to the headline increase. However, private domestic demand was weak. Private consumption inched up only 0.1 percent on the quarter while private investment was flat. Public demand made a zero contribution to headline growth in the quarter, with stronger government consumption spending offset by a drop in government investment spending.
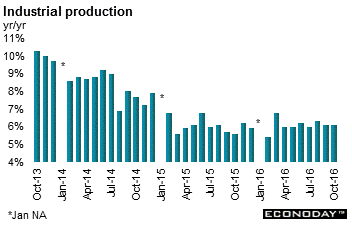 October industrial production rose 6.1 percent on the year, unchanged from 6.1 percent in September and close to growth rates that have prevailed since April. On the month, output was up 0.5 percent. Year-to-date growth was unchanged at 6.0 percent, where it had been for the previous four months. Manufacturing production recorded slightly stronger year-on-year growth, up from 6.5 percent in September to 6.7 percent in October while utilities output posted a stronger increase, up from 7.3 percent to 7.9 percent. Mining production weakened declining 2.2 percent. October industrial production rose 6.1 percent on the year, unchanged from 6.1 percent in September and close to growth rates that have prevailed since April. On the month, output was up 0.5 percent. Year-to-date growth was unchanged at 6.0 percent, where it had been for the previous four months. Manufacturing production recorded slightly stronger year-on-year growth, up from 6.5 percent in September to 6.7 percent in October while utilities output posted a stronger increase, up from 7.3 percent to 7.9 percent. Mining production weakened declining 2.2 percent.
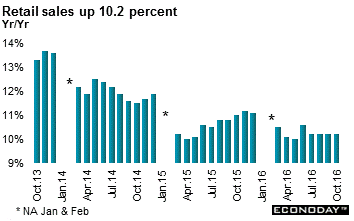 October retail sales were up 10.0 percent on the year after increasing 10.7 percent in September. For the year to date, sales were up 10.3 percent in the ten months through October. Retail sales were up 0.7 percent on the month after increasing by 0.8 percent in September. Both urban and rural sales slowed. Urban sales slowed to 10.0 percent from 10.7 percent and rural sales increased 10.3 percent, down from 11.0 percent. The slowdown was also relatively broad-based across different categories of consumer spending, with growth slowing in eight out of the twelve major categories reported. October retail sales were up 10.0 percent on the year after increasing 10.7 percent in September. For the year to date, sales were up 10.3 percent in the ten months through October. Retail sales were up 0.7 percent on the month after increasing by 0.8 percent in September. Both urban and rural sales slowed. Urban sales slowed to 10.0 percent from 10.7 percent and rural sales increased 10.3 percent, down from 11.0 percent. The slowdown was also relatively broad-based across different categories of consumer spending, with growth slowing in eight out of the twelve major categories reported.
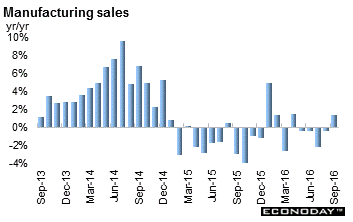 September manufacturing sales were up a greater than anticipated 0.3 percent on the month. On the year, sales were up 1.4 percent. Sales had increased a healthy 0.9 percent in August. This was the fourth consecutive monthly increase. The gain reflected higher sales in the transportation equipment and fabricated metal industries. Sales were up in 12 of 21 industries, representing 70.1 percent of the total manufacturing sector. However, in volume terms, sales retreated a monthly 0.2 percent indicating that lower volumes of manufactured goods were sold in September. Unfilled orders declined for the third consecutive month, this time down 0.2 percent thanks to lower unfilled orders in the fabricated metal product, electrical equipment appliance & component, and computer & electronic industries. These declines were partly offset by an increase in unfilled orders in the aerospace product and parts & machinery industries. New orders rose 2.3 percent as a result of gains in the transportation equipment & machinery. September manufacturing sales were up a greater than anticipated 0.3 percent on the month. On the year, sales were up 1.4 percent. Sales had increased a healthy 0.9 percent in August. This was the fourth consecutive monthly increase. The gain reflected higher sales in the transportation equipment and fabricated metal industries. Sales were up in 12 of 21 industries, representing 70.1 percent of the total manufacturing sector. However, in volume terms, sales retreated a monthly 0.2 percent indicating that lower volumes of manufactured goods were sold in September. Unfilled orders declined for the third consecutive month, this time down 0.2 percent thanks to lower unfilled orders in the fabricated metal product, electrical equipment appliance & component, and computer & electronic industries. These declines were partly offset by an increase in unfilled orders in the aerospace product and parts & machinery industries. New orders rose 2.3 percent as a result of gains in the transportation equipment & machinery.
The U.S. dollar continued to climb against its counterparts while yields on Treasury securities climbed. Equities were mixed. U.S. economic data released during the week were mostly positive and added to the likelihood that the Fed will increase its fed funds rate when it meets in mid-December. Data were mixed in Europe. Investors globally are trying to assess their portfolios in light of the U.S. election results which led to choppy trading.
| The following indicators will be released this week... |
| Europe |
|
|
| Nov 22 |
Eurozone |
EC Consumer Sentiment (November flash) |
| Nov 23 |
Eurozone |
Manufacturing , Services & Composite PMI (November flash) |
|
France |
Manufacturing , Services & Composite PMI (November flash) |
|
Germany |
Manufacturing , Services & Composite PMI (November flash) |
| Nov 24 |
Germany |
Gross Domestic Product (Q3.2016 final) |
|
|
Ifo Survey (November) |
| Nov 25 |
UK |
Gross Domestic Product (Q3.2016 second estimate) |
| |
|
|
| Asia Pacific |
|
|
| Nov 21 |
Japan |
Merchandise Trade Balance (October) |
| Nov 24 |
Japan |
Manufacturing PMI (November flash) |
| Nov 25 |
Japan |
Consumer Price Index (October) |
| |
|
|
| Americas |
|
|
| Nov 22 |
Canada |
Retail Sales (September) |
| Central Bank activities |
|
| Nov 30 |
United States |
Federal Reserve Beige Book Published |
| |
|
|
| The following indicators will be released this week... |
| Europe |
|
|
| Nov 28 |
Eurozone |
M3 Money Supply (October) |
| Nov 29 |
Eurozone |
EC Consumer & Business Confidence (November) |
|
France |
Consumption of Manufactured Goods (October) |
|
|
Gross Domestic Product (Q3.2016 preliminary) |
| Nov 30 |
Eurozone |
Harmonized Index of Consumer Prices (November, flash) |
|
Germany |
Retail Sales (October) |
|
|
Unemployment (November) |
| Dec 1 |
Eurozone |
Manufacturing PMI (November final) |
|
|
Unemployment (October) |
|
Germany |
Manufacturing PMI (November final) |
|
France |
Manufacturing PMI (November final) |
|
UK |
Manufacturing PMI (November final) |
|
Italy |
Gross Domestic Product (Q3.2016 final) |
| |
|
|
| Asia Pacific |
|
|
| Nov 29 |
Japan |
Unemployment (October) |
|
|
Household Spending (October) |
|
|
Retail Sales (October) |
| Nov 30 |
Japan |
Industrial Production (October) |
| Dec 1 |
Japan |
Manufacturing PMI (November final) |
|
China |
Manufacturing PMI (November final) |
|
|
CFLP Manufacturing PMI (November) |
| Dec 2 |
Australia |
Retail Sales (October) |
| |
|
|
| Americas |
|
|
| Nov 30 |
Canada |
Gross Domestic Product (Q3.2016) |
|
|
Monthly Gross Domestic Product (September) |
| Dec 2 |
Canada |
Labour Force Survey (November) |
Anne D Picker is the author of International Economic Indicators and Central Banks.
|
