|
Most equity markets advanced last week with all indexes followed here gaining with the exception of the Shanghai Composite (down 0.3 percent). Advances ranged from 7.1 percent (MIB) to a low of 0.8 percent (KLCI). The U.S. dollar continued to strengthen in anticipation of the Federal Reserve's fed funds rate increase expected on Wednesday.
The influence of central bank decisions on global markets was apparent especially after the European Central Bank's announcement on Thursday. Problems that addled investors passed on quickly. After worrying about the Italian constitutional referendum and what could happen if it lost, markets reaction was short after the constitutional reforms referendum failed to pass. Prime Minister Matteo Renzi resigned as promised.
The first of two weeks of the last central bank meetings in 2016 have begun. This past week saw the Reserve Banks of Australia and India and the Bank of Canada keep their policy interest rates unchanged. While the European Central Bank kept its interest rates unchanged, it altered its bond purchase program.
Reserve Bank of Australia
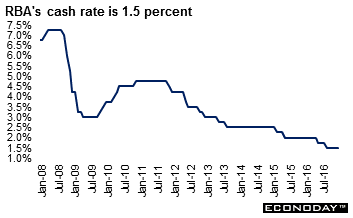 The Reserve Bank of Australia left its cash rate unchanged at a record low 1.50 percent where it has been since August. The statement accompanying the decision differed in some ways to November's. The global economy was again described as growing at a lower than average pace but the inflation outlook was considered to be more "balanced" than it has been previously. The board also referred to the increase in government bond yields that has taken place in Australia and elsewhere after the U.S. presidential election, but this adjustment was characterized as "orderly". The Reserve Bank of Australia left its cash rate unchanged at a record low 1.50 percent where it has been since August. The statement accompanying the decision differed in some ways to November's. The global economy was again described as growing at a lower than average pace but the inflation outlook was considered to be more "balanced" than it has been previously. The board also referred to the increase in government bond yields that has taken place in Australia and elsewhere after the U.S. presidential election, but this adjustment was characterized as "orderly".
The RBA's view of the domestic economy's growth has been adjusted slightly. Previously the economy was said to be growing at a moderate pace, but now the RBA said more explicitly that they expect growth to slow in the near-term before picking up again. The board also placed more emphasis on the economy's transition from the previous mining boom, noting the "subdued" outlook for business investment but also the prospect of stronger export performance.
Reserve Bank of India
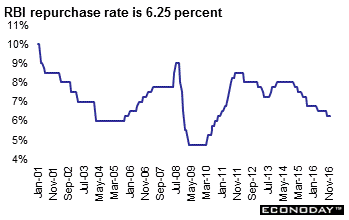 The Reserve Bank of India disappointed the markets and left its repurchase rate unchanged at 6.25 percent. The decision was unanimous among members of the monetary policy committee. The committee said that the current policy stance is consistent with their medium-term goal of keeping headline inflation in a target range of 2.0 percent to 6.0 percent. A rate cut was widely anticipated after the November PMI surveys showed a sharp drop in business activity. But this was largely driven by cash shortages in the economy after the government announced early in the month that it would withdraw high denomination notes as legal tender as part of efforts to curb tax avoidance and corruption. The RBI's decision to leave policy unchanged suggests that officials expect the negative impact to be relatively limited and short-lived. The Reserve Bank of India disappointed the markets and left its repurchase rate unchanged at 6.25 percent. The decision was unanimous among members of the monetary policy committee. The committee said that the current policy stance is consistent with their medium-term goal of keeping headline inflation in a target range of 2.0 percent to 6.0 percent. A rate cut was widely anticipated after the November PMI surveys showed a sharp drop in business activity. But this was largely driven by cash shortages in the economy after the government announced early in the month that it would withdraw high denomination notes as legal tender as part of efforts to curb tax avoidance and corruption. The RBI's decision to leave policy unchanged suggests that officials expect the negative impact to be relatively limited and short-lived.
The statement accompanying the decision explicitly notes that the near-term outlook is "clouded" by the currency withdrawal, but that "a fuller assessment is awaited". The committee expects interruptions to "some" parts of industrial activity in November and December and sees downside risks for the near term due to short-run disruptions in cash intensive sectors of the economy and adverse wealth effects. However, they believe the impact of the first of these two factors will be temporary and that the impact of the second factor will be "limited". Nevertheless, the RBI's growth forecast for the current fiscal year was revised down from 7.6 percent to 7.1 percent.
Bank of Canada
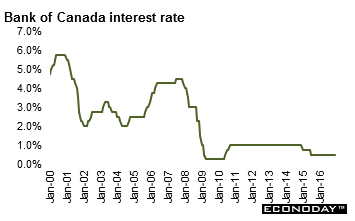 As expected, the Bank of Canada left its key interest rate at 0.5 percent where it has been since July 2015. The target for the deposit rate remained fixed at 0.25 percent and the Bank Rate at 0.75 percent. According to the BoC, "recent economic data suggest that global economic conditions have strengthened." "Uncertainty, which has been undermining business confidence and dampening investment in Canada's major trading partners, remains undiminished." The Bank said that following the US election there has been a rapid back-up in global bond yields. This partly reflects market anticipation of fiscal expansion in an economy that is near full capacity. Canadian yields have risen significantly in this context. As expected, the Bank of Canada left its key interest rate at 0.5 percent where it has been since July 2015. The target for the deposit rate remained fixed at 0.25 percent and the Bank Rate at 0.75 percent. According to the BoC, "recent economic data suggest that global economic conditions have strengthened." "Uncertainty, which has been undermining business confidence and dampening investment in Canada's major trading partners, remains undiminished." The Bank said that following the US election there has been a rapid back-up in global bond yields. This partly reflects market anticipation of fiscal expansion in an economy that is near full capacity. Canadian yields have risen significantly in this context.
According to the statement, the dynamics of growth are largely as the Bank anticipated. Following a very weak first half of the year, third quarter growth rebounded strongly. However, more moderate growth is anticipated in the fourth quarter. Consumption growth was robust in the third quarter, supported by the new Canada Child Benefit. The effects of federal infrastructure spending are not yet evident in the GDP data. However, business investment and non-energy goods exports continue to disappoint. There have been ongoing gains in employment, but a significant amount of economic slack remains. Total CPI inflation has picked up in recent months but is slightly below expectations, largely because of lower food prices. Core inflation is close to 2 percent because the effect of persistent economic slack is still being offset by that of past exchange rate depreciation, although the latter effect is dissipating.
European Central Bank
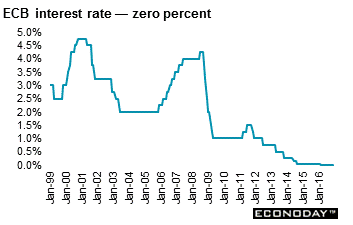 The European Central Bank ended 2016 without any changes to key interest rates. The benchmark refi rate stayed at zero percent, the deposit rate at minus 0.40 percent and the rate on the marginal lending facility at 0.25 percent. However, the ECB did announce both an extension to the current asset purchase program as well as a future reduction in its scale going forward. The European Central Bank ended 2016 without any changes to key interest rates. The benchmark refi rate stayed at zero percent, the deposit rate at minus 0.40 percent and the rate on the marginal lending facility at 0.25 percent. However, the ECB did announce both an extension to the current asset purchase program as well as a future reduction in its scale going forward.
Monthly asset purchases which had previously been scheduled to end in March 2017 remained pegged around €80 billion a month. Thereafter the purchases will be reduced to a monthly €60 billion through the end 2017. This will add an additional €540 billion of liquidity from the original March cut-off date. The ECB's statement indicated that the new asset purchase schedule is flexible in both duration and size. Financial markets had been looking for a six month extension at the previous rate (worth €480 billion). However, the ECB was more generous than anticipated. This should offer some reassurance that the monetary authorities' stance will remain very accommodative throughout 2017 despite the apparent tapering.
The announcement probably constitutes a compromise between those Governing Council members who are unconvinced that the Eurozone economy is out of the woods and those increasingly worried about what damage such a high degree of monetary accommodation might be doing to the longer-term outlook. For bond markets, any hint of tapering was never going to sit well so the prospective cut in the rate of monthly purchases was not good news. However, at the end of the day, the ECB will still be pumping in a considerable amount of liquidity so any losses should be mild. Much the same applies to equities. For the euro, the prospect of a sustained loose ECB policy combined with a probable Fed tightening next week was probably already priced in.
| |
|
2015 |
2016 |
% Change |
|
Index |
Dec 31 |
Dec 2 |
Dec 9 |
Week |
2016 |
| Asia/Pacific |
|
|
|
|
|
|
| Australia |
All Ordinaries |
5344.6 |
5502.6 |
5615.78 |
2.1% |
5.1% |
| Japan |
Nikkei 225 |
19033.7 |
18426.1 |
18996.37 |
3.1% |
-0.2% |
|
Topix |
1547.30 |
1477.98 |
1525.36 |
3.2% |
-1.4% |
| Hong Kong |
Hang Seng |
21914.4 |
22564.8 |
22760.98 |
0.9% |
3.9% |
| S. Korea |
Kospi |
1961.3 |
1970.6 |
2024.69 |
2.7% |
3.2% |
| Singapore |
STI |
2882.7 |
2919.4 |
2956.13 |
1.3% |
2.5% |
| China |
Shanghai Composite |
3539.2 |
3243.8 |
3232.88 |
-0.3% |
-8.7% |
|
|
|
|
|
|
|
| India |
Sensex 30 |
26117.5 |
26230.66 |
26747.18 |
2.0% |
2.4% |
| Indonesia |
Jakarta Composite |
4593.0 |
5246.0 |
5308.13 |
1.2% |
15.6% |
| Malaysia |
KLCI |
1692.5 |
1629.0 |
1641.42 |
0.8% |
-3.0% |
| Philippines |
PSEi |
6952.1 |
6886.7 |
7043.16 |
2.3% |
1.3% |
| Taiwan |
Taiex |
8338.1 |
9189.5 |
9392.68 |
2.2% |
12.6% |
| Thailand |
SET |
1288.0 |
1501.7 |
1526.32 |
1.6% |
18.5% |
|
|
|
|
|
|
|
| Europe |
|
|
|
|
|
|
| UK |
FTSE 100 |
6242.3 |
6730.7 |
6954.21 |
3.3% |
11.4% |
| France |
CAC |
4637.1 |
4528.8 |
4764.07 |
5.2% |
2.7% |
| Germany |
XETRA DAX |
10743.0 |
10513.4 |
11203.63 |
6.6% |
4.3% |
| Italy |
FTSE MIB |
21418.4 |
17086.9 |
18292.65 |
7.1% |
-14.6% |
| Spain |
IBEX 35 |
9544.2 |
8607.1 |
9169.60 |
6.5% |
-3.9% |
| Sweden |
OMX Stockholm 30 |
1446.8 |
1470.1 |
1534.27 |
4.4% |
6.0% |
| Switzerland |
SMI |
8818.1 |
7784.0 |
8099.63 |
4.1% |
-8.1% |
|
|
|
|
|
|
|
| North America |
|
|
|
|
|
|
| United States |
Dow |
17425.0 |
19170.4 |
19756.85 |
3.1% |
13.4% |
|
NASDAQ |
5007.4 |
5255.7 |
5444.50 |
3.6% |
8.7% |
|
S&P 500 |
2043.9 |
2192.0 |
2259.53 |
3.1% |
10.5% |
| Canada |
S&P/TSX Comp. |
13010.0 |
15052.5 |
15312.20 |
1.7% |
17.7% |
| Mexico |
Bolsa |
42977.5 |
44555.3 |
46913.470 |
5.3% |
9.2% |
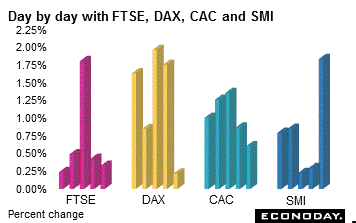 Equities rebounded from last week's losses and advanced across the board. Gains for the week ranged from 3.3 percent (FTSE) to 7.1 percent (MIB). The CAC was up 5.2 percent, the DAX advanced 6.6 percent and the SMI was 4.1 percent higher. Trading action was more subdued Friday as the euphoria generated by Thursday's European Central Bank announcement faded. The ECB announced Thursday that bond purchases will be extended until the end of next year, which was longer than expected. Equities rebounded from last week's losses and advanced across the board. Gains for the week ranged from 3.3 percent (FTSE) to 7.1 percent (MIB). The CAC was up 5.2 percent, the DAX advanced 6.6 percent and the SMI was 4.1 percent higher. Trading action was more subdued Friday as the euphoria generated by Thursday's European Central Bank announcement faded. The ECB announced Thursday that bond purchases will be extended until the end of next year, which was longer than expected.
The indexes rallied strongly on Wednesday thanks to bank stocks. Italian banks were among the top performers on reports that the Italian government will likely have to step in to rescue the country's third largest bank, Monte dei Paschi, after the ECB rejected its request for more time to work out a privately funded €5 billion rescue plan Friday.
The Bundesbank raised its growth forecast for Germany Growth underpinned by buoyant domestic demand that has been boosted by a strong labor market situation and rising household incomes. Gross domestic product is set to grow 1.8 percent this year, which was slightly faster than the 1.7 percent expansion predicted in June. Growth will continue at 1.8 percent next year, which was much stronger than 1.4 percent seen in June. The bank retained the projection for 2018 at 1.6 percent and predicted 1.5 percent expansion for 2019.
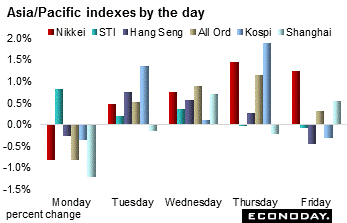 Equities in all countries covered here but China advanced on the week. Shares quickly rebounded after tumbling when the Italian constitutional vote results were known. The referendum was voted down and Prime Minister Matteo Renzi duly followed through with his threat to resign. Gains ranged from 0.8 percent (KLCI) to 3.2 percent (Topix). The Shanghai Composite lost 0.3 percent. Equities in all countries covered here but China advanced on the week. Shares quickly rebounded after tumbling when the Italian constitutional vote results were known. The referendum was voted down and Prime Minister Matteo Renzi duly followed through with his threat to resign. Gains ranged from 0.8 percent (KLCI) to 3.2 percent (Topix). The Shanghai Composite lost 0.3 percent.
Investors were disappointed that the Reserve Bank of India did not lower its interest rates given the monetary tumult caused by the demonetization of 500 and 1,000 rupee banknotes which was a policy enacted by the Government of India on November 8, 2016. All 500 and 1,000 rupee banknotes of the Mahatma Gandhi Series ceased to be legal tender in India from November 9, 2016.
The government claimed that the action was an effort to stop counterfeiting of the current banknotes allegedly used for funding terrorism. The move was also described as an effort to reduce corruption, the use of drugs and smuggling. However, in the days following the demonetization, banks and ATMs across the country faced severe cash shortages. The shortages negatively impacted many small businesses, agriculture and transportation. The Sensex tumbled in the immediate aftermath of the announcement. However, the action received support from several bankers as well as from some international commentators, but not of rival political parties. Indian equities regained their poise last week, rising 1.6 percent on the week after the European Central Bank prolonged its bond buying program by nine months to support a recovery.
On Friday, Japanese shares hit their highest level in a year, as the yen weakened against the dollar and a survey showed large Japanese manufacturers turned more optimistic about economic conditions in the fourth quarter.
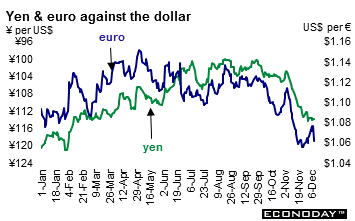 The U.S. dollar was up against all of its major counterparts with the exception of the Canadian dollar. The U.S. currency continues to climb — investors expect that the Federal Reserve will be increasing its fed funds rate on Wednesday. An increase in interest rates makes investments in the U.S. more attractive and the demand for the dollar as foreigners try to take advantage of higher rates pushes the currency's value upward. Also making the U.S. more attractive is its steady and increasing growth prospects. The U.S. dollar was up against all of its major counterparts with the exception of the Canadian dollar. The U.S. currency continues to climb — investors expect that the Federal Reserve will be increasing its fed funds rate on Wednesday. An increase in interest rates makes investments in the U.S. more attractive and the demand for the dollar as foreigners try to take advantage of higher rates pushes the currency's value upward. Also making the U.S. more attractive is its steady and increasing growth prospects.
The euro is sinking after the European Central Bank extended its asset purchase program for another nine months while maintaining a negative interest rate. Even though the European economies appear to be stabilizing and beginning to grow, future gains for the currency seem limited. The U.S. dollar's rally has been gaining momentum since the U.S. presidential election on November 8. After the European Central Bank announced a longer than expected extension to its landmark asset purchasing program to December 2017 the euro declined and the U.S. dollar climbed.
The Japanese yen continues to decline against the U.S. dollar. The yen weakened by the most among G-10 currencies, followed by the Norwegian krone, Swedish krona and the euro. The Federal Reserve and Bank of Japan have been following divergent policy paths. The Fed will most likely raise the fed funds rate Wednesday. However, the Bank of Japan currently maintains 10-year government bond yields near zero after announcing an innovative form of "yield curve control" in September.
|
|
2015 |
2016 |
% Change |
|
|
Dec 31 |
Dec 2 |
Dec 9 |
Week |
2016 |
| U.S. $ per currency |
|
|
|
|
|
|
| Australia |
A$ |
0.7288 |
0.745 |
0.745 |
0.0% |
2.2% |
| New Zealand |
NZ$ |
0.6833 |
0.714 |
0.714 |
0.0% |
4.4% |
| Canada |
C$ |
0.7231 |
0.753 |
0.759 |
0.8% |
4.9% |
| Eurozone |
euro (€) |
1.0871 |
1.066 |
1.055 |
-1.0% |
-2.9% |
| UK |
pound sterling (£) |
1.4742 |
1.272 |
1.257 |
-1.2% |
-14.7% |
|
|
|
|
|
|
|
| Currency per U.S. $ |
|
|
|
|
|
|
| China |
yuan |
6.4937 |
6.880 |
6.908 |
-0.4% |
-6.0% |
| Hong Kong |
HK$* |
7.7501 |
7.756 |
7.760 |
-0.1% |
-0.1% |
| India |
rupee |
66.1537 |
68.225 |
67.418 |
1.2% |
-1.9% |
| Japan |
yen |
120.2068 |
113.660 |
115.260 |
-1.4% |
4.3% |
| Malaysia |
ringgit |
4.2943 |
4.453 |
4.425 |
0.6% |
-2.9% |
| Singapore |
Singapore $ |
1.4179 |
1.421 |
1.431 |
-0.7% |
-0.9% |
| South Korea |
won |
1175.0600 |
1172.550 |
1165.930 |
0.6% |
0.8% |
| Taiwan |
Taiwan $ |
32.8620 |
31.891 |
31.823 |
0.2% |
3.3% |
| Thailand |
baht |
36.0100 |
35.588 |
35.650 |
-0.2% |
1.0% |
| Switzerland |
Swiss franc |
1.0014 |
1.0107 |
1.0179 |
-0.7% |
-1.6% |
| *Pegged to U.S. dollar |
|
|
|
|
|
|
| Source: Bloomberg |
|
|
|
|
|
|
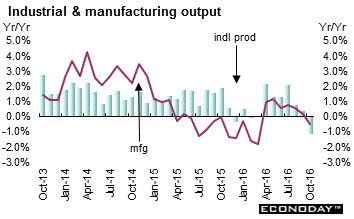
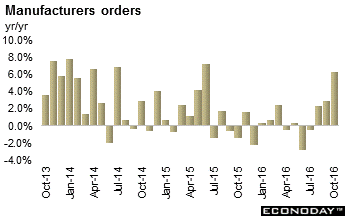 October manufacturing orders jumped 4.9 percent, their largest month rise since July 2014. Annual growth was 6.3 percent, a marked improvement on September's 2.9 percent. Monthly growth was apparent in all three main subsectors with capital goods dominating at a surge of 7.2 percent. Intermediates advanced 1.8 percent and consumer goods were up 0.5 percent. Domestic orders were up 6.3 percent, comfortably ahead of their overseas counterpart (3.9 percent). Compared with their average third quarter level, overall orders were almost 5 percent firmer. October manufacturing orders jumped 4.9 percent, their largest month rise since July 2014. Annual growth was 6.3 percent, a marked improvement on September's 2.9 percent. Monthly growth was apparent in all three main subsectors with capital goods dominating at a surge of 7.2 percent. Intermediates advanced 1.8 percent and consumer goods were up 0.5 percent. Domestic orders were up 6.3 percent, comfortably ahead of their overseas counterpart (3.9 percent). Compared with their average third quarter level, overall orders were almost 5 percent firmer.
 October industrial production was up 0.3 percent following a slightly smaller revised 1.6 percent monthly fall in September. Output was 1.2 percent higher than a year ago, down from a 1.3 percent annual gain last time. October's disappointingly small advance was attributable to weakness in intermediates and energy, both down a monthly 0.5 percent. Consumer goods (0.1 percent) were also soft and capital goods (0.5 percent) came nowhere close to reversing their September plunge (2.7 percent). The overall increase would have been even less but for a solid advance in construction (1.7 percent). Manufacturing expanded a minimal 0.1 percent. October industrial production was up 0.3 percent following a slightly smaller revised 1.6 percent monthly fall in September. Output was 1.2 percent higher than a year ago, down from a 1.3 percent annual gain last time. October's disappointingly small advance was attributable to weakness in intermediates and energy, both down a monthly 0.5 percent. Consumer goods (0.1 percent) were also soft and capital goods (0.5 percent) came nowhere close to reversing their September plunge (2.7 percent). The overall increase would have been even less but for a solid advance in construction (1.7 percent). Manufacturing expanded a minimal 0.1 percent.
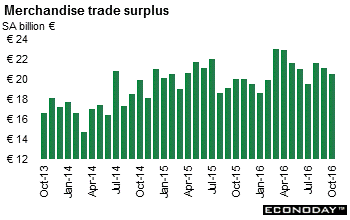 October seasonally adjusted trade surplus was €20.5 billion, down from a marginally smaller revised €21.1 billion in September and the least black ink since July. The unadjusted surplus was €19.3 billion compared with €21.7 billion a year ago. The headline deterioration reflected a 0.5 percent monthly increase in exports that was more than offset by a 1.4 percent increase in imports. The rebound in the former followed a 1.1 percent decline in September while the advance in the latter came after a 0.8 percent drop last time. Compared with October 2015, exports were down an unadjusted 4.1 percent while imports were off 2.2 percent. October seasonally adjusted trade surplus was €20.5 billion, down from a marginally smaller revised €21.1 billion in September and the least black ink since July. The unadjusted surplus was €19.3 billion compared with €21.7 billion a year ago. The headline deterioration reflected a 0.5 percent monthly increase in exports that was more than offset by a 1.4 percent increase in imports. The rebound in the former followed a 1.1 percent decline in September while the advance in the latter came after a 0.8 percent drop last time. Compared with October 2015, exports were down an unadjusted 4.1 percent while imports were off 2.2 percent.
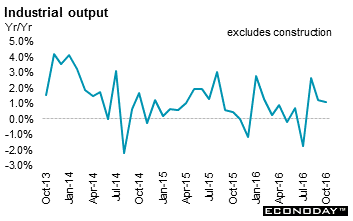
 October industrial production declined 1.3 percent on the month, its worst performance since September 2012. Annual growth of output dropped from 0.4 percent to minus 1.1 percent, its first negative print since December last year. Manufacturing was down 0.9 percent from September and down 0.4 percent from a year ago. On the month, pharmaceuticals declined 3.6 percent, textiles & leather was down 4.0 percent, food & drink retreated 1.0 percent and other manufacturing & repair was 1.3 percent lower. The only increase of any real note was in coke & petroleum (1.9 percent). Total industrial production was further hit by an 8.6 percent tumble in mining & quarrying, largely reflecting the closure of the N. Sea's Buzzard oil field. This was only partially offset by gains in electricity & gas (3.5 percent) and water supply (1.8 percent). October industrial production declined 1.3 percent on the month, its worst performance since September 2012. Annual growth of output dropped from 0.4 percent to minus 1.1 percent, its first negative print since December last year. Manufacturing was down 0.9 percent from September and down 0.4 percent from a year ago. On the month, pharmaceuticals declined 3.6 percent, textiles & leather was down 4.0 percent, food & drink retreated 1.0 percent and other manufacturing & repair was 1.3 percent lower. The only increase of any real note was in coke & petroleum (1.9 percent). Total industrial production was further hit by an 8.6 percent tumble in mining & quarrying, largely reflecting the closure of the N. Sea's Buzzard oil field. This was only partially offset by gains in electricity & gas (3.5 percent) and water supply (1.8 percent).
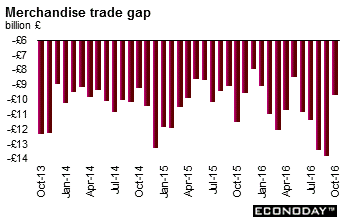 October deficit on global trade in goods narrowed from a sharply larger revised Stg13.83 billion in September to a significantly smaller than expected Stg9.71 billion in October, the least red ink since May. Excluding oil and other erratic items the shortfall was Stg9.86 billion, down from Stg11.58 billion last time. The headline improvement reflected an 8.7 percent monthly jump in exports, compounded by a 5.2 percent drop in imports. The increase in exports (to a record Stg28.6 billion) was attributable to solid gains in machinery & transport equipment, material manufactures, chemicals and unspecified goods. Underlying exports were up 4.8 percent while their import counterpart fell 2.0 percent. Regionally the shrinkage in the deficit was mainly due to a marked narrowing in the shortfall with non-EU countries which declined from Stg5.27 billion to Stg1.60 billion, a 5-month low. Net exports to the rest of the EU weighed in at a deficit of Stg8.11 billion after Stg8.56 billion in September. October deficit on global trade in goods narrowed from a sharply larger revised Stg13.83 billion in September to a significantly smaller than expected Stg9.71 billion in October, the least red ink since May. Excluding oil and other erratic items the shortfall was Stg9.86 billion, down from Stg11.58 billion last time. The headline improvement reflected an 8.7 percent monthly jump in exports, compounded by a 5.2 percent drop in imports. The increase in exports (to a record Stg28.6 billion) was attributable to solid gains in machinery & transport equipment, material manufactures, chemicals and unspecified goods. Underlying exports were up 4.8 percent while their import counterpart fell 2.0 percent. Regionally the shrinkage in the deficit was mainly due to a marked narrowing in the shortfall with non-EU countries which declined from Stg5.27 billion to Stg1.60 billion, a 5-month low. Net exports to the rest of the EU weighed in at a deficit of Stg8.11 billion after Stg8.56 billion in September.
 Third quarter gross domestic product was revised to an increase of 0.3 percent, down from the initial 0.5 percent estimate. On an annualized basis, GDP was up 1.3 percent, down from the original 2.2 percent estimate. On the year, GDP was up 1.0 percent. Upward revisions were made to private consumption, private residential investment and public demand. These upward revisions were offset by weaker private non-residential investment and net exports. Data in this release incorporate a change in the base year for GDP calculations from 2005 to 2011, with various other changes to methodology adopted to align with updated international standards. Third quarter gross domestic product was revised to an increase of 0.3 percent, down from the initial 0.5 percent estimate. On an annualized basis, GDP was up 1.3 percent, down from the original 2.2 percent estimate. On the year, GDP was up 1.0 percent. Upward revisions were made to private consumption, private residential investment and public demand. These upward revisions were offset by weaker private non-residential investment and net exports. Data in this release incorporate a change in the base year for GDP calculations from 2005 to 2011, with various other changes to methodology adopted to align with updated international standards.
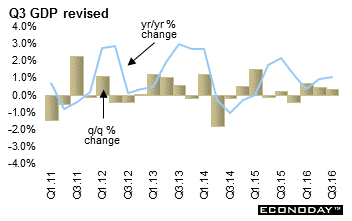
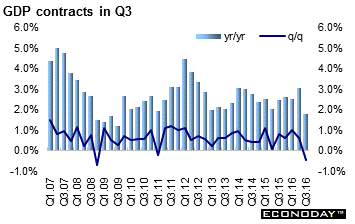 Third quarter gross domestic product was down 0.5 percent on the quarter but up 1.8 percent from a year ago. GDP last contracted for a quarter in 2011. The decline was driven by private investment, government spending and net exports. Weakness in investment was again driven by the mining sector down for the 12th consecutive quarter which dropped 10.6 percent. This was partially offset by an increase of 4.8 percent in non-mining investment. Household consumption was the only major expenditure component to make a positive contribution to GDP growth, increasing 0.4 percent on the quarter and 2.5 percent on the year. On an industry basis, the construction sector was down 3.6 percent on the quarter. Other weak sectors included financial & insurance services, professional scientific & technical services, rental hiring & real estate services and administrative support services. Mining output was flat on the quarter, while agricultural production advanced. Third quarter gross domestic product was down 0.5 percent on the quarter but up 1.8 percent from a year ago. GDP last contracted for a quarter in 2011. The decline was driven by private investment, government spending and net exports. Weakness in investment was again driven by the mining sector down for the 12th consecutive quarter which dropped 10.6 percent. This was partially offset by an increase of 4.8 percent in non-mining investment. Household consumption was the only major expenditure component to make a positive contribution to GDP growth, increasing 0.4 percent on the quarter and 2.5 percent on the year. On an industry basis, the construction sector was down 3.6 percent on the quarter. Other weak sectors included financial & insurance services, professional scientific & technical services, rental hiring & real estate services and administrative support services. Mining output was flat on the quarter, while agricultural production advanced.
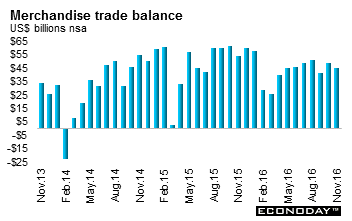 November merchandise trade surplus declined to $44.61 billion from $49.1 billion in October. On the year, exports were down 4.3 percent while imports were 2.3 percent higher. In yuan terms, the surplus was 298.11 billion yuan. Exports on the year in yuan terms were up 5.9 percent and imports were 13.0 percent higher. On the year, exports to the United States rose 6.9 percent after falling by 5.6 percent in October, while those to the European Union rose 5.1 percent after declining 8.6 percent. Exports to Japan were up 3.2 percent after falling by 3.2 percent. November merchandise trade surplus declined to $44.61 billion from $49.1 billion in October. On the year, exports were down 4.3 percent while imports were 2.3 percent higher. In yuan terms, the surplus was 298.11 billion yuan. Exports on the year in yuan terms were up 5.9 percent and imports were 13.0 percent higher. On the year, exports to the United States rose 6.9 percent after falling by 5.6 percent in October, while those to the European Union rose 5.1 percent after declining 8.6 percent. Exports to Japan were up 3.2 percent after falling by 3.2 percent.
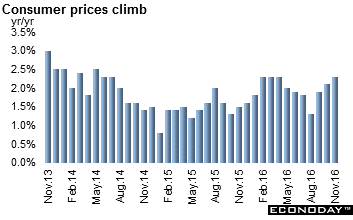 November consumer price index was up 2.3 percent when compared with a year ago. This was the third consecutive increase in the CPI and is the strongest increase in consumer prices since February, March and April when the CPI also rose by 2.3 percent from year ago. On the month, the CPI edged up 0.1 percent for its fourth consecutive increase. Urban CPI was up 2.3 percent and rural CPI was up 2.0 percent on the year. The CPI was pushed up by a further acceleration in food prices, up from 3.7 percent in October to 4.0 percent in November. Food prices are now the highest since June. Non-food price inflation has also picked up in each of the last three months, increasing from 1.7 percent in October to 1.8 percent in November. Most categories of consumer spending saw faster annual price increases in November, though inflation eased for health care and household articles & service. November consumer price index was up 2.3 percent when compared with a year ago. This was the third consecutive increase in the CPI and is the strongest increase in consumer prices since February, March and April when the CPI also rose by 2.3 percent from year ago. On the month, the CPI edged up 0.1 percent for its fourth consecutive increase. Urban CPI was up 2.3 percent and rural CPI was up 2.0 percent on the year. The CPI was pushed up by a further acceleration in food prices, up from 3.7 percent in October to 4.0 percent in November. Food prices are now the highest since June. Non-food price inflation has also picked up in each of the last three months, increasing from 1.7 percent in October to 1.8 percent in November. Most categories of consumer spending saw faster annual price increases in November, though inflation eased for health care and household articles & service.
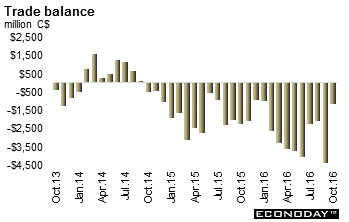 Canada's merchandise trade deficit narrowed to C$1.1 billion — the smallest since January 2016 from a revised C$4.4 billion deficit in September. Imports dropped 6.3 percent in October, following a record high in September related to a one time exceptionally large shipment destined for the Hebron offshore oil project from South Korea. Import volumes decreased 6.2 percent. Exports increased 0.5 percent as a 1.2 percent increase in prices was partially offset by a 0.7 percent decline in volumes. On the year, imports were down 1.3 percent and exports were up 1.3 percent. Canada's merchandise trade deficit narrowed to C$1.1 billion — the smallest since January 2016 from a revised C$4.4 billion deficit in September. Imports dropped 6.3 percent in October, following a record high in September related to a one time exceptionally large shipment destined for the Hebron offshore oil project from South Korea. Import volumes decreased 6.2 percent. Exports increased 0.5 percent as a 1.2 percent increase in prices was partially offset by a 0.7 percent decline in volumes. On the year, imports were down 1.3 percent and exports were up 1.3 percent.
Four central banks met last week. All left their respective policy interest rates unchanged. The European Central Bank however, extended its asset purchase program to the end of 2017 from March but lower the amount it would purchase each month. Economic data were mixed globally. China's merchandise trade and inflation data improved in November while Australia's economy failed to grow for the first quarter since the first quarter of 2011. Germany's manufacturing orders soared while industrial production disappointed. In short — a very mixed bag of economic data.
| Central Bank activities |
|
| Dec 14 |
United States |
FOMC Monetary Policy Announcement |
|
|
Fed Chair Janet Yellen Press Conference |
| Dec 15 |
UK |
Bank of England Monetary Policy Announcement |
| |
|
|
| The following indicators will be released this week... |
| Europe |
|
|
| Dec 13 |
Germany |
ZEW Survey (December) |
|
UK |
Consumer Price Index (November) |
|
|
Producer Price Index (November) |
| Dec 14 |
Eurozone |
Industrial Production (October) |
|
UK |
Labour Market Report (November) |
| Dec 15 |
Eurozone |
Manufacturing , Services & Composite PMI December flash) |
|
Germany |
Manufacturing , Services & Composite PMI December flash) |
|
France |
Manufacturing , Services & Composite PMI December flash) |
|
UK |
Retail Sales (November) |
| Dec 16 |
Eurozone |
Merchandise Trade Balance (October) |
|
|
Harmonized Index of Consumer Prices (November) |
| |
|
|
| Asia Pacific |
|
|
| Dec 12 |
Japan |
Producer Price Index (November) |
|
|
Machine Orders (October) |
| Dec 13 |
China |
Industrial Production (November) |
|
|
Retail Sales (November) |
| Dec 14 |
Japan |
Tankan Survey (Q4. 2016) |
| Dec 15 |
Japan |
PMI Manufacturing Index (December flash) |
| |
|
|
| Americas |
|
|
| Dec 15 |
Canada |
Manufacturing Sales (October) |
Anne D Picker is the author of International Economic Indicators and Central Banks.
|
