|
Without giving too much away, there may be indications that a pivot higher in inflation is underway, a pivot taking place right at the Fed's 2 percent line. I know Janet Yellen said just this week that the Fed is not behind the inflation curve and that inflation isn't likely to surge even as the labor market strengthens. Yet policy overshoot is always an interesting topic — especially when aggressive fiscal stimulus is around the corner.
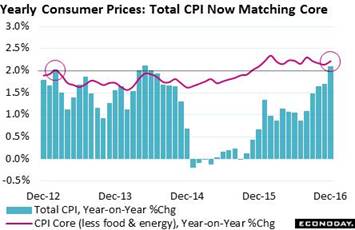 Inflation is here! At 2.1 percent for total consumer prices (columns in graph) and 2.2 percent for the core rate (red line). Two percent is generally considered the target rate for inflation, that is the rate consistent with stable and sustainable economic growth. The last time both the CPI and the core were actually together at the 2 percent line was way back in February 2013. It's the easy energy comparisons that are giving the total CPI a boost as higher prices now compare with very low prices a year ago. An average gallon of regular costs $2.38 right now, up 17 percent from a year ago. This comparison will get even easier as gas last year dipped to $1.82 in February and stayed weak out to May at $2.24. But the core, which excludes energy, won't be getting this comparison boost and is likely therefore to lag the total CPI in the months ahead. For those policy makers who are less worried about inflation and less eager to raise rates, the core could become a popular indicator to cite. Inflation is here! At 2.1 percent for total consumer prices (columns in graph) and 2.2 percent for the core rate (red line). Two percent is generally considered the target rate for inflation, that is the rate consistent with stable and sustainable economic growth. The last time both the CPI and the core were actually together at the 2 percent line was way back in February 2013. It's the easy energy comparisons that are giving the total CPI a boost as higher prices now compare with very low prices a year ago. An average gallon of regular costs $2.38 right now, up 17 percent from a year ago. This comparison will get even easier as gas last year dipped to $1.82 in February and stayed weak out to May at $2.24. But the core, which excludes energy, won't be getting this comparison boost and is likely therefore to lag the total CPI in the months ahead. For those policy makers who are less worried about inflation and less eager to raise rates, the core could become a popular indicator to cite.
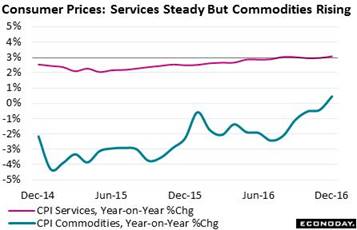 Energy is giving a big boost to commodity prices in the consumer price report and may soon be giving a second-round lift to service prices as well. Underpinned by medical and housing costs, service inflation has been steadily sloping higher to the 3 percent line. For us historians, services moved to 4 percent during the mid-stretch of the 2002-2009 economic cycle (a level to mark next if inflation begins to take off). A sudden move higher for the red line of the accompanying graph would not be a welcome signal. Energy is giving a big boost to commodity prices in the consumer price report and may soon be giving a second-round lift to service prices as well. Underpinned by medical and housing costs, service inflation has been steadily sloping higher to the 3 percent line. For us historians, services moved to 4 percent during the mid-stretch of the 2002-2009 economic cycle (a level to mark next if inflation begins to take off). A sudden move higher for the red line of the accompanying graph would not be a welcome signal.
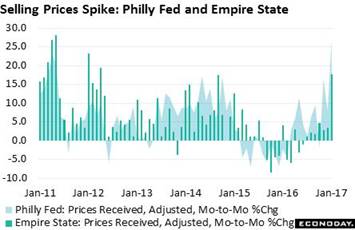 And well over the red line are January's advance indications on prices. The highlight of a superheated Philly Fed report is a 19 point jump in selling prices to 26.8. This is the strongest price traction of the current cycle. The highlight of the January Empire State report is likewise selling prices, a 14 point jump to a 5-year high of 17.6. These two reports point to unusually aggressive first-of-year price increases in the factory sector, well beyond what seasonal adjustments were looking for. Input costs are also on the sharp climb, at a 5-year high for the Philly Fed and a 3-year high for Empire State. And well over the red line are January's advance indications on prices. The highlight of a superheated Philly Fed report is a 19 point jump in selling prices to 26.8. This is the strongest price traction of the current cycle. The highlight of the January Empire State report is likewise selling prices, a 14 point jump to a 5-year high of 17.6. These two reports point to unusually aggressive first-of-year price increases in the factory sector, well beyond what seasonal adjustments were looking for. Input costs are also on the sharp climb, at a 5-year high for the Philly Fed and a 3-year high for Empire State.
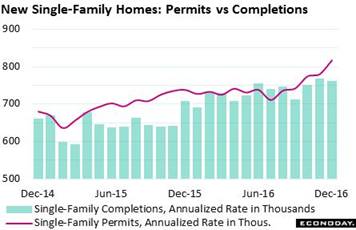 Some of the strongest price traction from last year came from home prices which, boosted by lack of supply, rose about 5 to 6 percent. Homes for sale are scarce which is a plus for appreciation as well as for home builders. Permits for single-family homes rose 4.7 percent in December to a cycle high 817,000 annualized rate. But completions have had a hard time keeping up, rising 8.7 percent on the year vs 10.7 percent for permits. Home builders are busy and their housing market report shows it with heights not seen since the subprime boom 10 years ago. Will home prices post greater gains this year? If rising buyer traffic means anything they will. Traffic in the home builders report, reflecting new buyers in the market, is suddenly at an 11-year high. Some of the strongest price traction from last year came from home prices which, boosted by lack of supply, rose about 5 to 6 percent. Homes for sale are scarce which is a plus for appreciation as well as for home builders. Permits for single-family homes rose 4.7 percent in December to a cycle high 817,000 annualized rate. But completions have had a hard time keeping up, rising 8.7 percent on the year vs 10.7 percent for permits. Home builders are busy and their housing market report shows it with heights not seen since the subprime boom 10 years ago. Will home prices post greater gains this year? If rising buyer traffic means anything they will. Traffic in the home builders report, reflecting new buyers in the market, is suddenly at an 11-year high.
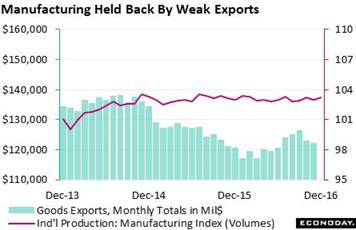 But slow down. Not all the week's news raises the word acceleration. Putting aside for a moment January's Philly Fed and Empire State reports, the factory sector ended last year with a thud. The manufacturing component of the industrial production could manage only a 0.2 percent gain in December, one that followed a 0.1 percent decline in November. Factory output during 2016 (red line) proved dead flat once again, not getting any help from exports (columns). Exports were on the rise several years back and were helping production as seen on the left side of the graph, but the progress has since fizzled. Exports aren't tracked in industrial production but rather in the international trade report where advance data for December will be posted on Thursday, January 26. Turning back to Empire State and the Philly Fed, many of the readings in these reports, especially for Philly, do point strongly to rising strength and an improved factory performance for the first quarter. But slow down. Not all the week's news raises the word acceleration. Putting aside for a moment January's Philly Fed and Empire State reports, the factory sector ended last year with a thud. The manufacturing component of the industrial production could manage only a 0.2 percent gain in December, one that followed a 0.1 percent decline in November. Factory output during 2016 (red line) proved dead flat once again, not getting any help from exports (columns). Exports were on the rise several years back and were helping production as seen on the left side of the graph, but the progress has since fizzled. Exports aren't tracked in industrial production but rather in the international trade report where advance data for December will be posted on Thursday, January 26. Turning back to Empire State and the Philly Fed, many of the readings in these reports, especially for Philly, do point strongly to rising strength and an improved factory performance for the first quarter.
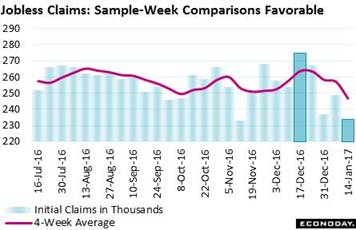 We end the week's run with the latest on the labor market, which is the economy's greatest strength and, perhaps, next source of inflation. Initial jobless claims are down very sharply this month indicating once again that employers are holding onto their people as tightly as they can. Claims fell 15,000 to a near record low of 234,000 in data for the January 14 week. This was also the sample week of the monthly employment report and a comparison with the sample week of the December report is unusually favorable, down 41,000 with the 4-week average down 17,000. Yes claims data are volatile this time of year, but these comparisons point strongly to labor market health and to stronger nonfarm growth in January than the moderate 156,000 showing in December. And as for wage inflation? We leave with a reminder from the December employment report where year-on-year wage growth, at 2.9 percent, made a cycle high of its own. We end the week's run with the latest on the labor market, which is the economy's greatest strength and, perhaps, next source of inflation. Initial jobless claims are down very sharply this month indicating once again that employers are holding onto their people as tightly as they can. Claims fell 15,000 to a near record low of 234,000 in data for the January 14 week. This was also the sample week of the monthly employment report and a comparison with the sample week of the December report is unusually favorable, down 41,000 with the 4-week average down 17,000. Yes claims data are volatile this time of year, but these comparisons point strongly to labor market health and to stronger nonfarm growth in January than the moderate 156,000 showing in December. And as for wage inflation? We leave with a reminder from the December employment report where year-on-year wage growth, at 2.9 percent, made a cycle high of its own.
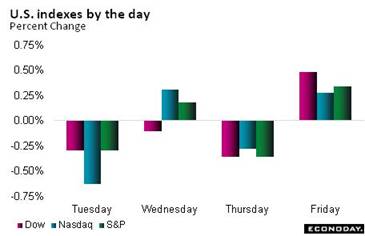 Anticipation of President Trump's inauguration held stocks in check during the week but the Dow rallied on Friday, up 0.5 percent to 19,827. Gold had a good week, up 0.9 percent to $1,209, but the 10-year Treasury had a bad week, rising 8 basis points to 2.47 percent and back near the 2.60 percent post-election peak of mid-December. Wednesday's Treasury International Capital report had surprises of its own as Chinese accounts reduced their holdings of long-term U.S. Treasuries substantially in November, down $66.4 billion in the month to $1.05 trillion. This is the lowest total since June 2010. With talk of a trade war heating up, China's Treasury holdings and auction participation will be things to watch. Anticipation of President Trump's inauguration held stocks in check during the week but the Dow rallied on Friday, up 0.5 percent to 19,827. Gold had a good week, up 0.9 percent to $1,209, but the 10-year Treasury had a bad week, rising 8 basis points to 2.47 percent and back near the 2.60 percent post-election peak of mid-December. Wednesday's Treasury International Capital report had surprises of its own as Chinese accounts reduced their holdings of long-term U.S. Treasuries substantially in November, down $66.4 billion in the month to $1.05 trillion. This is the lowest total since June 2010. With talk of a trade war heating up, China's Treasury holdings and auction participation will be things to watch.
| Markets at a Glance |
Year-End |
Week Ended |
Week Ended |
Year-To-Date |
Weekly |
|
2016 |
20-Jan-17 |
27-Jan-17 |
Change |
Change |
| DJIA |
19,762.60 |
19,885.73 |
19,827.25 |
0.3% |
-0.3% |
| S&P 500 |
2,238.83 |
2,274.64 |
2,271.31 |
1.4% |
-0.1% |
| Nasdaq Composite |
5,383.12 |
5,574.12 |
5,555.33 |
3.2% |
-0.3% |
|
|
|
|
|
|
| Crude Oil, WTI ($/barrel) |
$53.71 |
$52.54 |
$52.33 |
-2.6% |
-0.4% |
| Gold (COMEX) ($/ounce) |
$1,152.50 |
$1,197.70 |
$1,209.00 |
4.9% |
0.9% |
|
|
|
|
|
|
| Fed Funds Target |
0.50 to 0.75% |
0.50 to 0.75% |
0.50 to 0.75% |
0 bp |
0 bp |
| 2-Year Treasury Yield |
1.21% |
1.20% |
1.20% |
–1 bp |
0 bp |
| 10-Year Treasury Yield |
2.45% |
2.39% |
2.47% |
2 bp |
8 bp |
| Dollar Index |
102.26 |
101.24 |
100.85 |
-1.4% |
-0.4% |
Though the Fed's PCE targets lag the CPI by several tenths, inflation indications are unquestionably on the rise. And Janet Yellen did remind everyone at midweek that several rate hikes are probably in store for this year, hikes that would be aimed at slowing inflation. But holding down inflation might also involve holding down the jobs market, a give-and-take that may be the coming policy theme.
Friday's first estimate of fourth-quarter GDP will be the big story of a week that gets going on Tuesday with the manufacturing PMI, a flash for January that follows strength in the Empire State and especially Philly Fed report. Also on Tuesday will be existing home sales where further gains are not expected. Advance data on the nation's goods deficit, which has been running high, will be out Thursday, data that will be part of Friday's GDP report, one where consumer spending may be a plus but rising inventories an unwanted plus.
Existing Home Sales for December
Consensus Forecast, Annualized Rate: 5.538 million
Consensus Range: 5.450 to 5.590 million
Existing home sales have been on a steady but no more than moderate climb and may now be getting held down by higher mortgage rates. Forecasters see December's sales falling 1.3 percent to a 5.538 million annualized rate and down from cycle highs in November and October. Going into December, single-family resales were nearing a 5 million rate with condos at 660,000. But pending sales of existing homes, advance data that track initial contract signings, fell a sizable 2.5 percent in the last report.
International Trade In Goods for November
Consensus Forecast, Month-to-Month Change: -$65.3 billion
Consensus Range: -$66.0 to -$63.5 billion
Hit by sharp declines in exports, the nation's trade deficit in goods widened sharply in November, to $66.6 billion (revised from $65.3 billion in the advance report). Adding to the deficit was a rise in imports centered in consumer goods. Forecasters see December's trade deficit in goods narrowing back to November's initial estimate, at $65.3 billion.
Initial Jobless Claims for January 21 week
Consensus Forecast: 247,000
Consensus Range: 244,000 to 250,000
Initial jobless claims fell a sharp 15,000 to 234,000 in the January 14 week and forecasters see a reversal for the January 21 week, up a consensus 13,000 to 247,000. Claims data have been very low and consistent with strong demand for labor.
New Home Sales for December
Consensus Forecast, Annualized Rate: 590,000
Consensus Range: 569,000 to 605,000
New home sales can be extremely volatile month to month, as they were in November when they jumped 5.2 percent. The 3-month average, however, at a 575,000 million annualized rate, has been holding steady for the last six months. And year-on-year growth in this series is striking, at 16.5 percent in the last report. Forecasters are not looking for much give back in December, down only 0.3 percent to a consensus 590,000 rate.
Index of Leading Economic Indicators for December
Consensus Forecast, Month-to-Month Change: 0.4%
Consensus Range: 0.2% to 0.6%
The index of leading economic indicators has been pointing to flat economic conditions ahead and failed, despite gains in confidence and the stock market, to signal any strength in November, coming in unchanged due to weakness in building permits and factory components. For December, the LEI is expected to bounce higher with a 0.4 percent gain.
Durable Goods Orders for December
Consensus Forecast, Month-to-Month Change: 3.0%
Consensus Range: 1.5% to 7.0%
Durable Goods Orders, Ex-Transportation
Consensus Forecast: 0.4%
Consensus Range: 0.2% to 0.8%
Durable goods orders have swung very sharply the last two months, down 4.6 percent in November following a 4.8 percent rise in October. Ex-transportation orders, which strip out monthly swings in aircraft, have been coming alive, up 0.5 percent and up 0.9 percent the last two reports. Core capital goods orders (nondefense ex-aircraft) showed significant strength in November, up 0.9 percent, but on trend have not been strong. The Econoday consensus for durables orders is a swing higher of 3.0 percent with ex-transportation showing another month of consistent strength at 0.4 percent.
Real GDP, 4th Quarter, 1st Estimate, Annualized Rate
Consensus Forecast: 2.2%
Consensus Range: 1.8% to 3.3%
GDP Price Index
Consensus Forecast: 2.1%
Consensus Range: 1.8% to 2.4%
The first estimate of fourth-quarter GDP is expected to come in at a consensus plus 2.2 percent, down from 3.5 percent in the third quarter. Negatives look to be a wider trade gap and perhaps a slowdown in consumer spending, which had been very solid at 2.8 and 4.3 percent in the prior two quarters. An unwanted plus may be a build in inventories. Such results would contrast with the post-election surge in both consumer and business expectations. The GDP price index, which was subdued in the third quarter at 1.4 percent, is seen firming to 2.1 percent, the result in part of higher energy prices.
Consumer Sentiment Index, Final January
Consensus Forecast: 98.2
Consensus Range: 98.0 to 99.0
Consumer sentiment held at post-election highs in the preliminary reading for January, at 98.1 and little changed from 98.2 in December. The preliminary report noted that partisanship is extreme right now with 44 percent of the sample citing the importance of government policies (whether positive or negative). The cycle average for this reference is 20 percent. Forecasters see the final January index coming in at 98.2.
|
